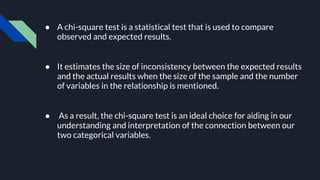
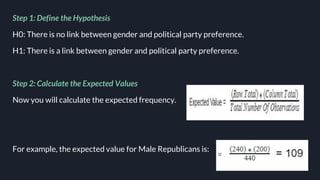
The chi-square test is used to determine if there is a significant difference between expected frequencies and observed frequencies in categorical data. It compares observed values to expected values that would occur according to a specific hypothesis. The chi-square test formula calculates the sum of the squares of the differences between observed and expected values divided by the expected value. A researcher would perform a chi-square test on survey data to understand the relationship between categorical variables like gender, age, and responses.


![How to calculate CHI SQUARE TEST ?
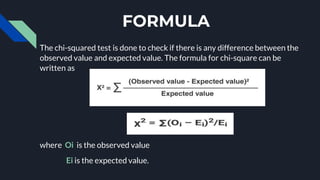
The value of the Chi-squared statistic can be calculated using the formula given below:
For each observed number in the data,
subtract the expected value, i.e. (O — E).
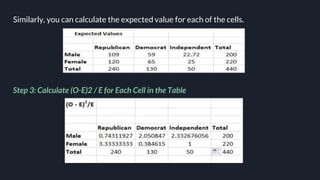
Square the difference, (O — E)^2
Divide these squares by the expected value of each observation. i.e. [(O – E)^2 / E]
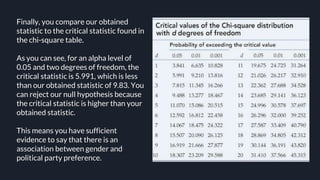
Now sum of these values.
Thus, the obtained value will be the chi-squared statistic.](https://image.slidesharecdn.com/chisquaretest-240216150330-f272facc/85/Chi-square-test-evidence-based-dentistry-7-320.jpg)


![Tools of dental_public_health[1]](https://cdn.slidesharecdn.com/ss_thumbnails/toolsofdentalpublichealth1-151108134342-lva1-app6891-thumbnail.jpg?width=640&height=640&fit=bounds)


