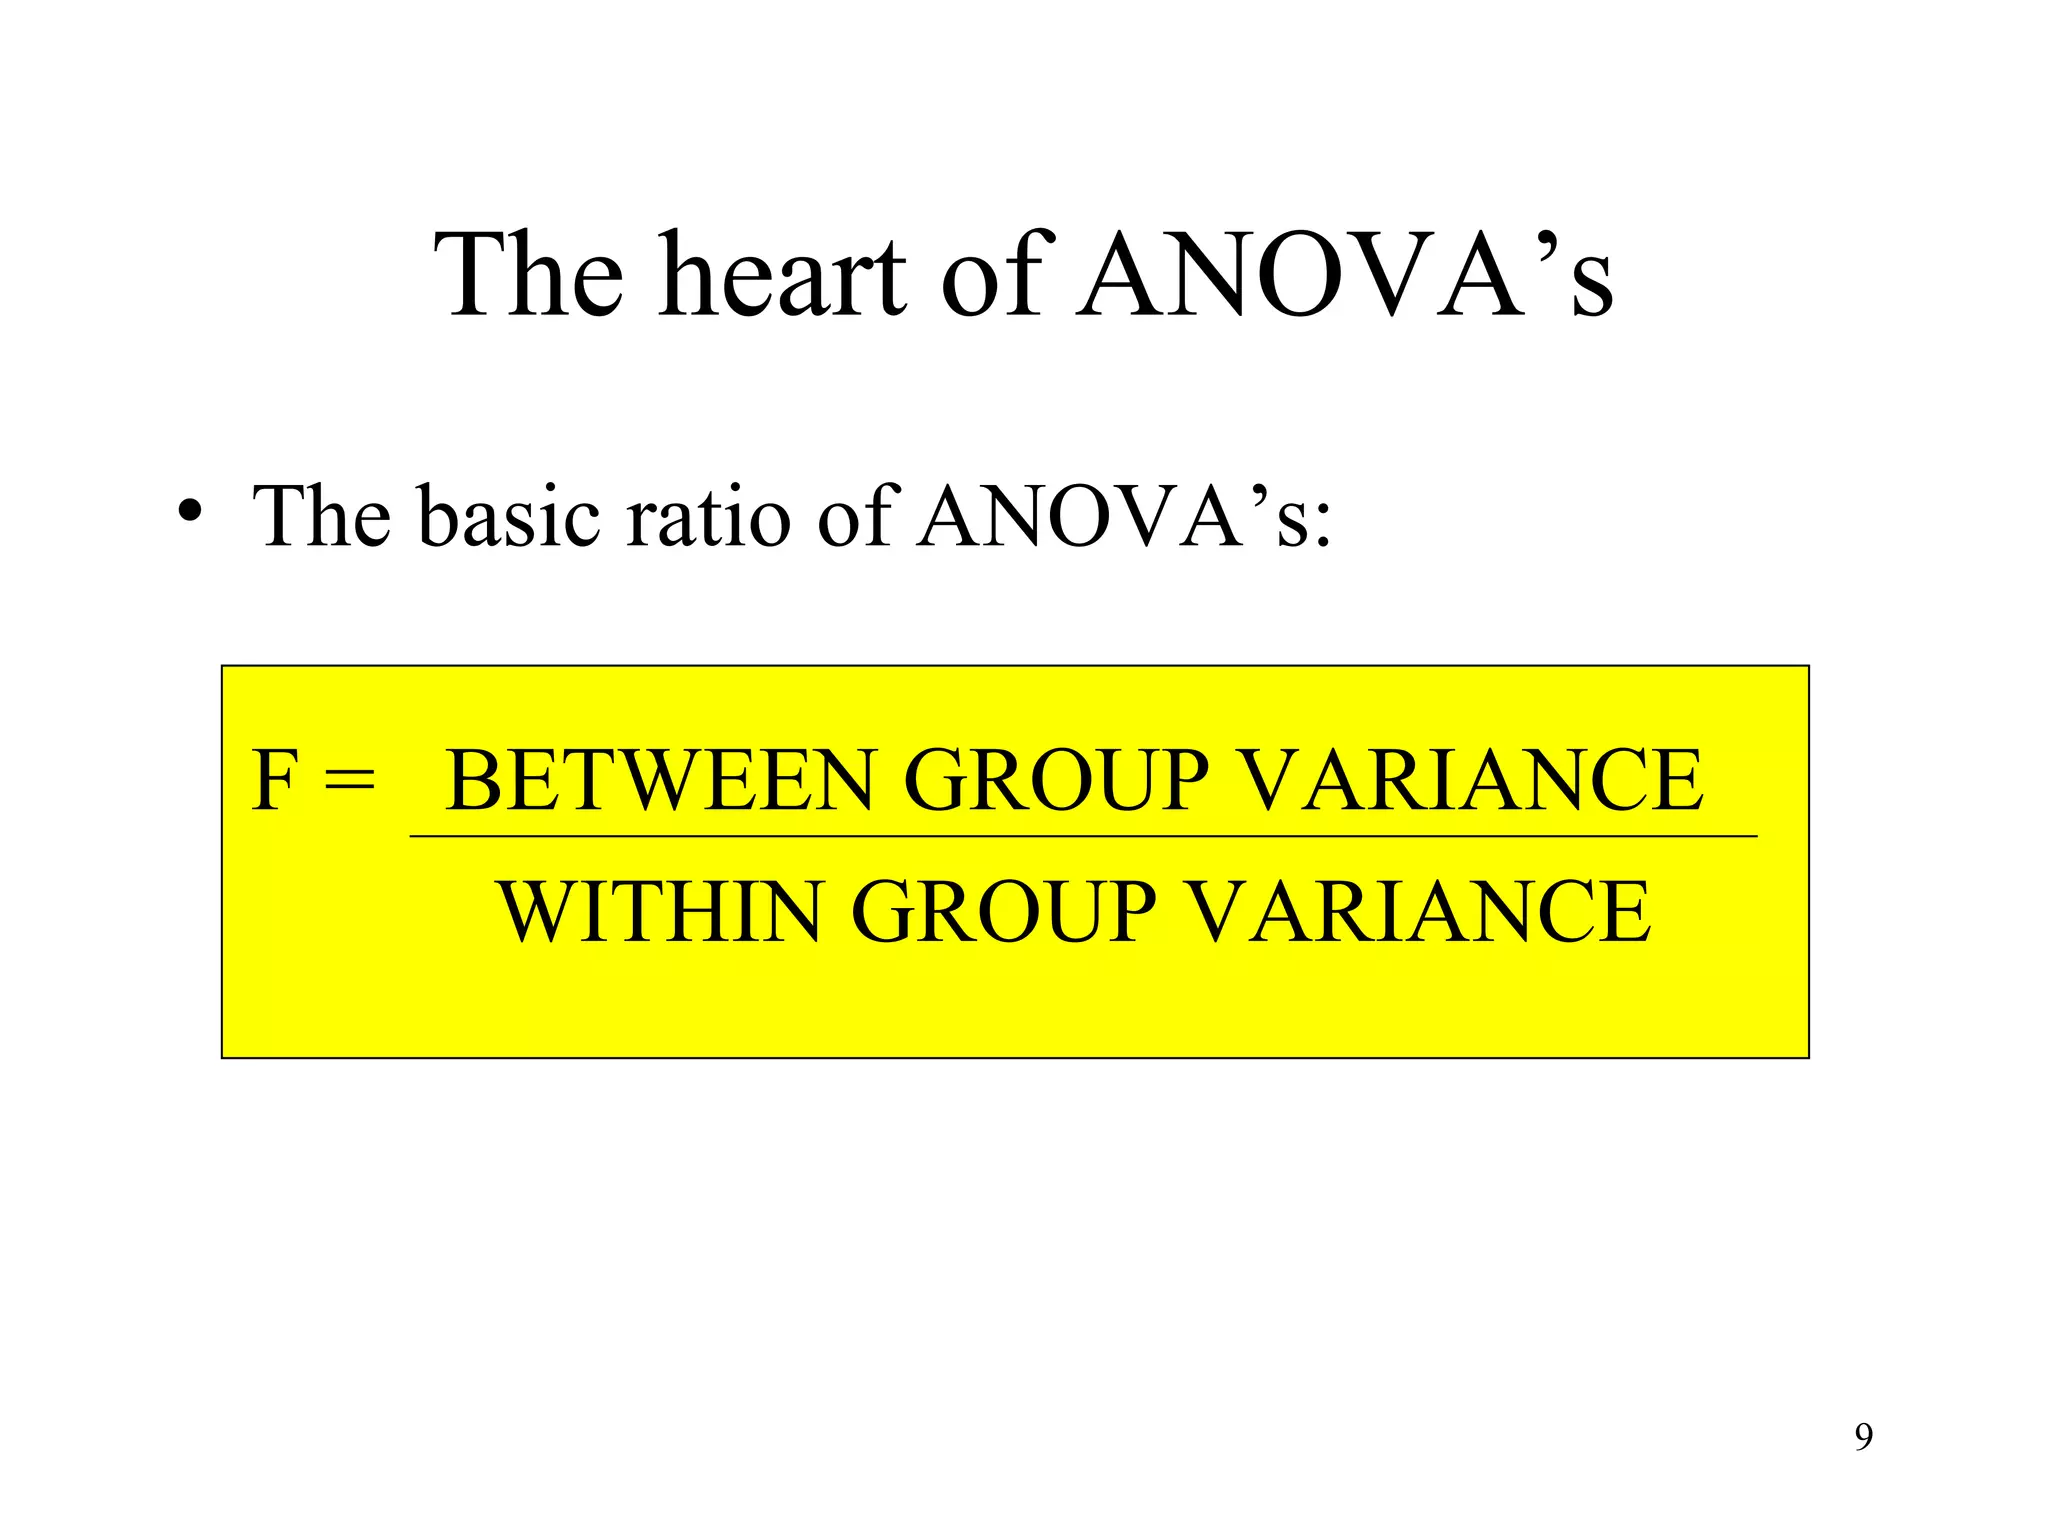
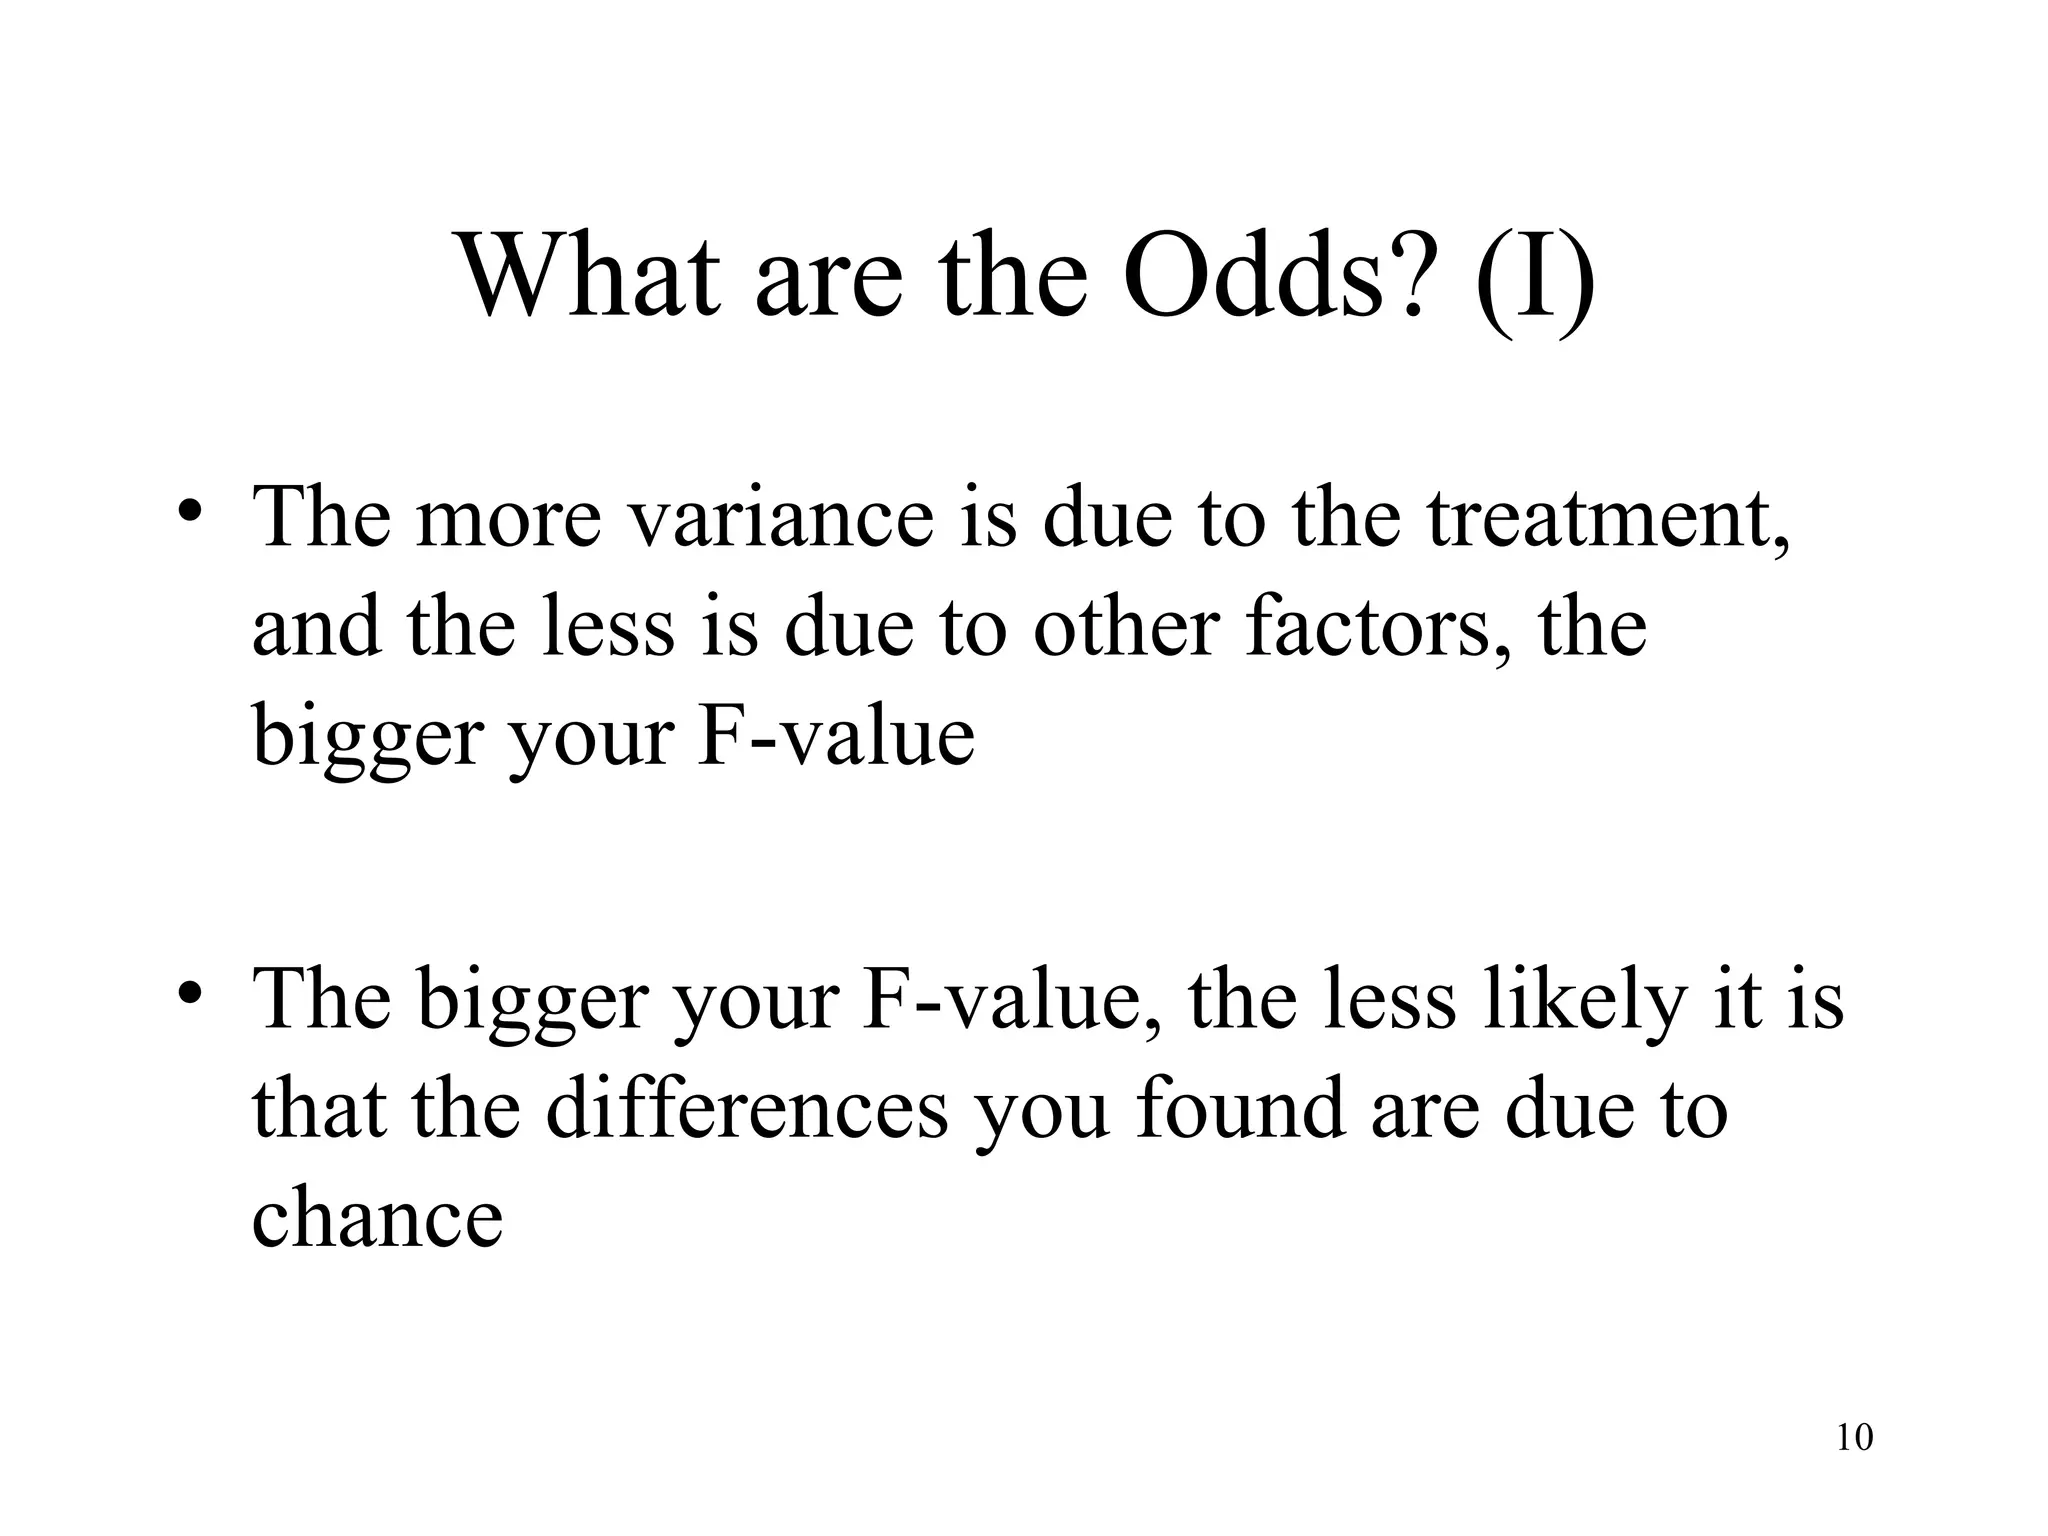
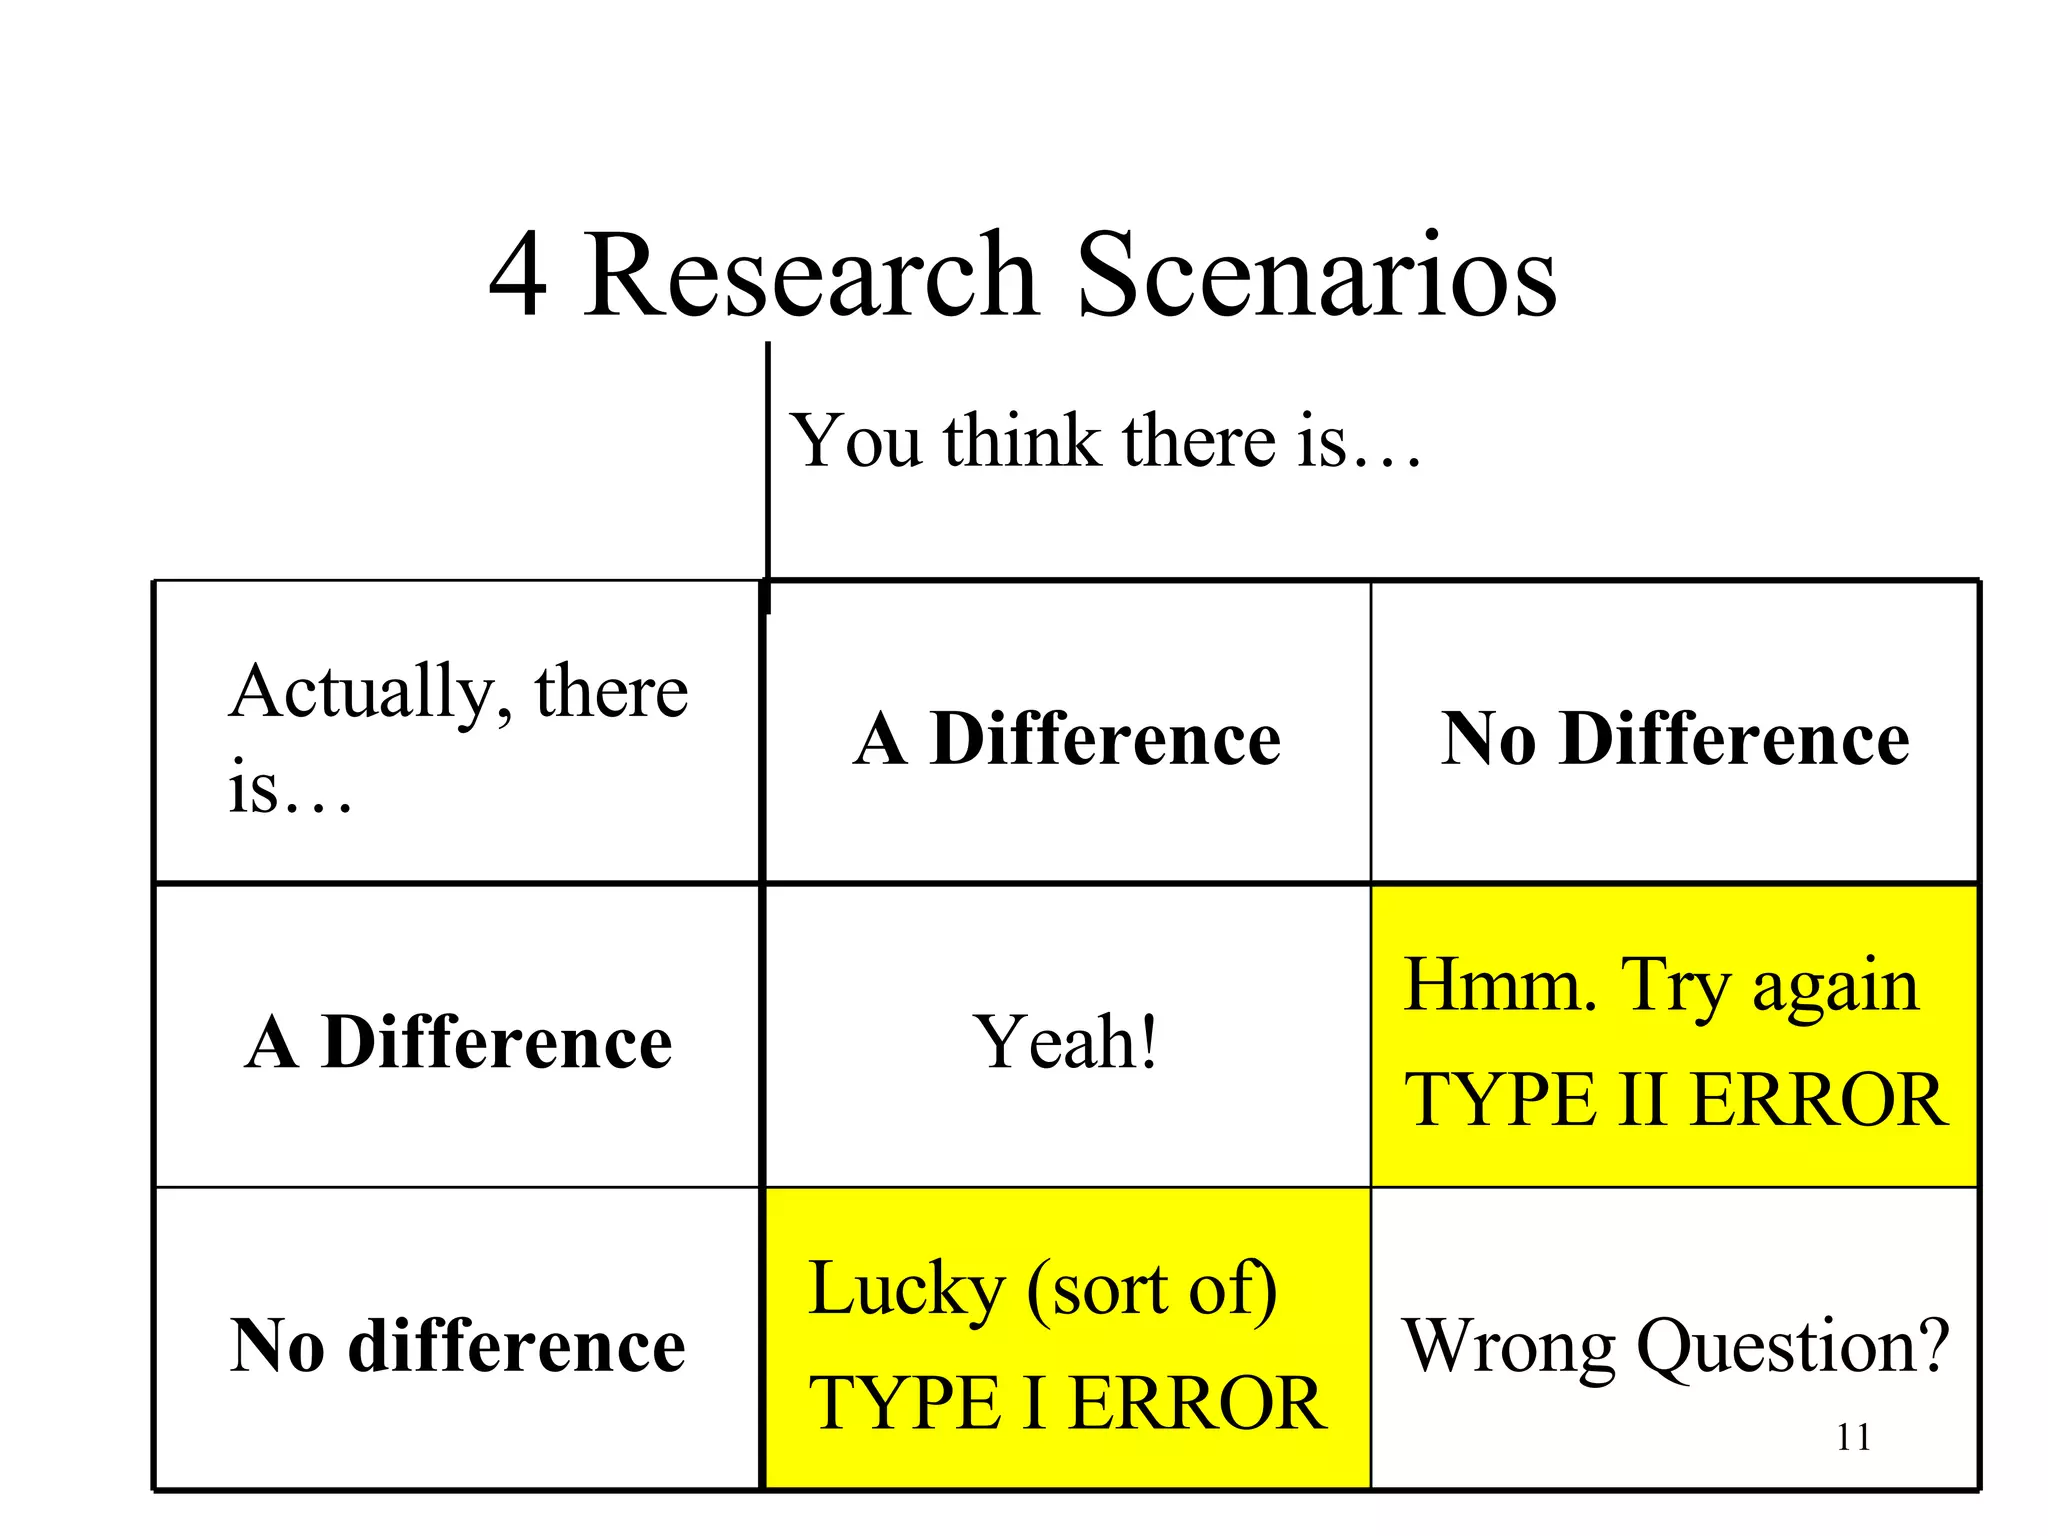
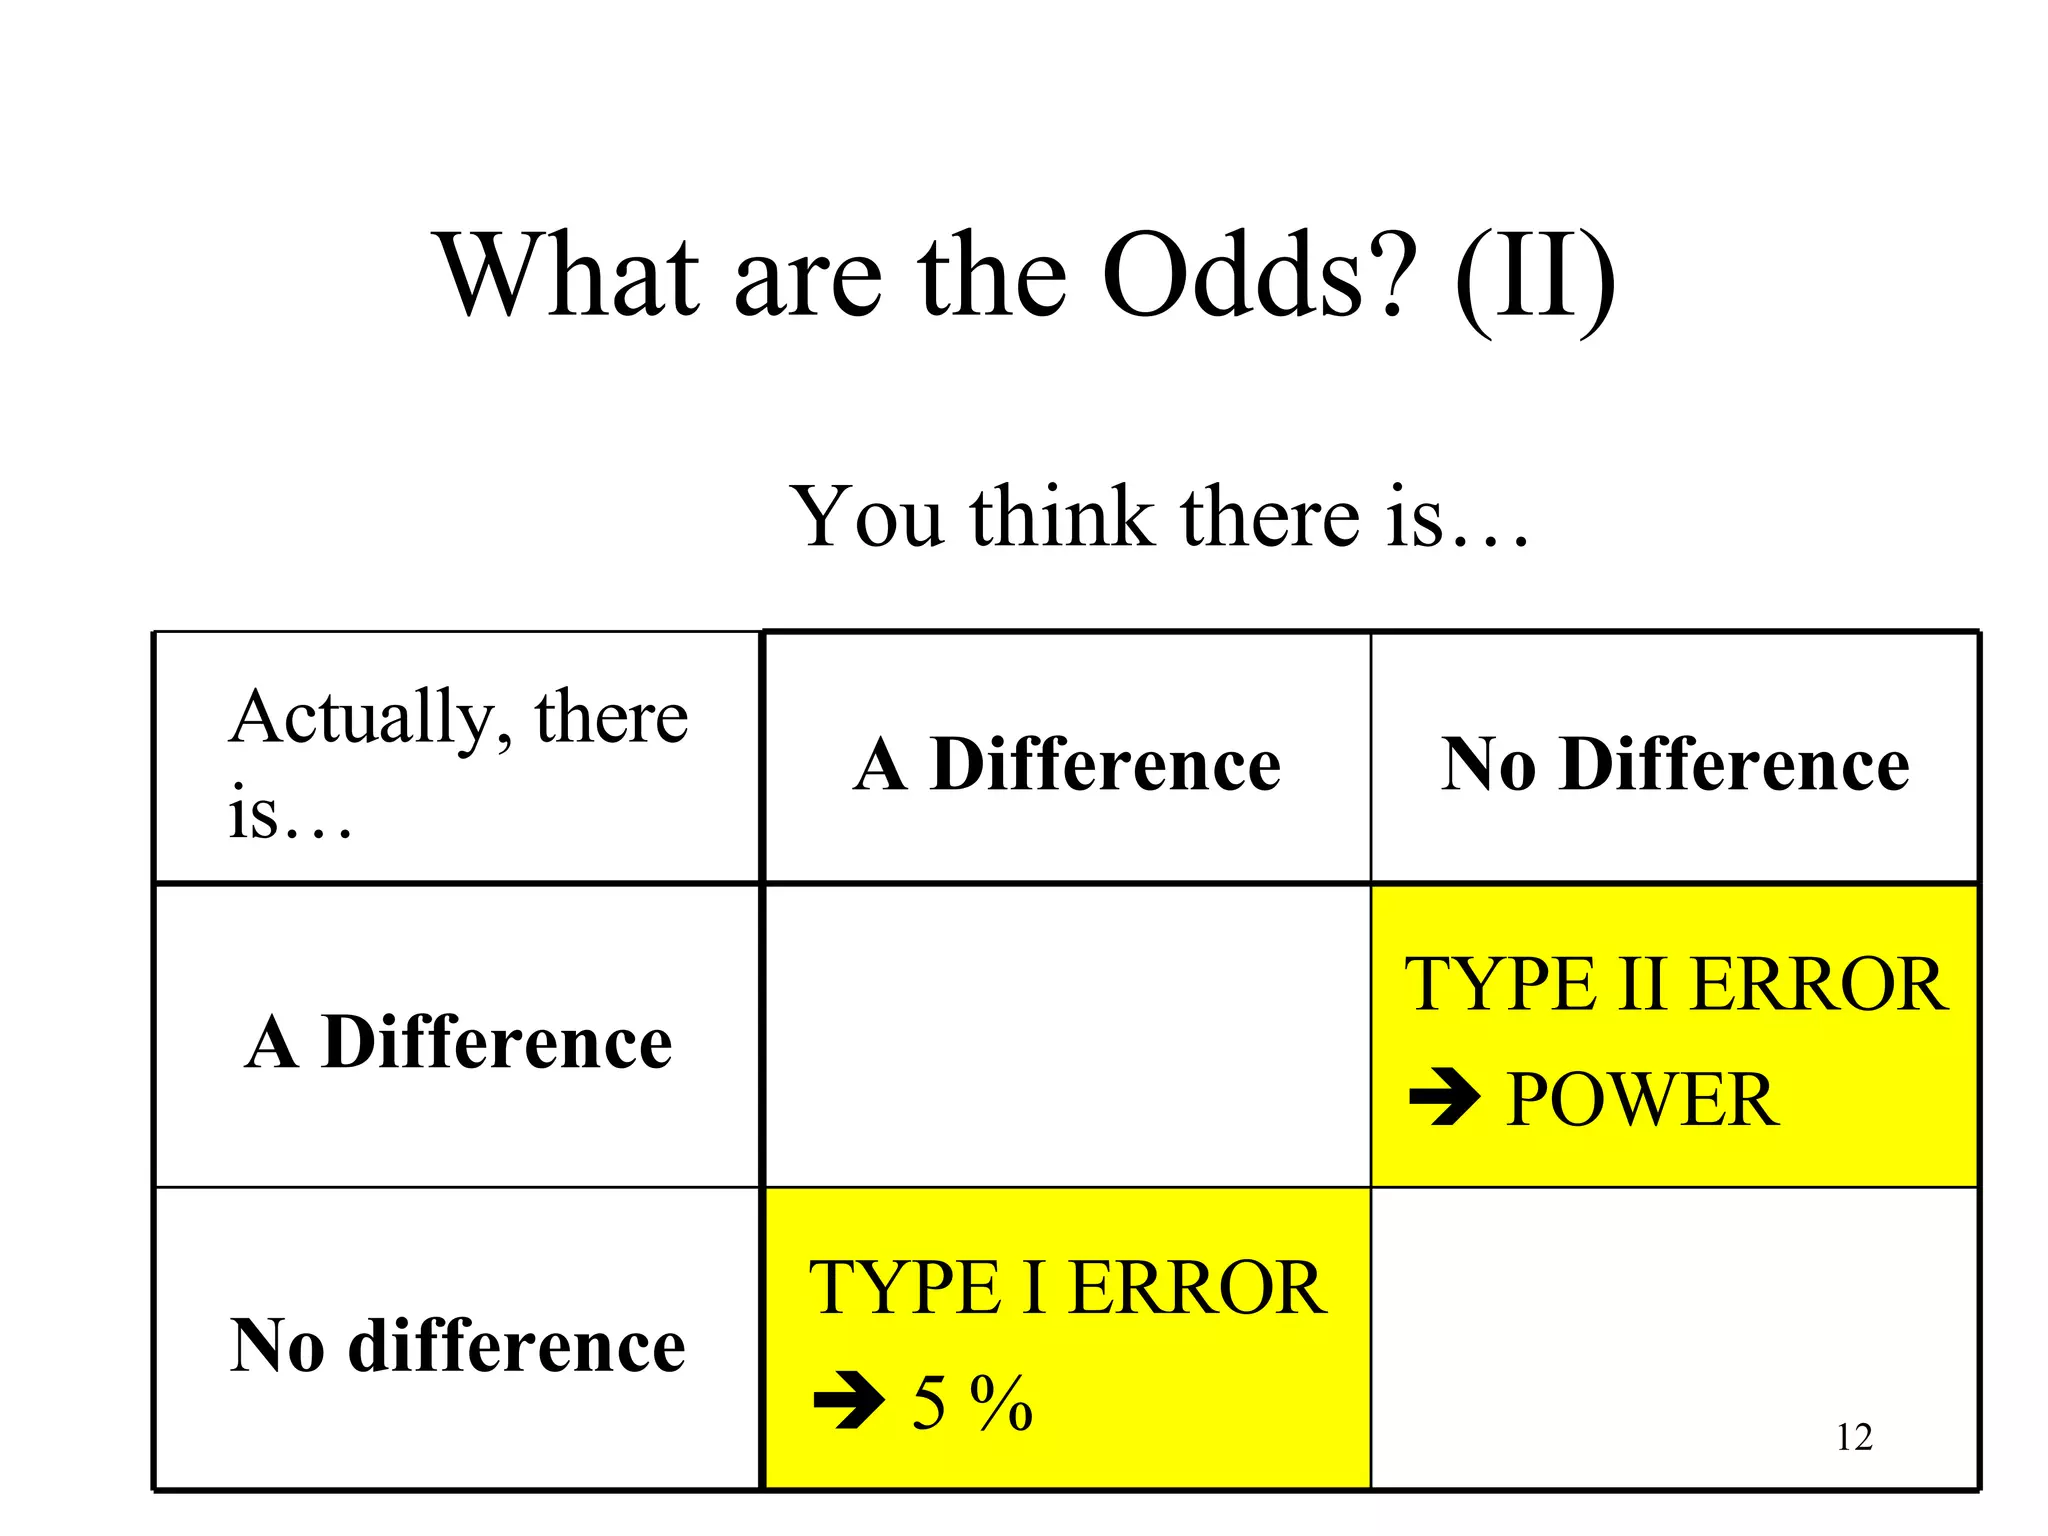
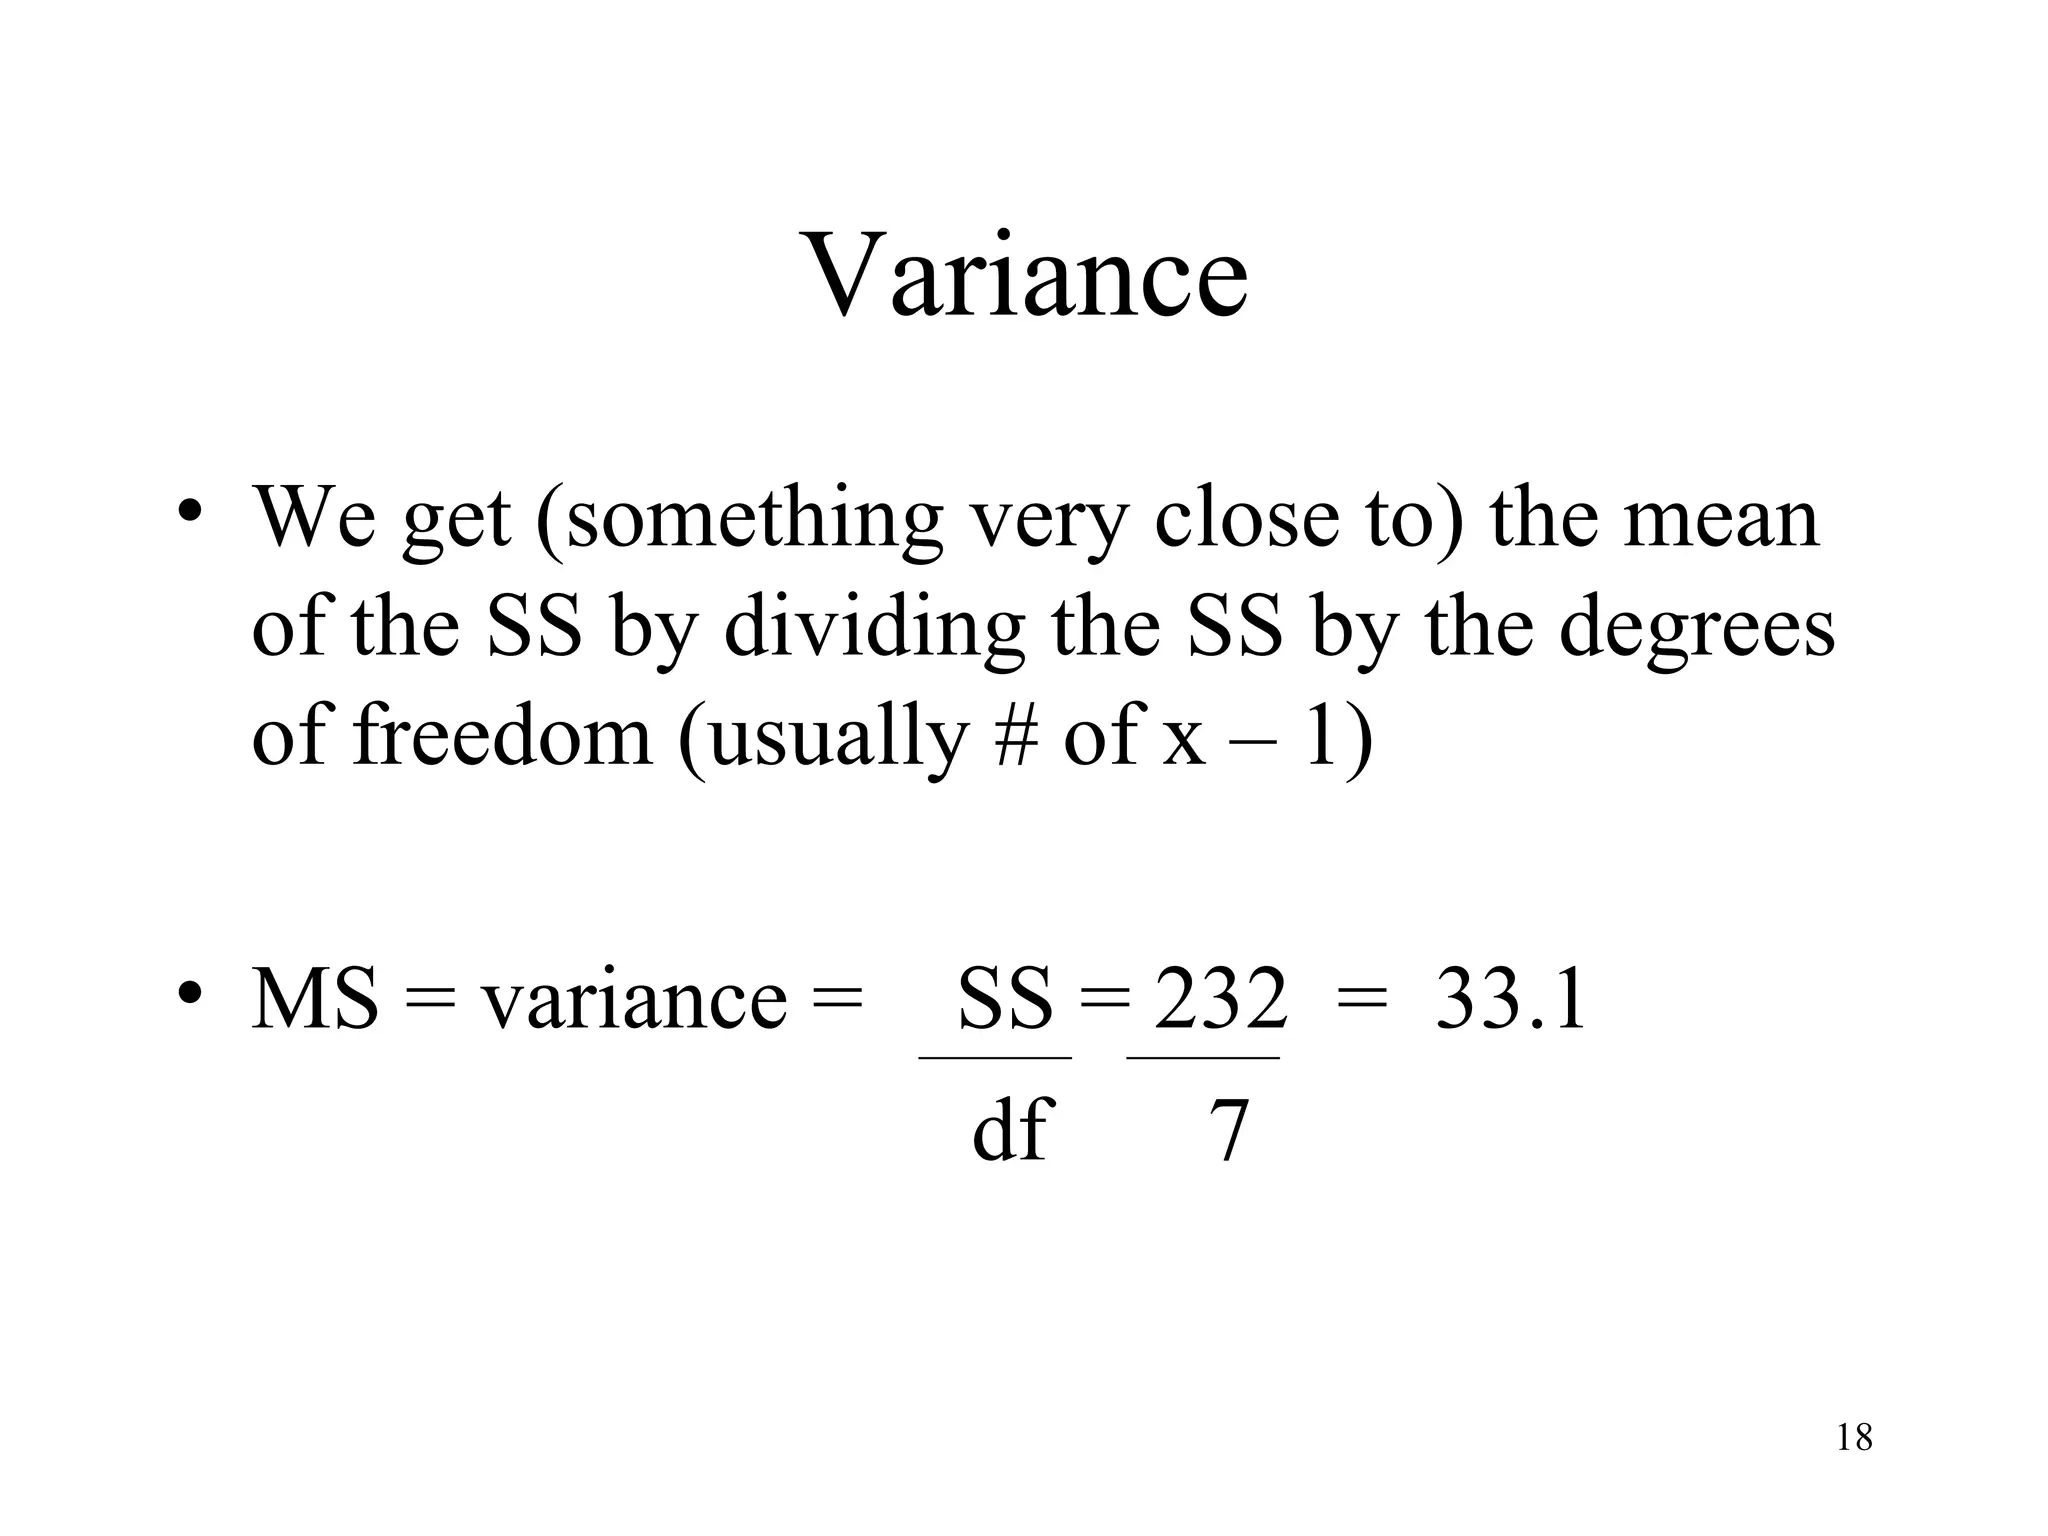
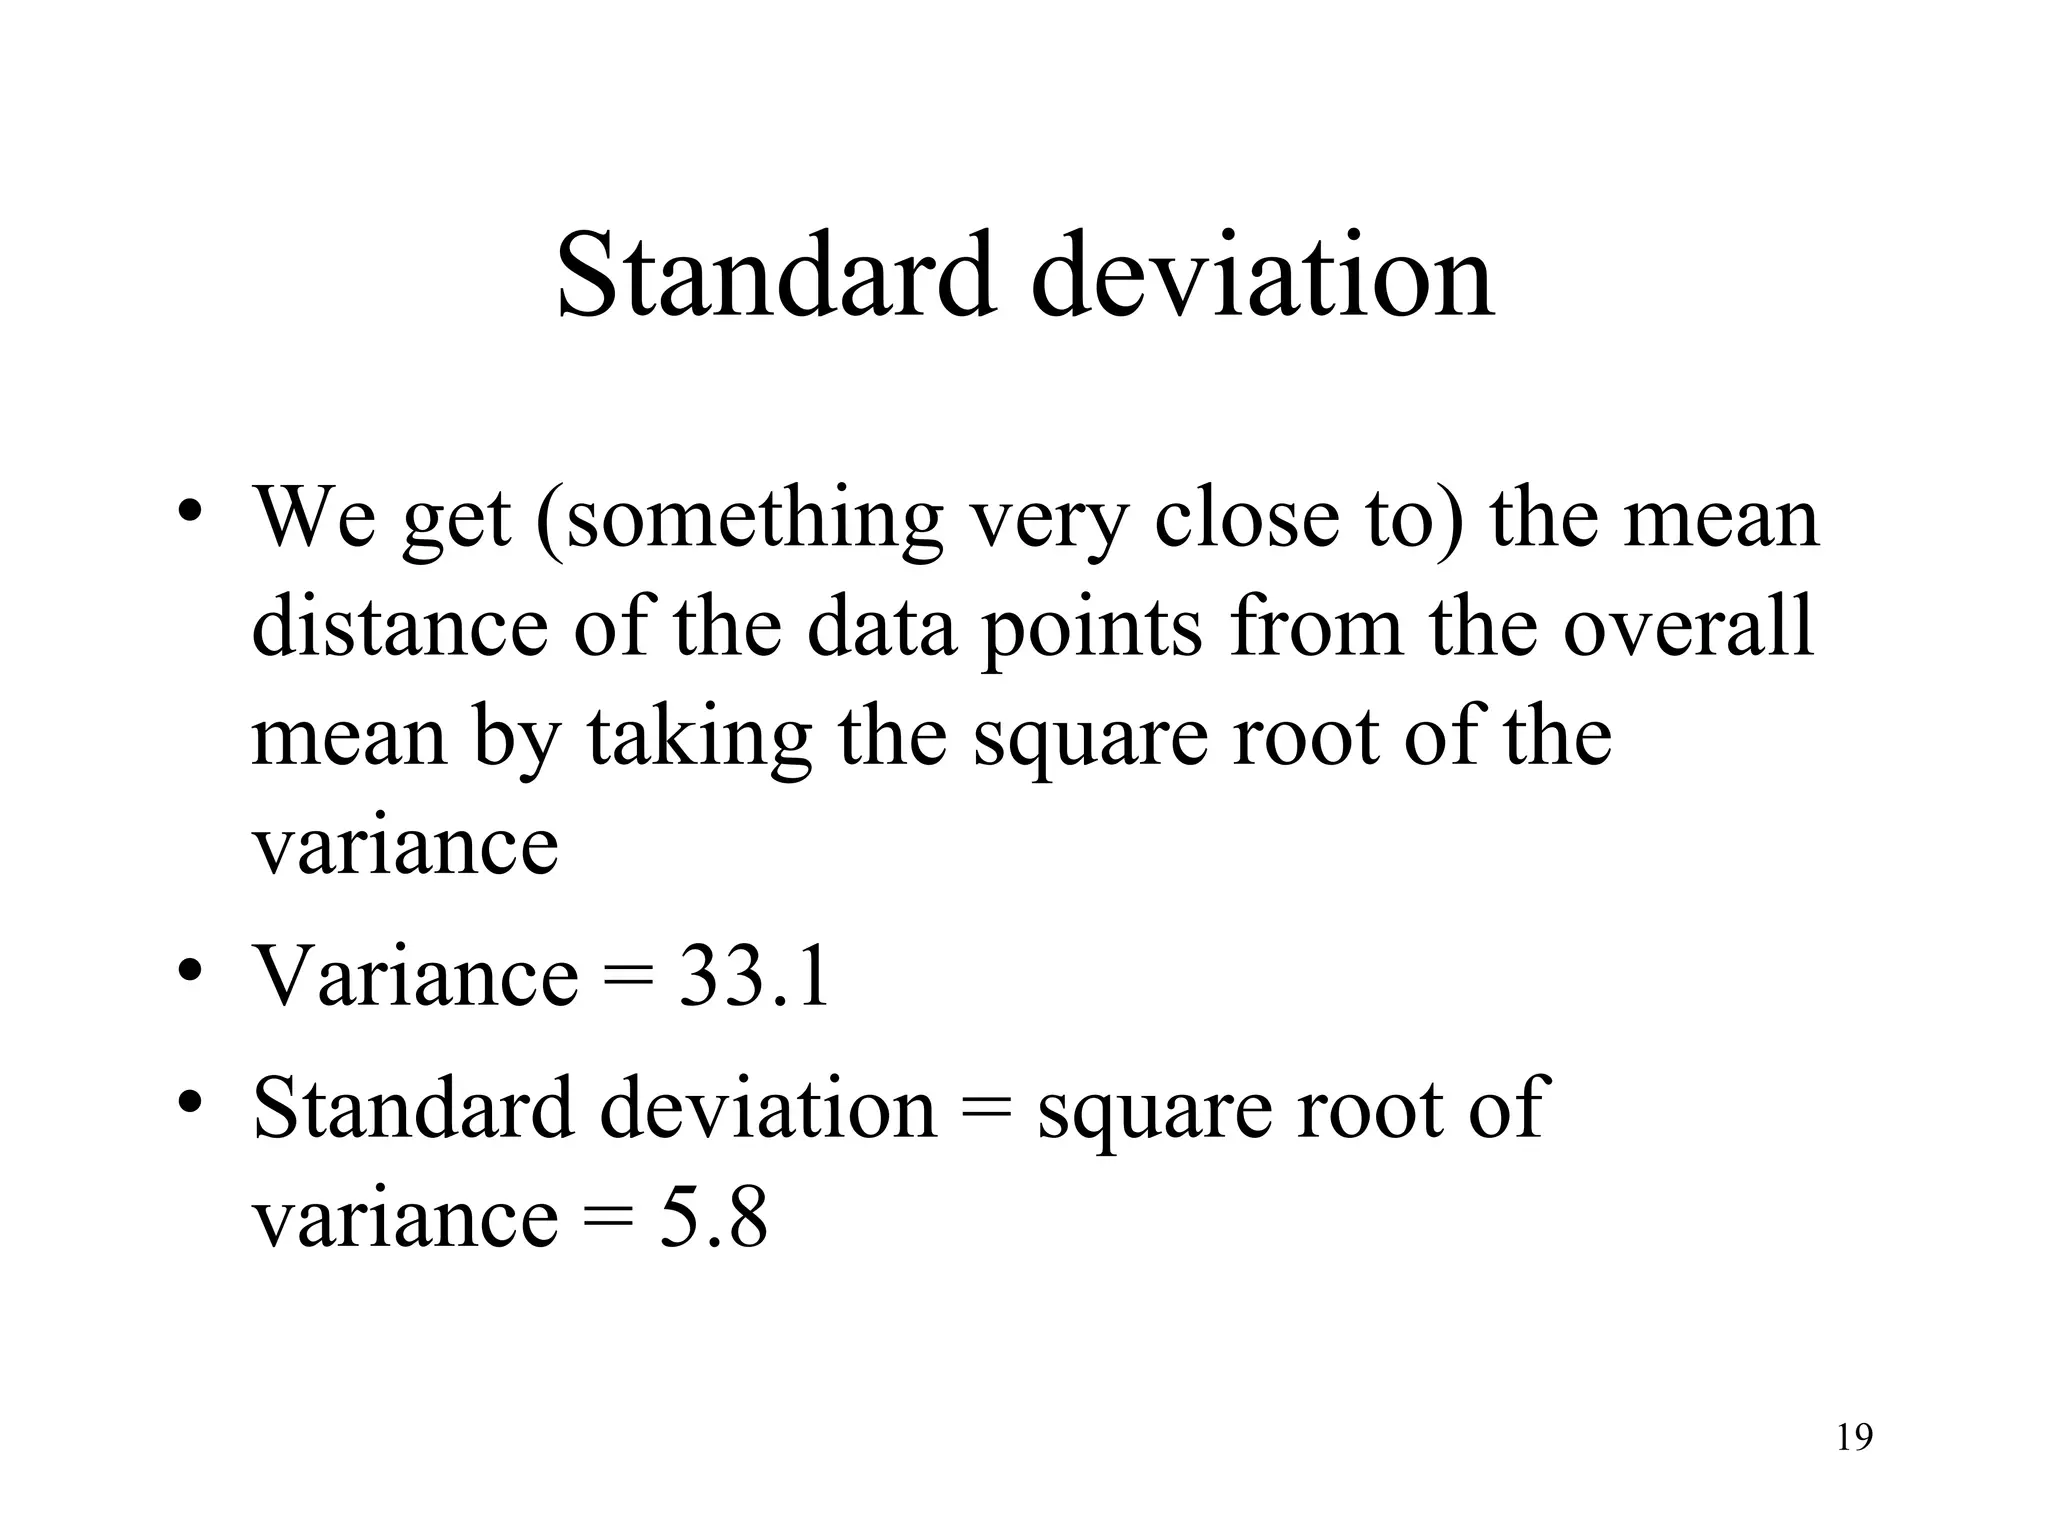
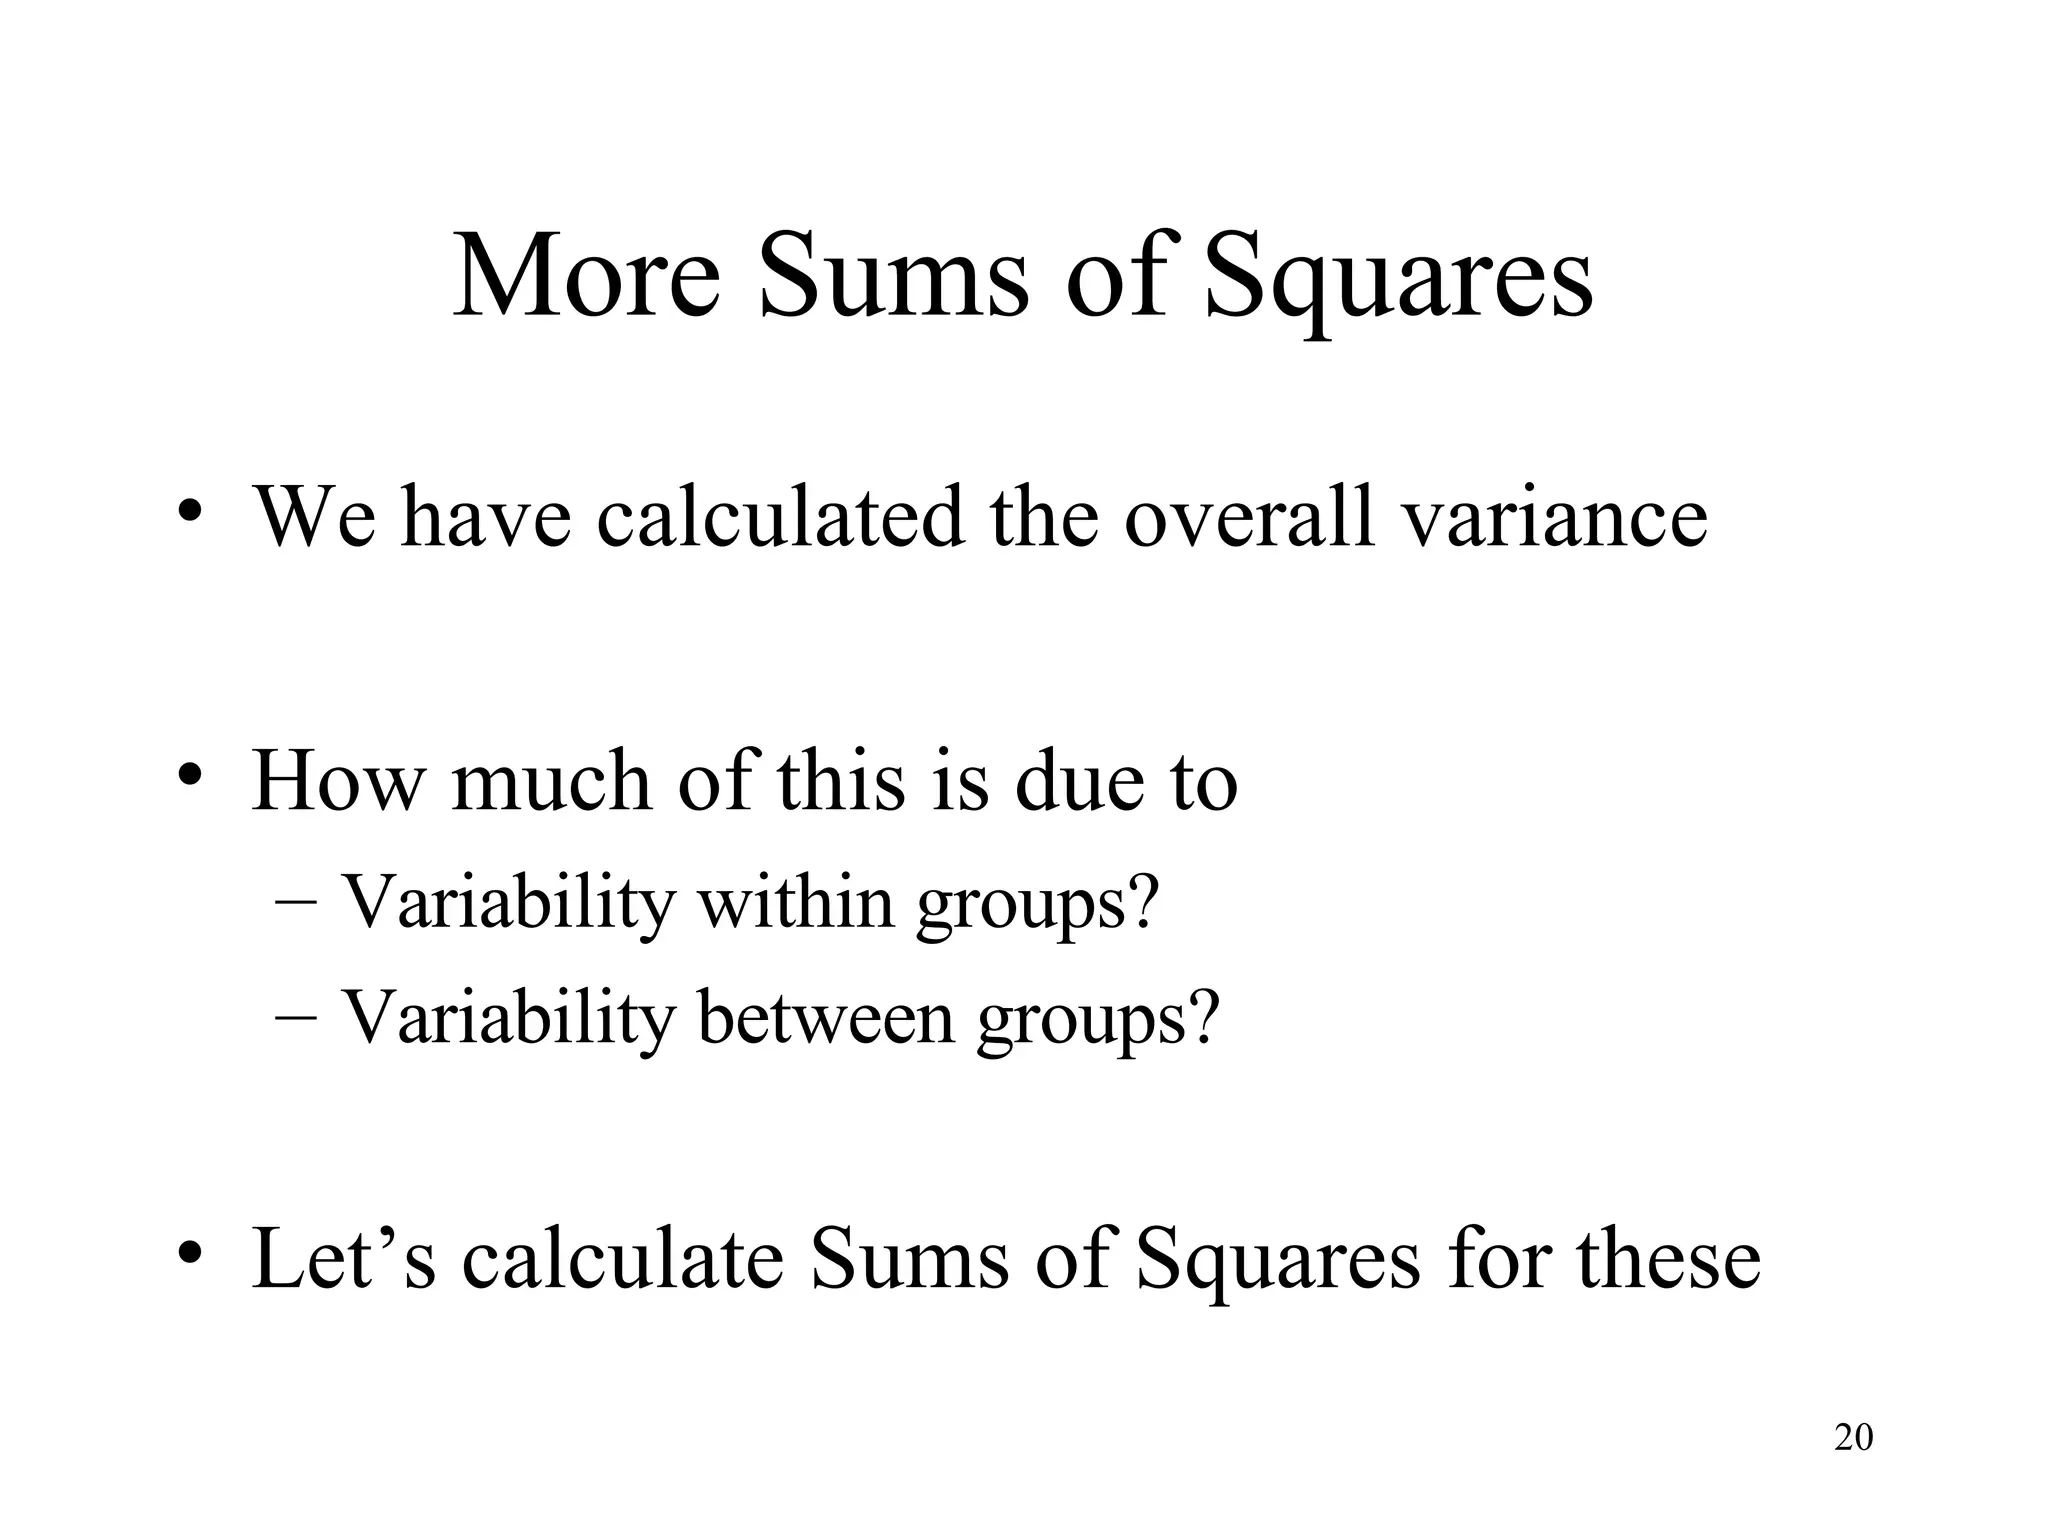
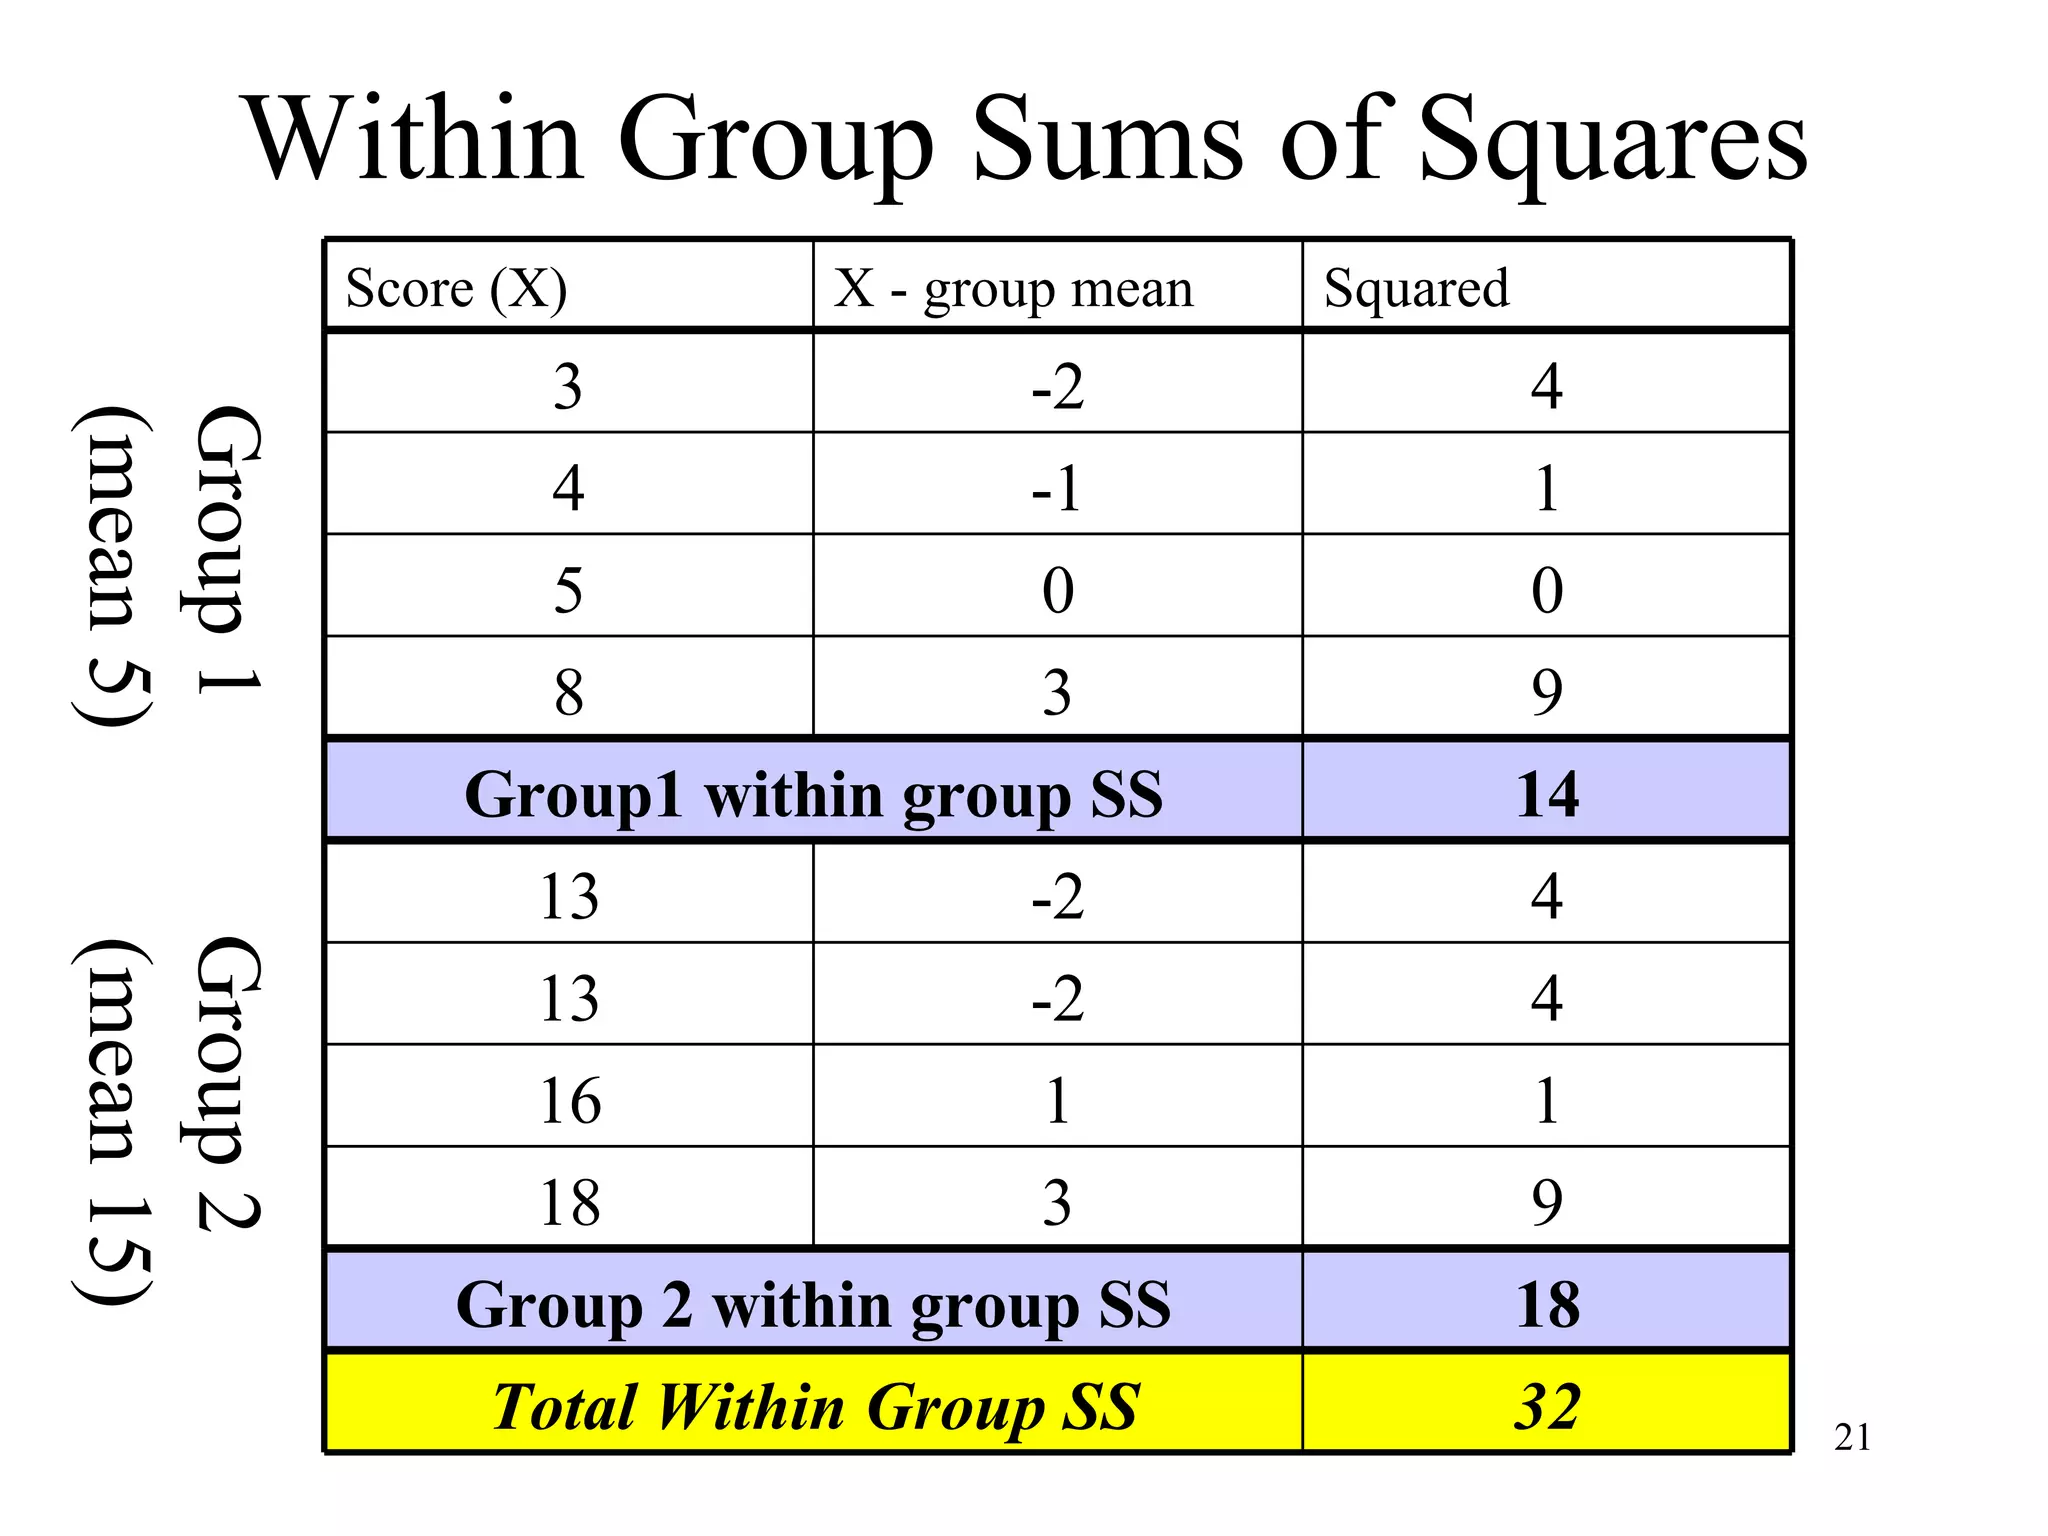
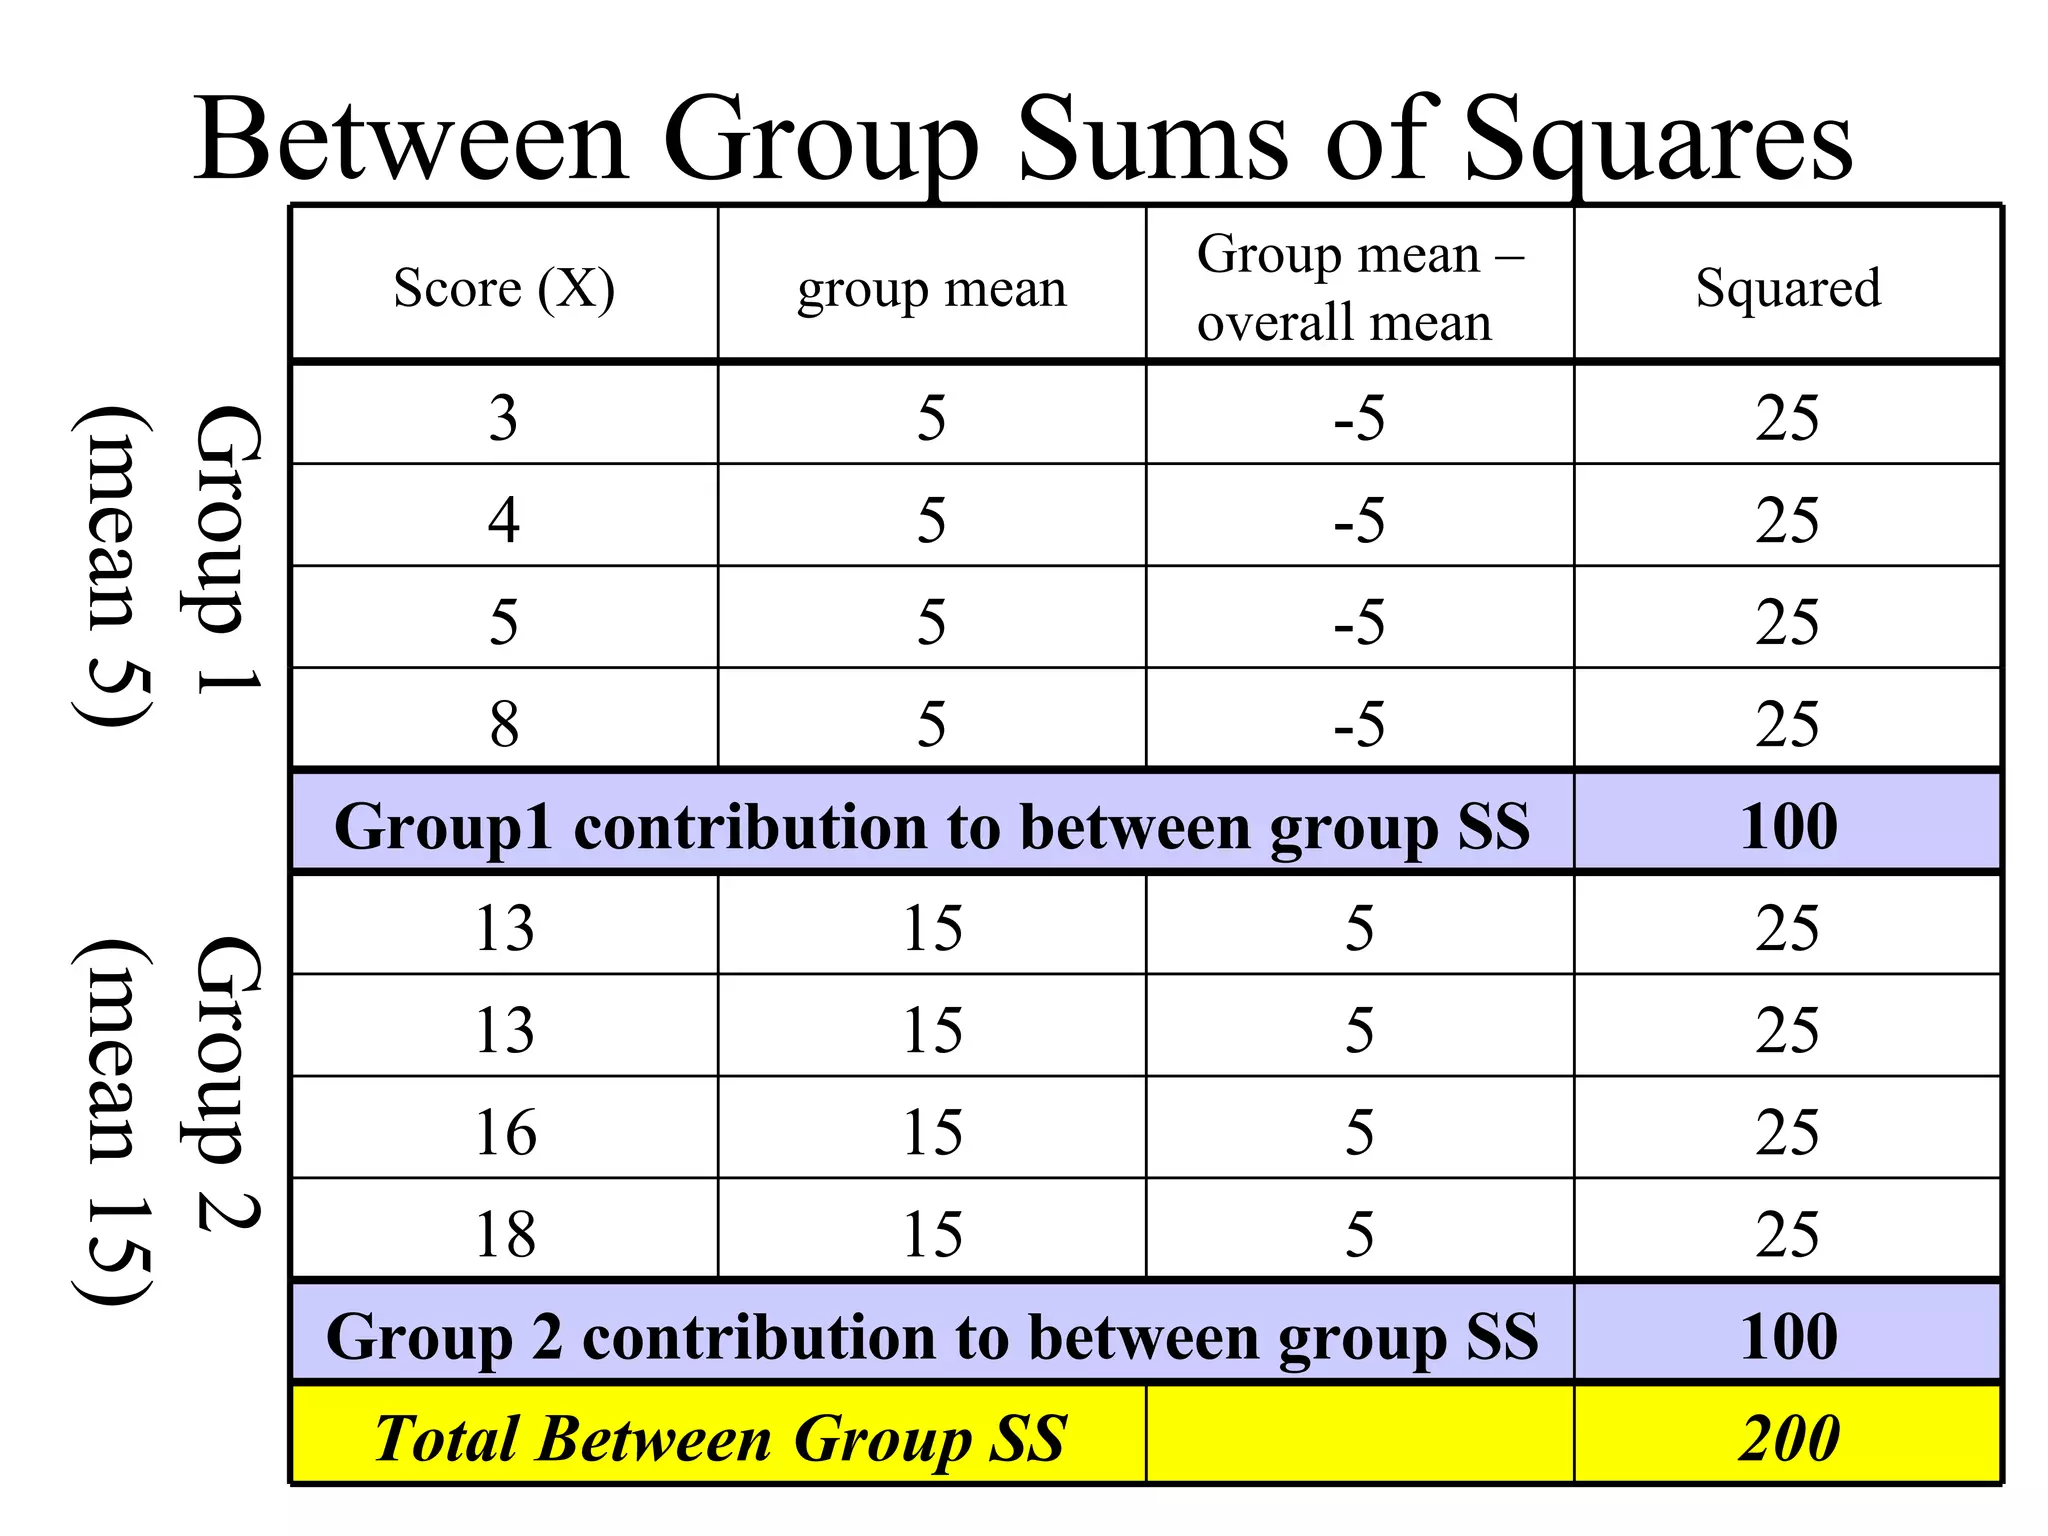
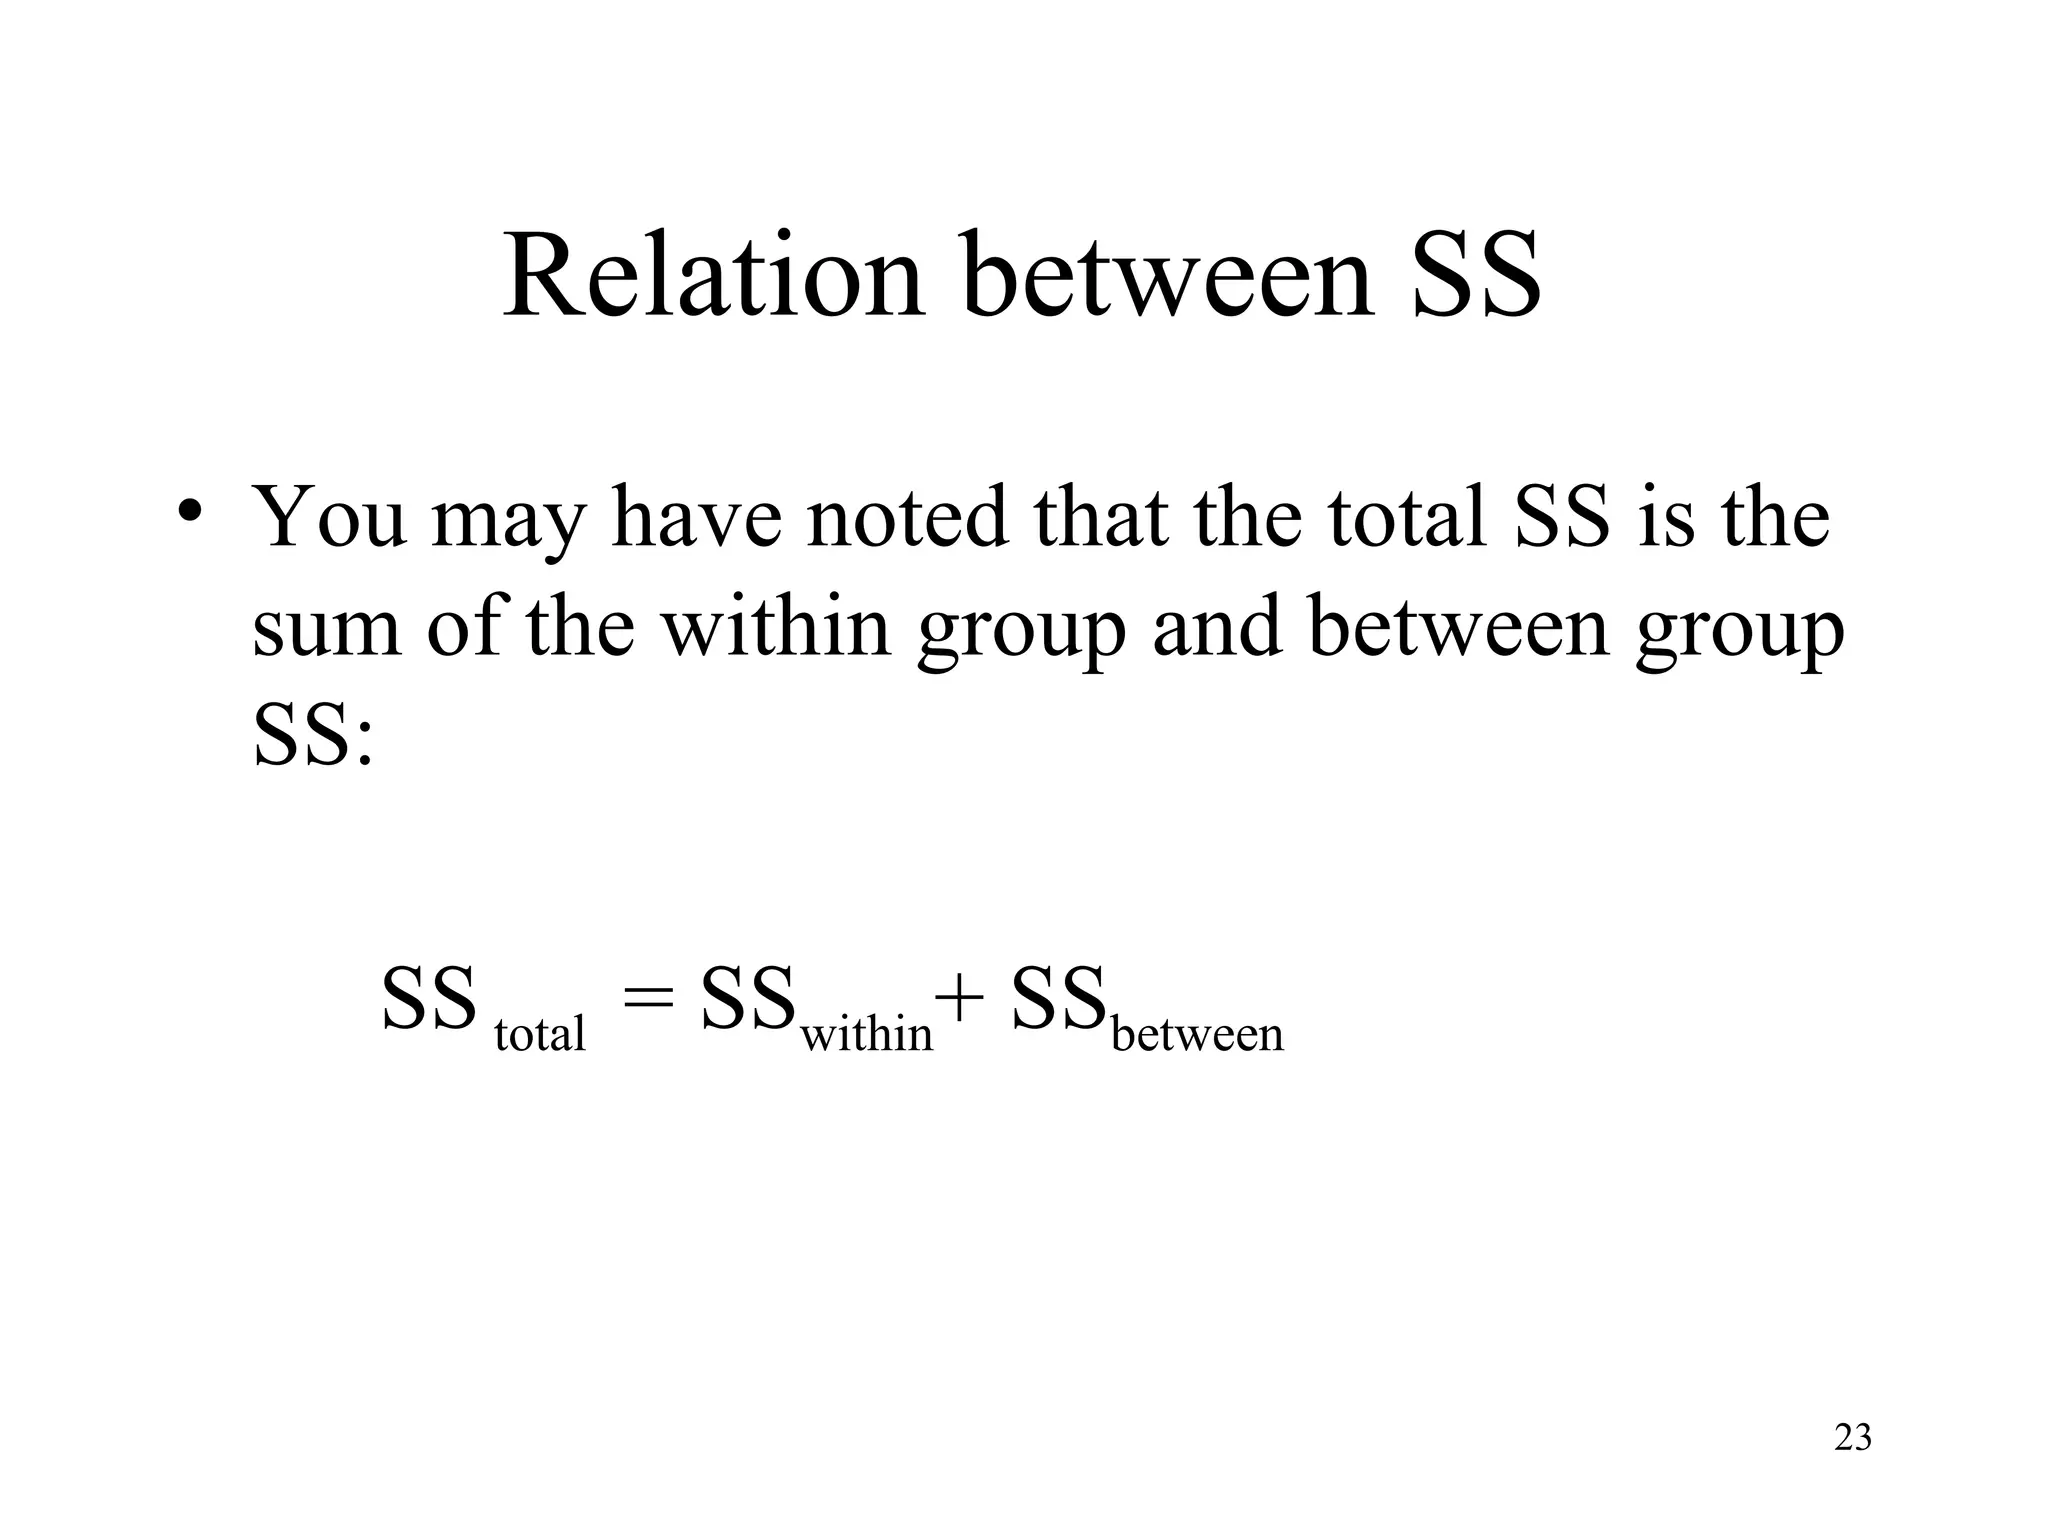
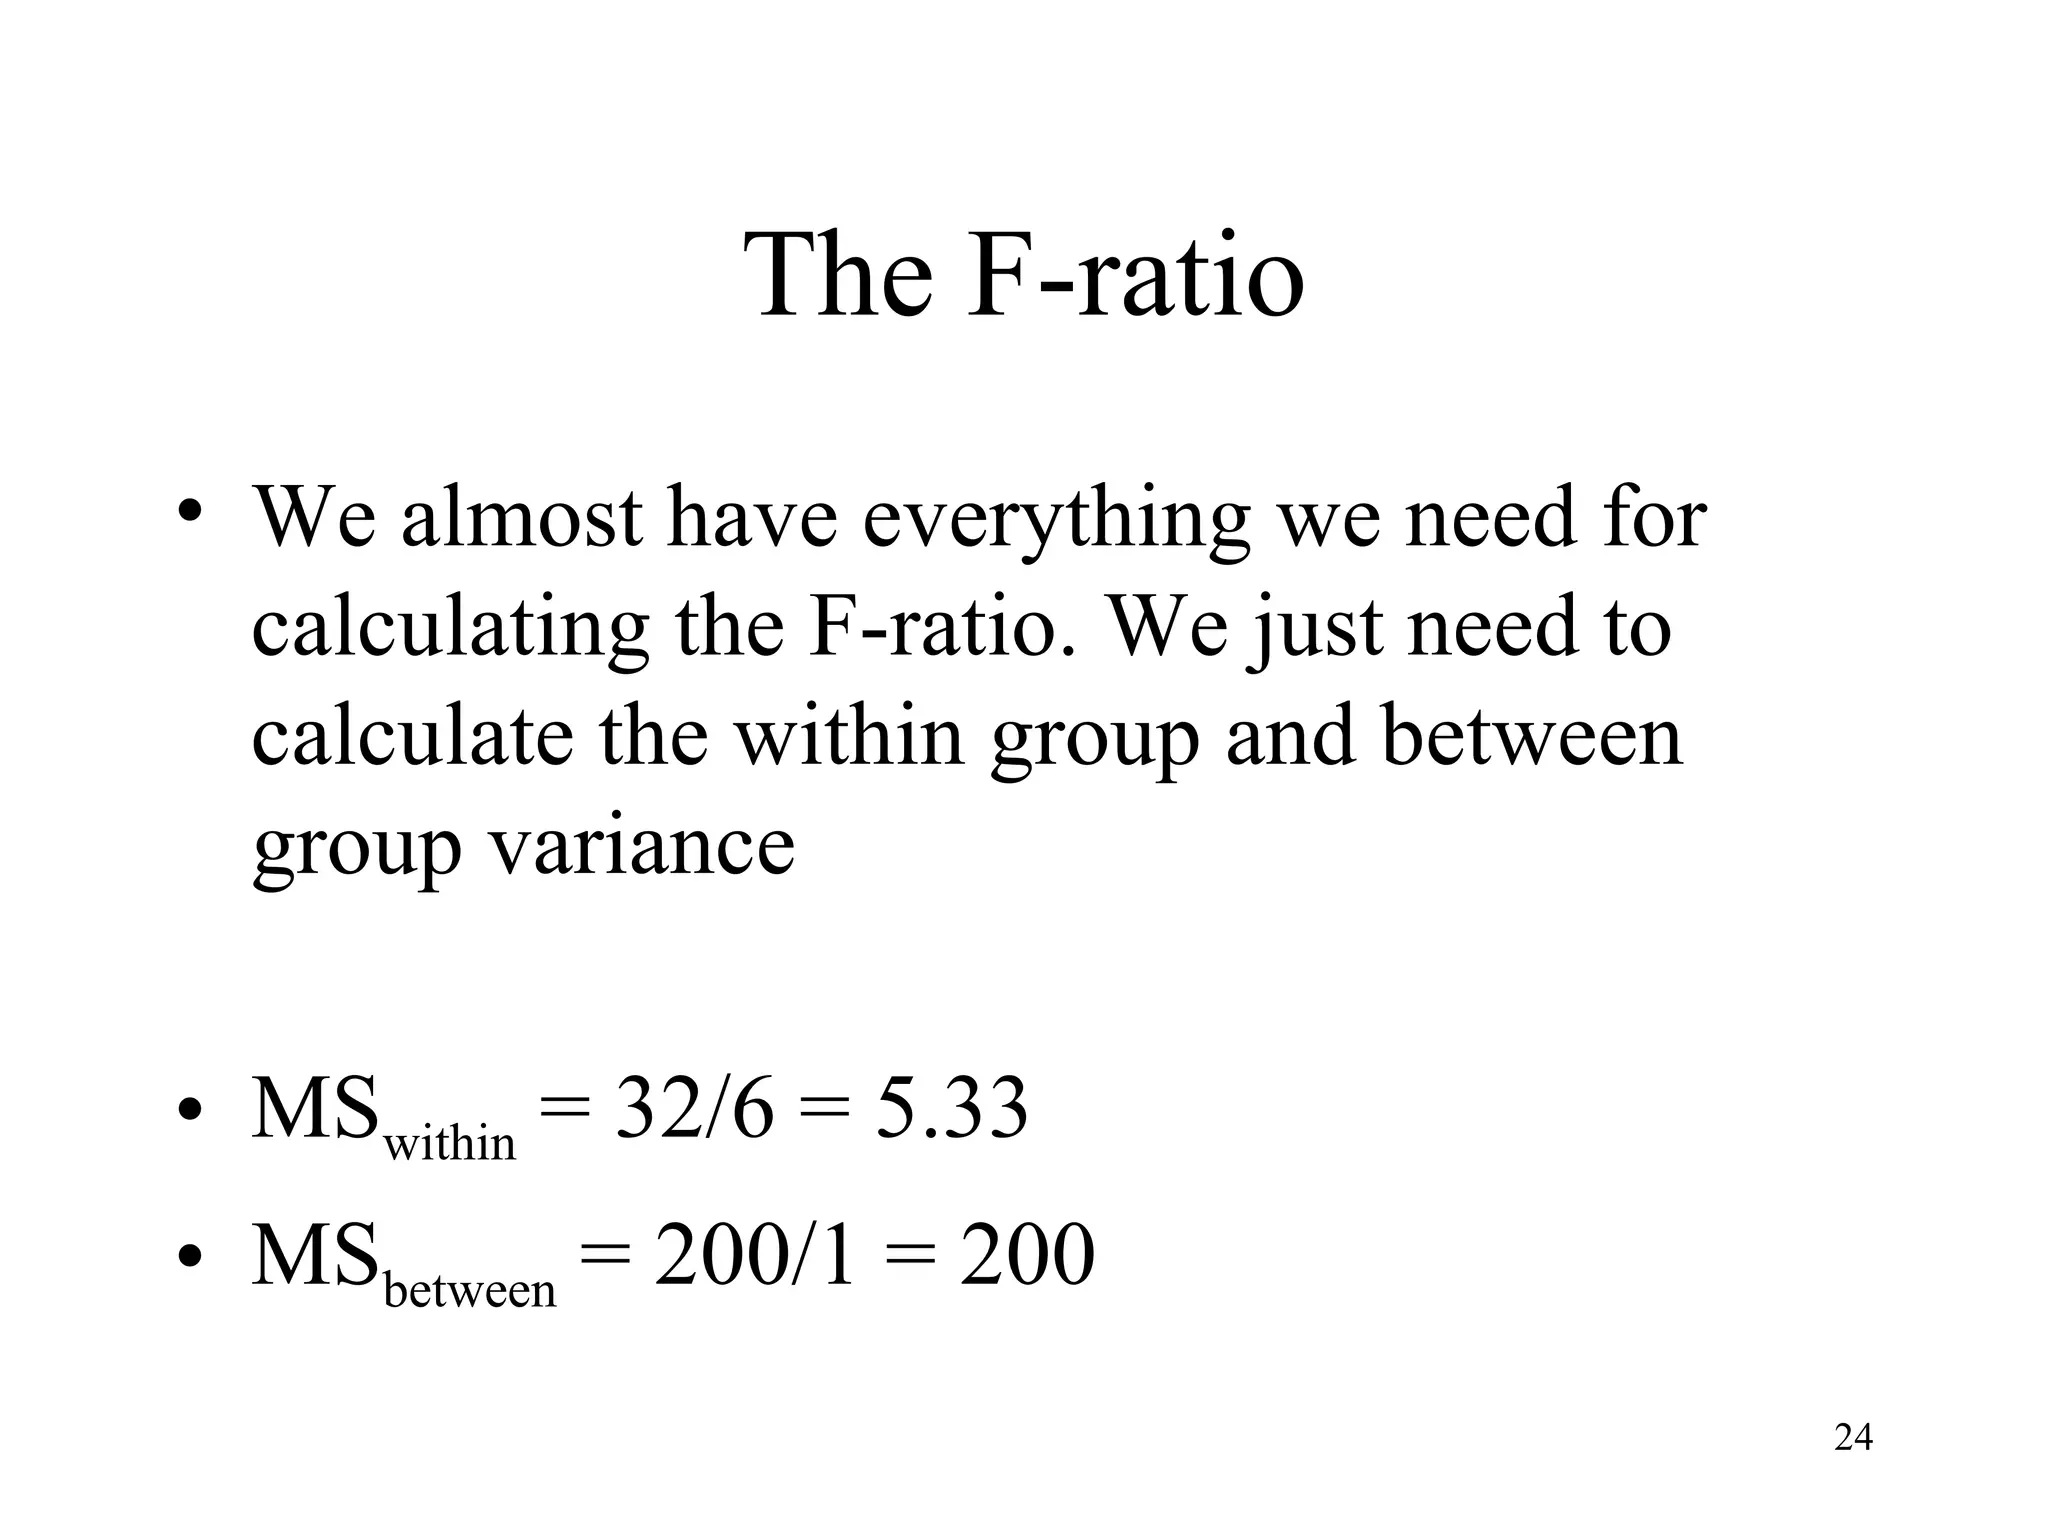
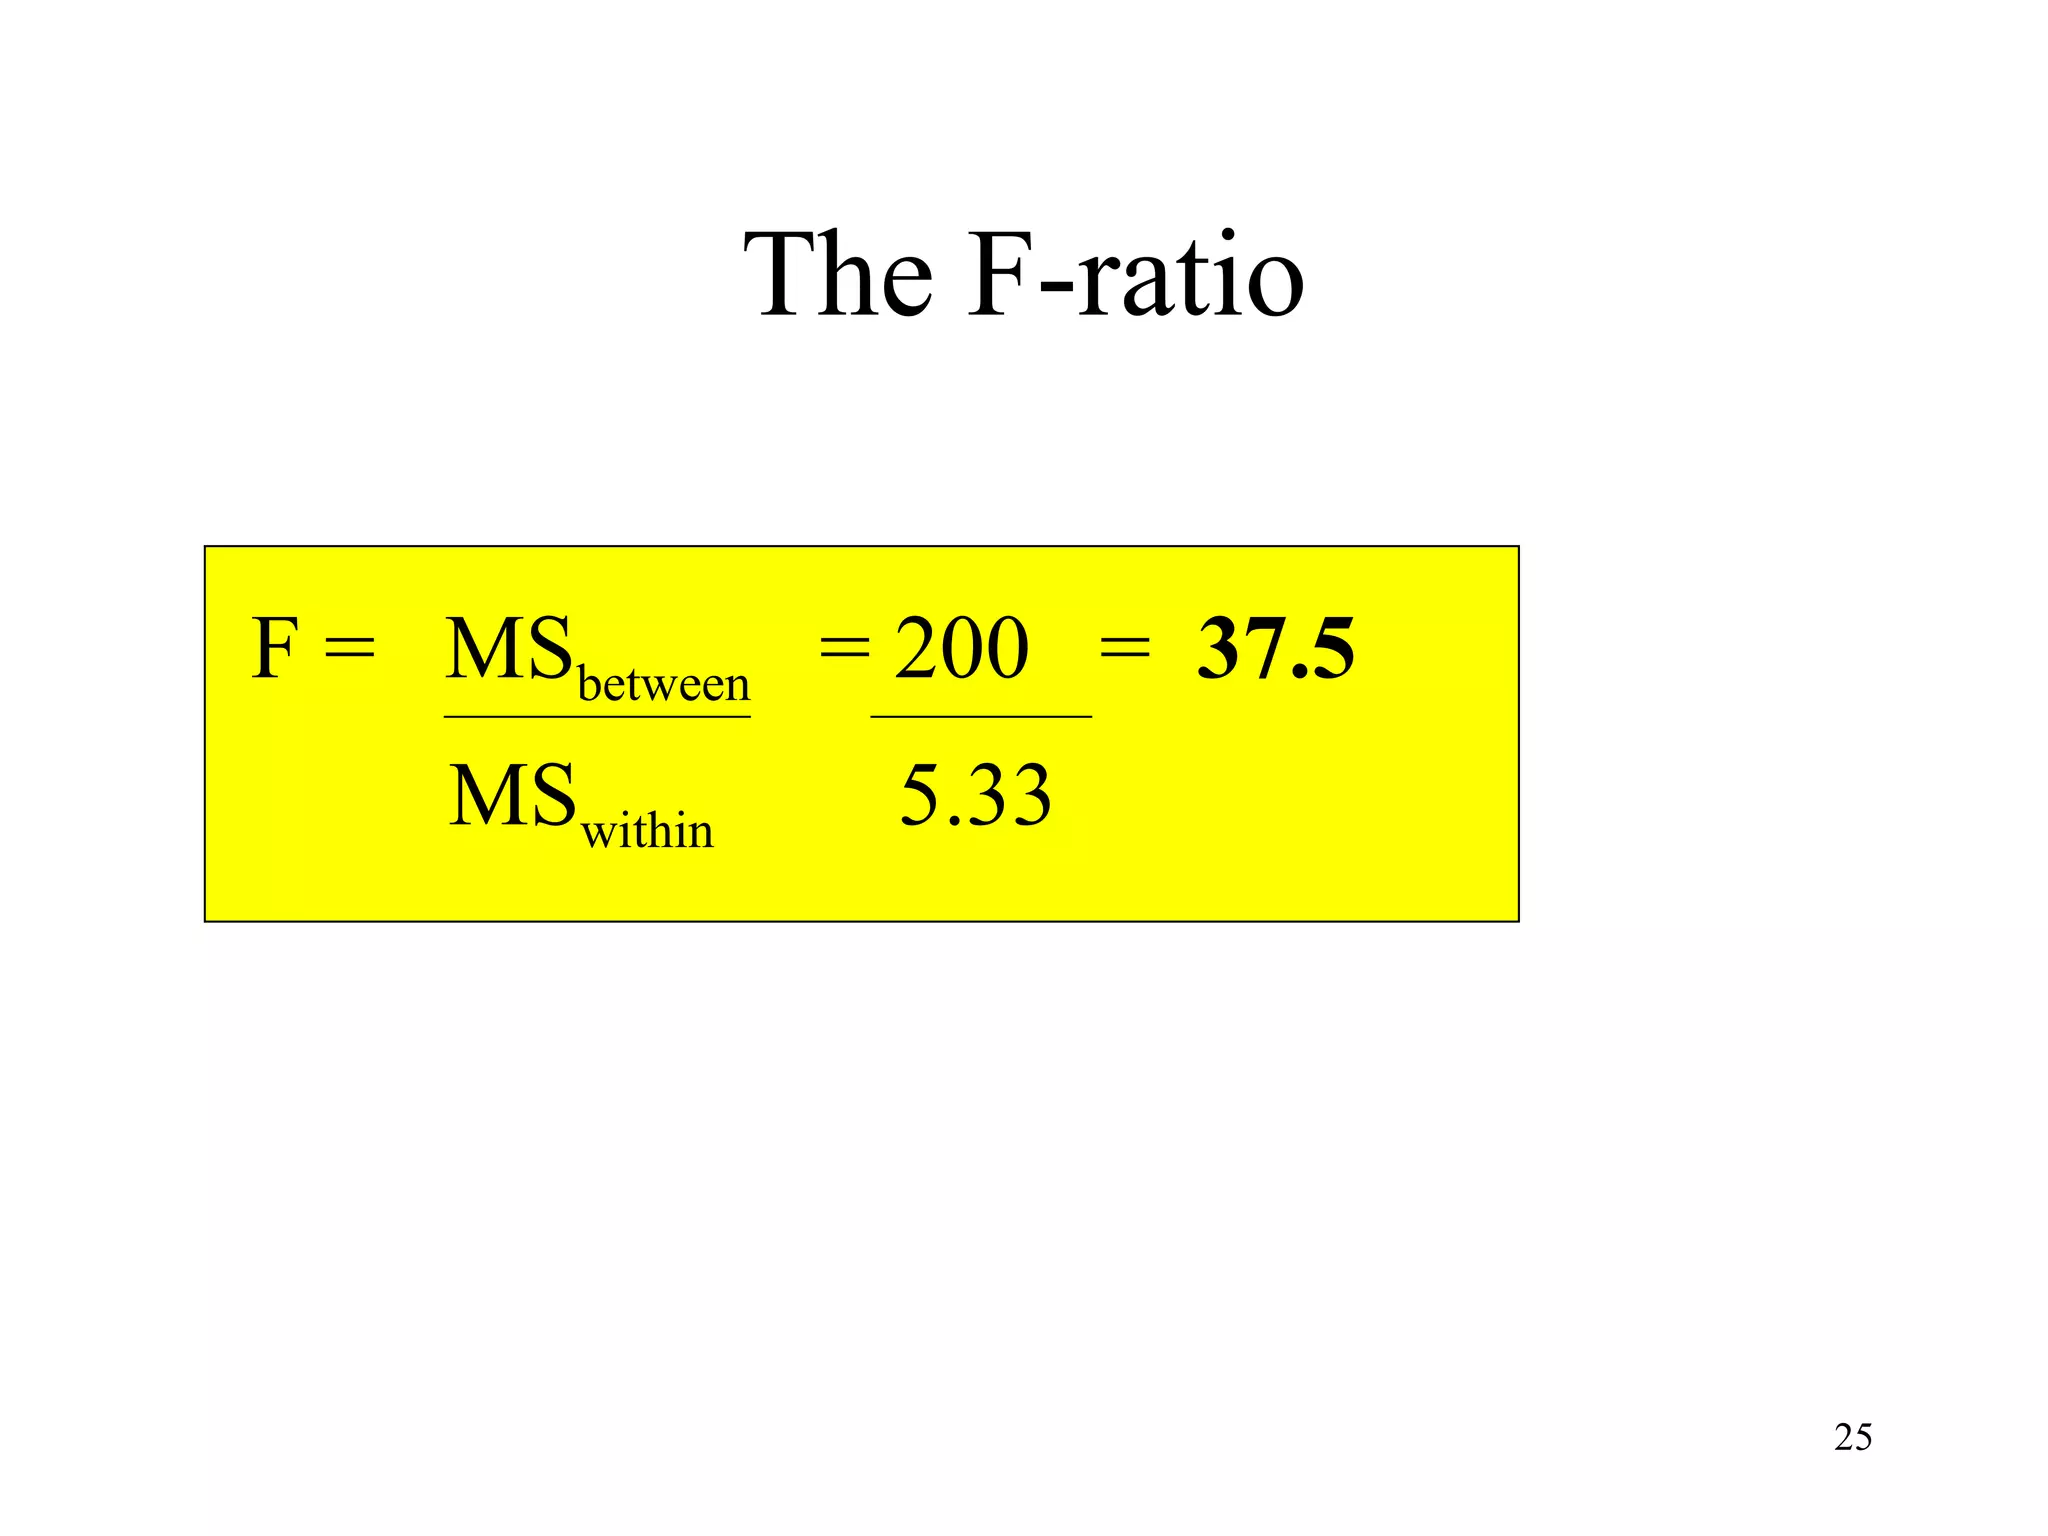
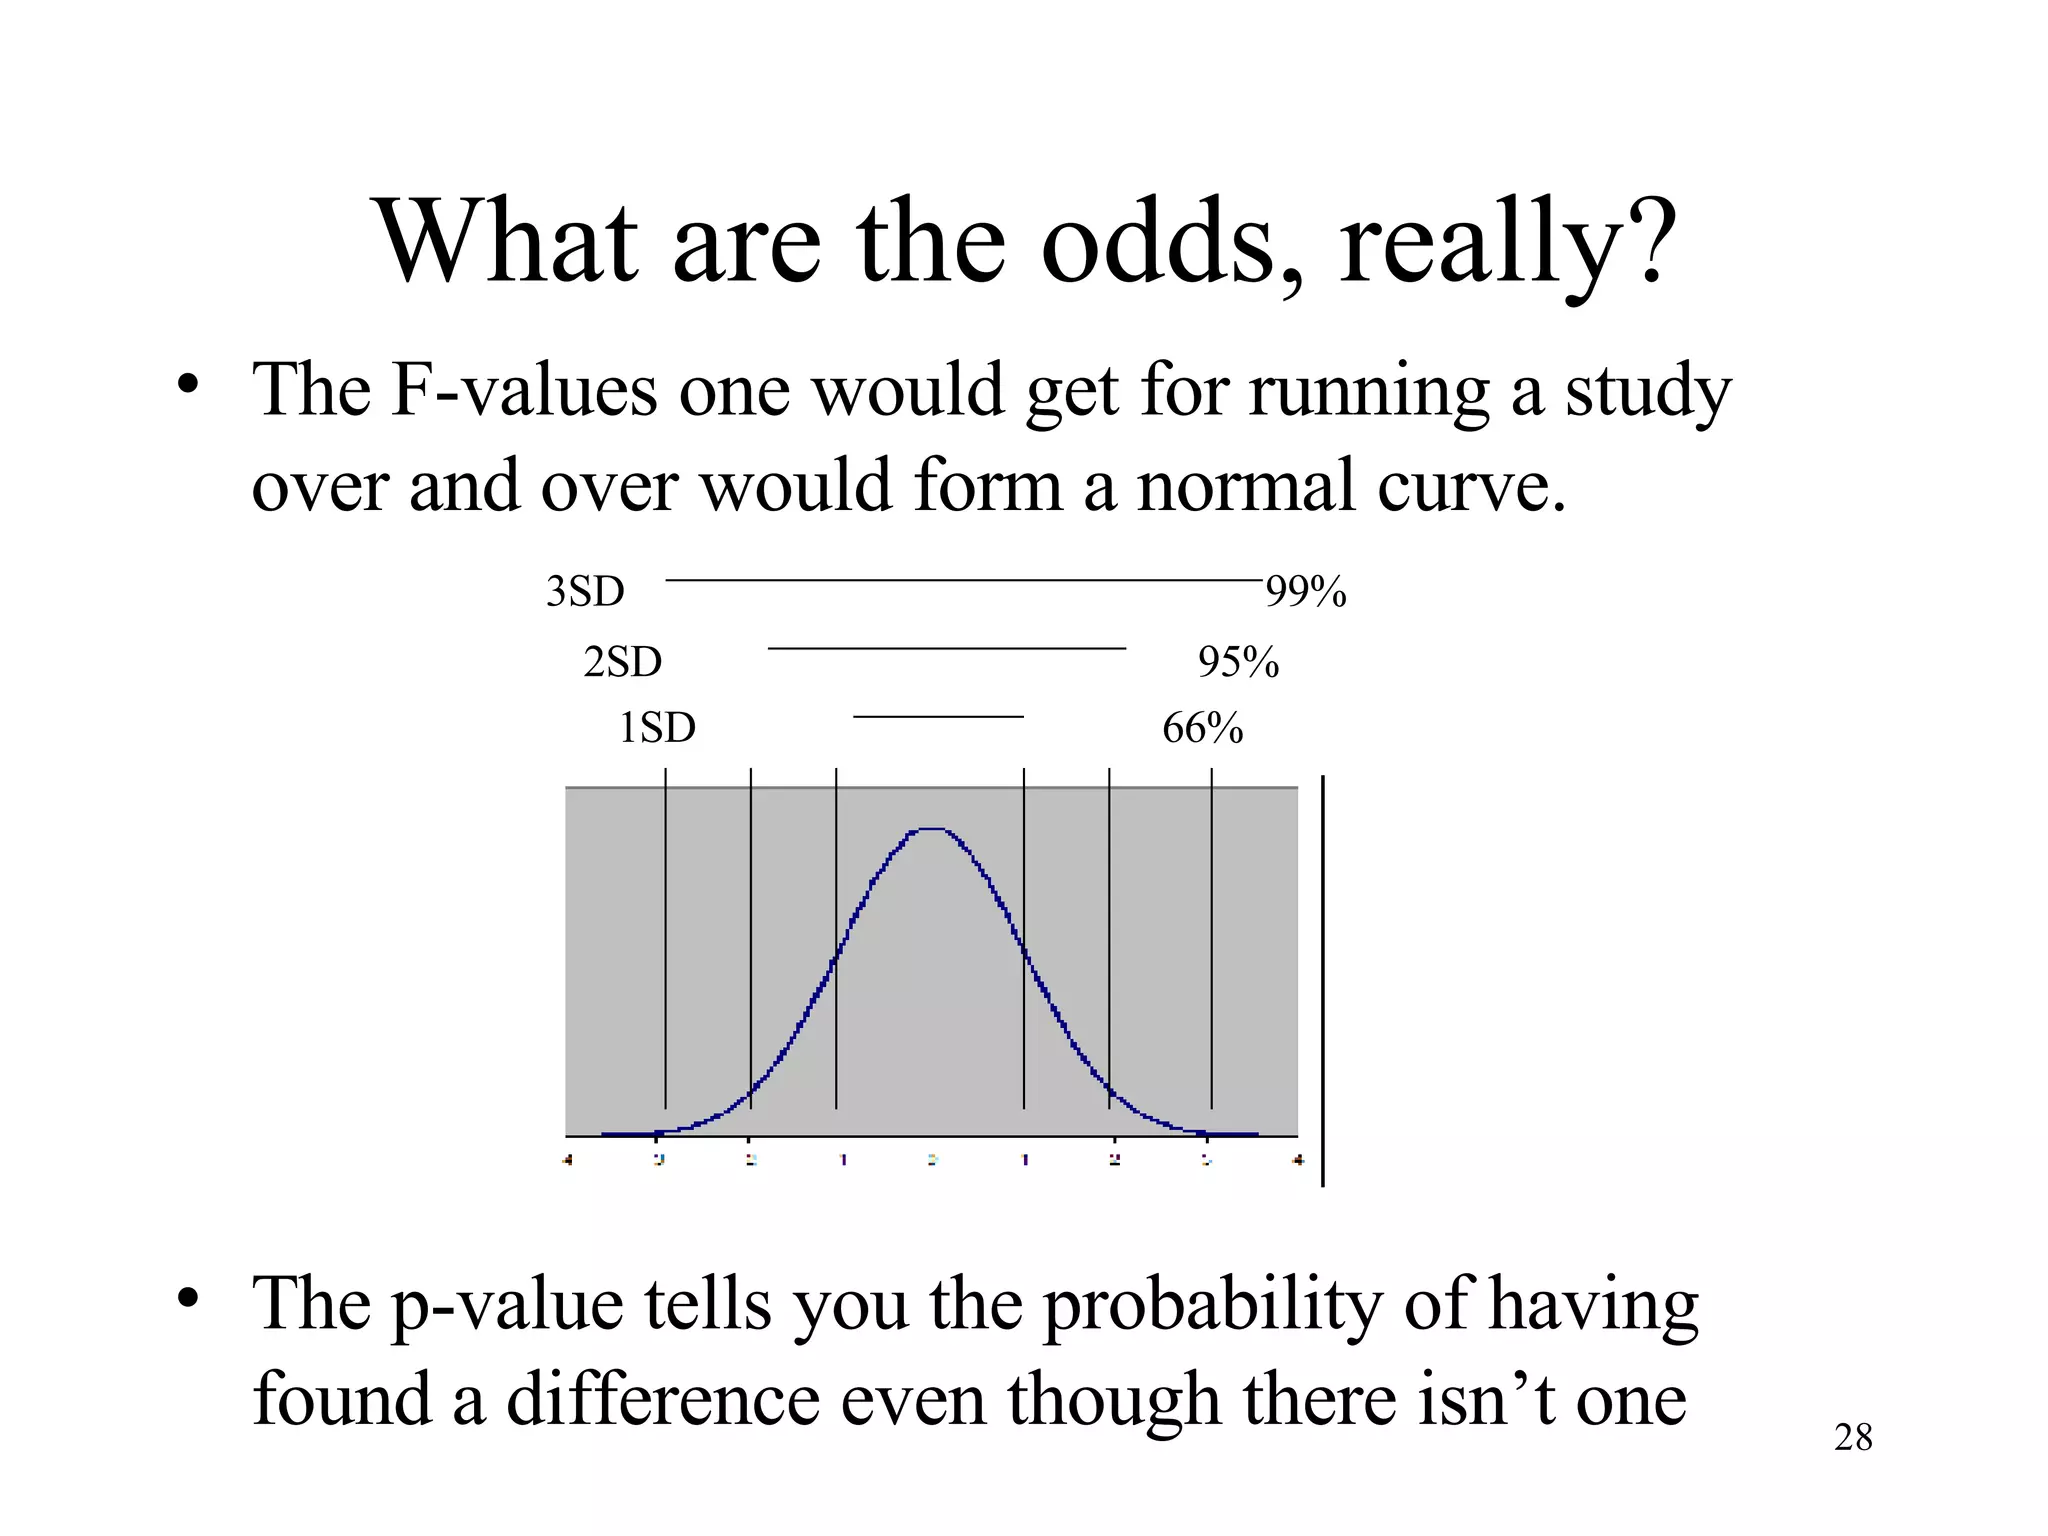
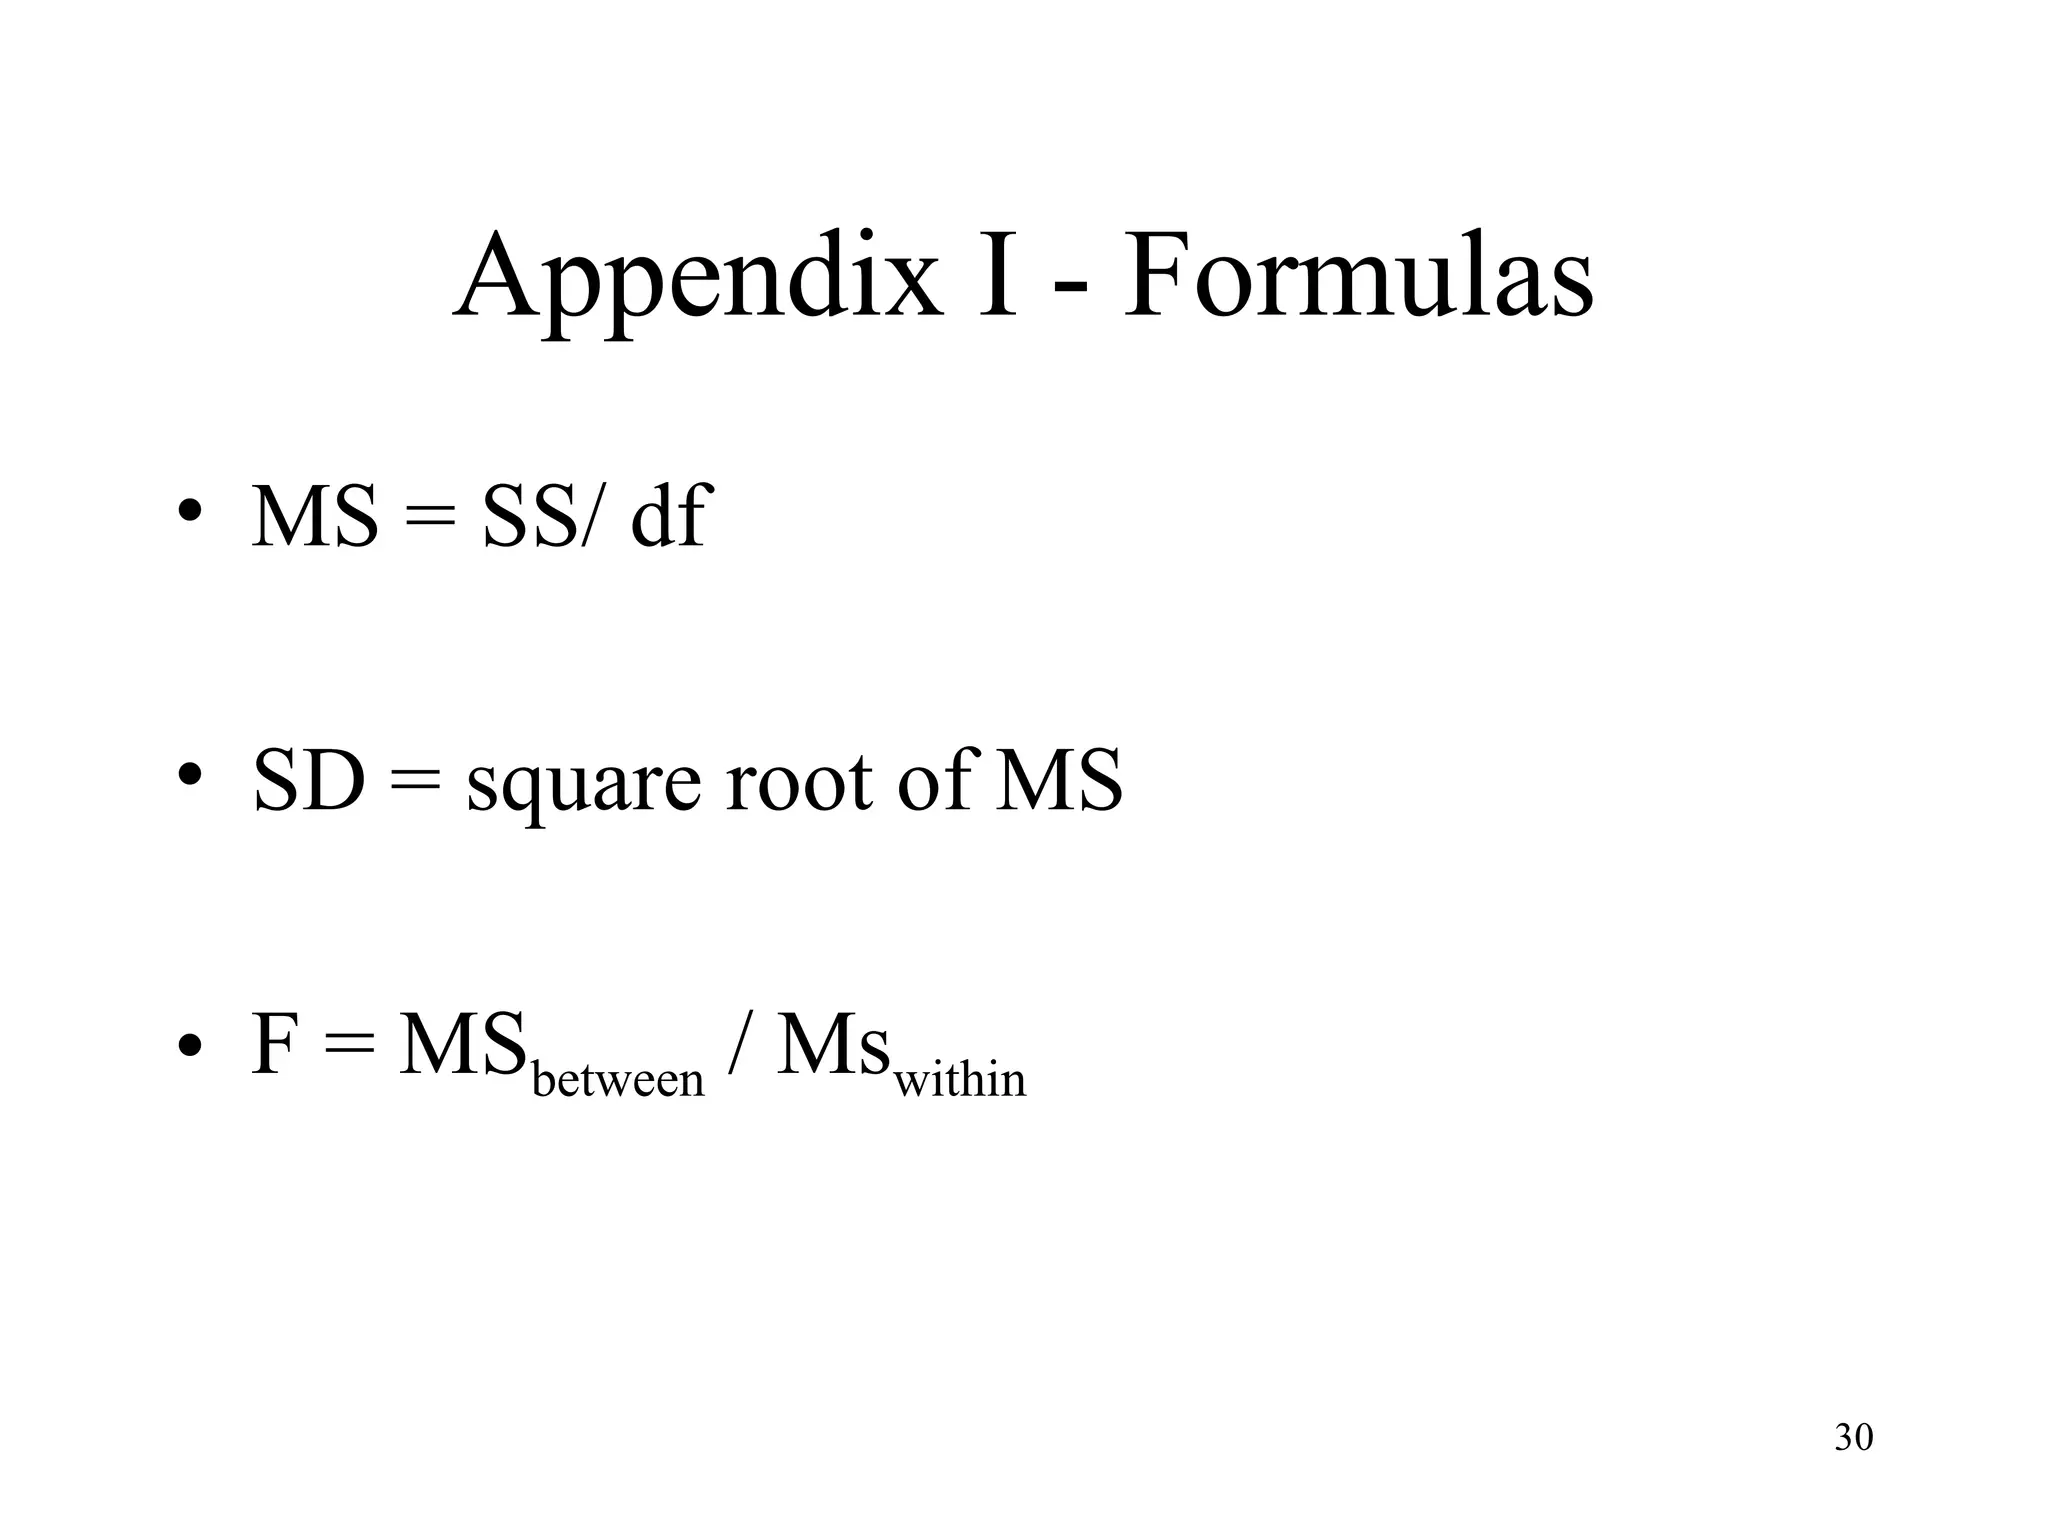
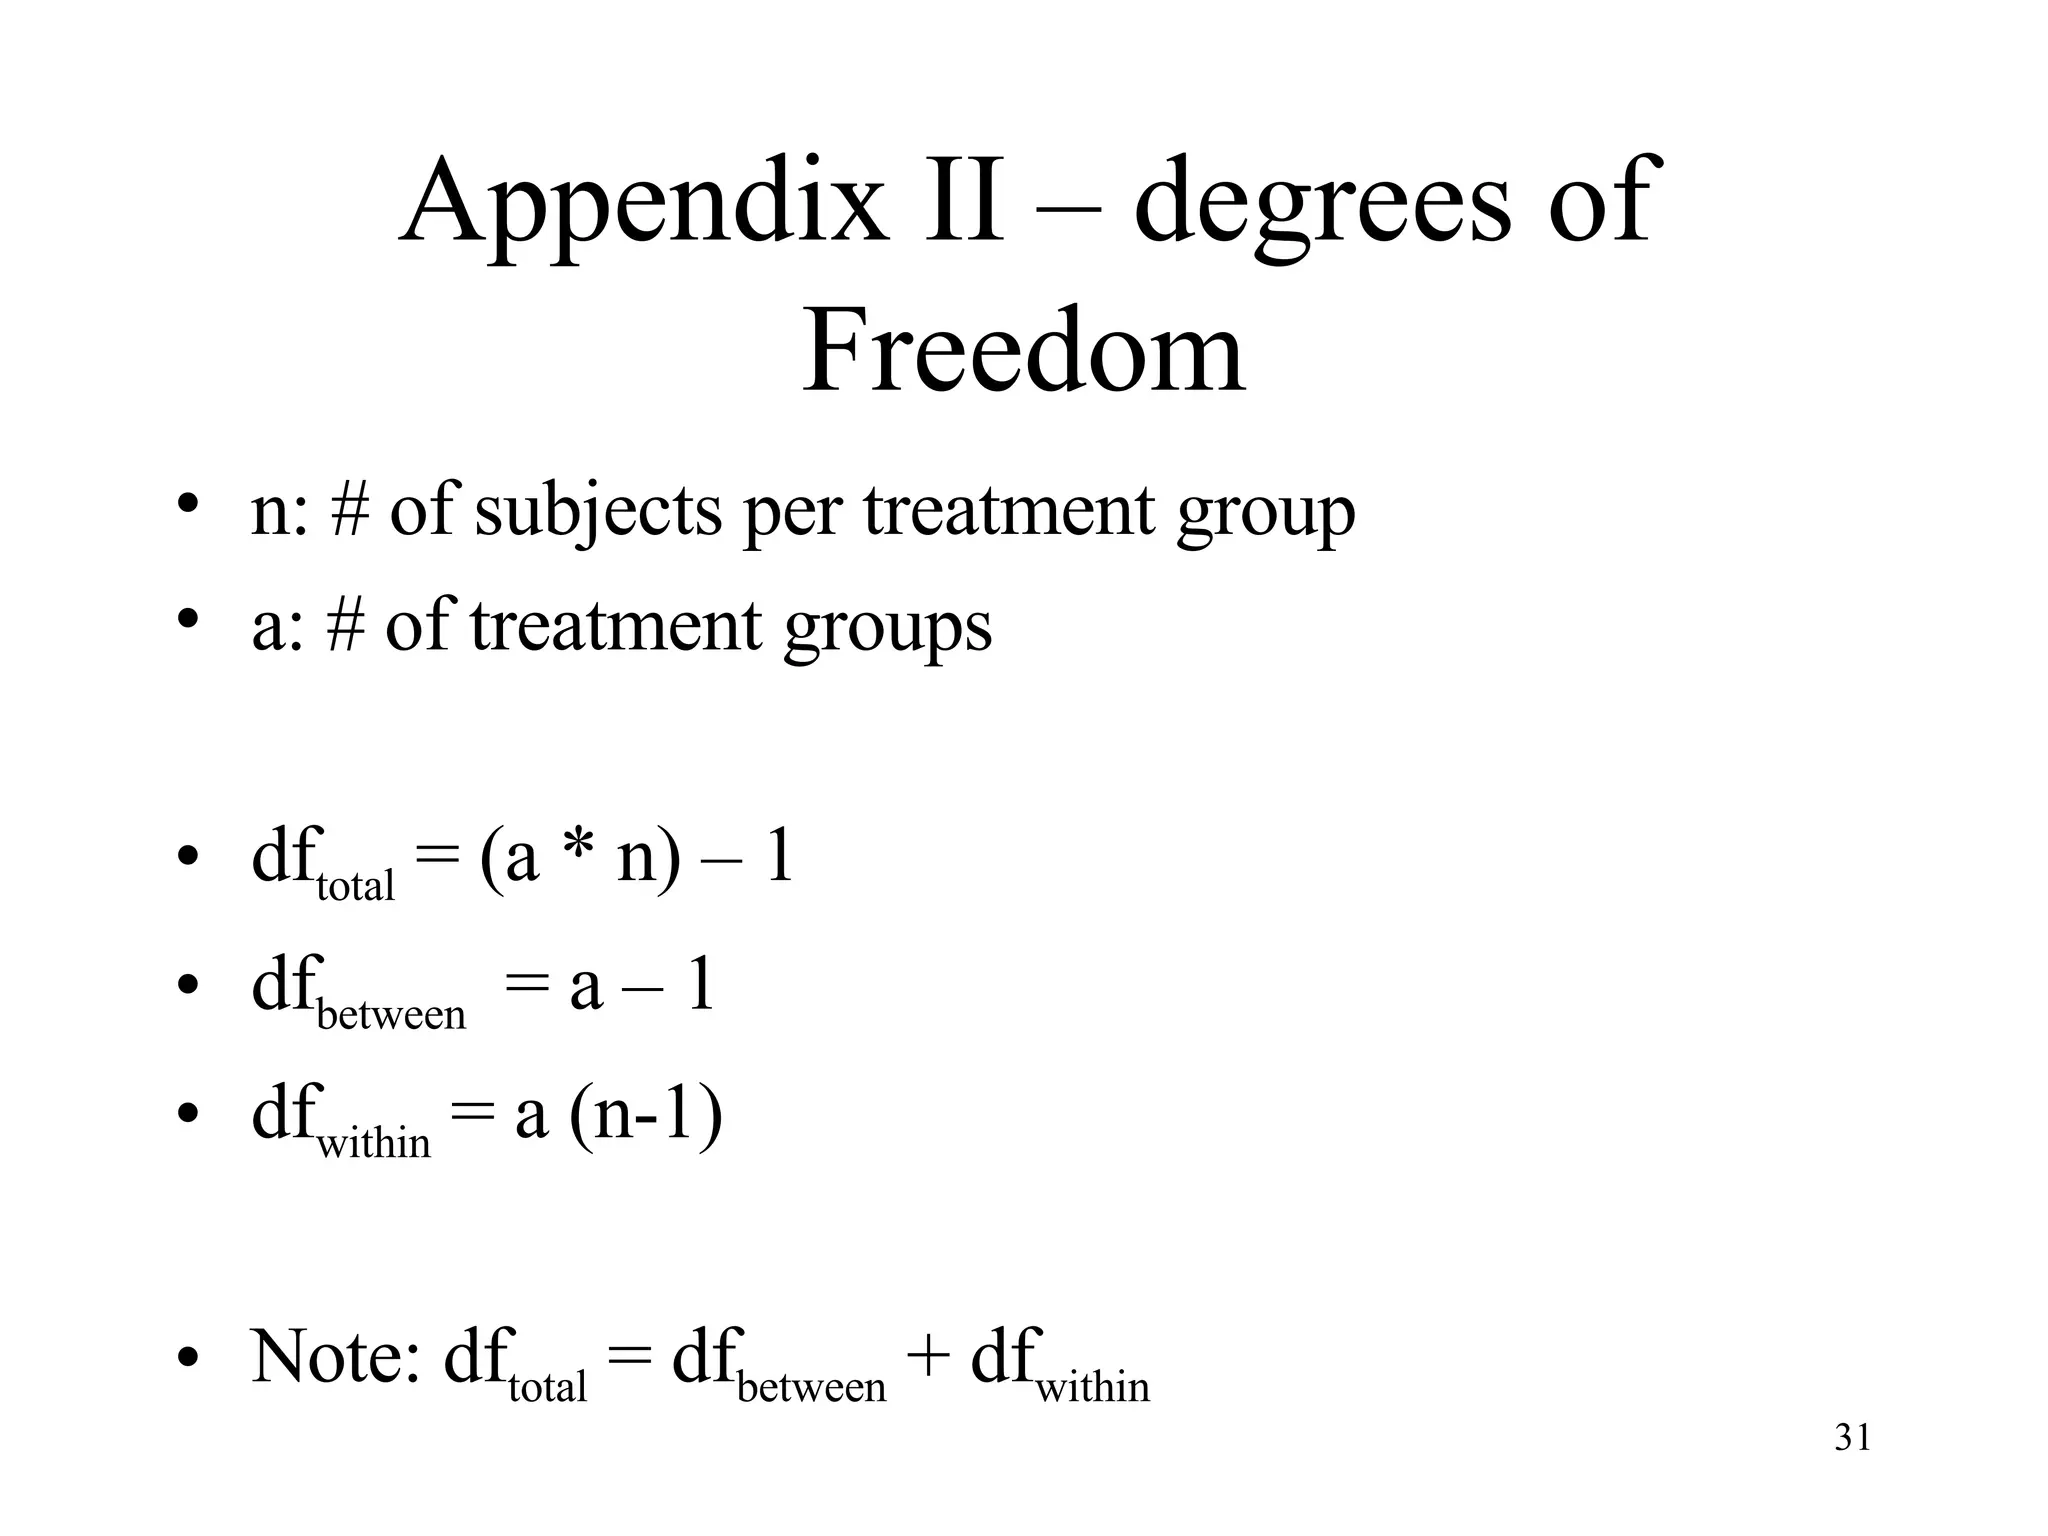
Analyses of Variance (ANOVA’s) A Basic Introduction Florian Schwarz http://florianschwarz.net
What ANOVA’s do ANOVA’s are used to answer a simple question: Do different treatment groups differ on a certain measure? In other words, did our treatment have an effect?
The Null-Hypothesis The Null-hypothesis is that the groups are NOT different What we try to do is to show that the Null-hypothesis is FALSE DON’T try to PROVE the Null-Hypothesis!
Independent Variable ‘ Treatment’ can mean any two (or more) different ways in which we vary an experimental factor For example, we might vary whether subjects have a time constraint or not on making a grammaticality judgment. This is our INDEPENDENT VARIABLE    It has to be CATEGORICAL
Dependent Variable What we measure is the  DEPENDENT VARIABLE An example would be the percentage of how often a certain construction is judged to be grammatical.    It has to be CONTINUOUS    (or QUANTITATIVE)
Generalizing our Finding Just because for the few people we happened to check there was a difference in the different treatment conditions, that doesn’t mean that that is true for the entire POPULATION ANOVA’s tell you whether it is reasonable to generalize your finding
Sources of Variability An ANOVA does that by comparing how different sources of VARIABILITY contribute to the overall variation: Some variance is just due to individual differences between people etc. Some variance is due to our varying the independent variable
Within vs. Between Groups To measure how much of the variability is due to other factors, we look at how much the people WITHIN ONE TREATMENT group differ. To measure how much of the variability is due to our factor, we look at how much of a difference there is BETWEEN GROUPS.
The heart of ANOVA’s The basic ratio of ANOVA’s: F =  BETWEEN GROUP VARIANCE   WITHIN GROUP VARIANCE
What are the Odds? (I) The more variance is due to the treatment, and the less is due to other factors, the bigger your F-value The bigger your F-value, the less likely it is that the differences you found are due to chance
4 Research Scenarios You think there is… Wrong Question? Lucky (sort of) TYPE I ERROR No difference Hmm. Try again TYPE II ERROR Yeah! A Difference No Difference A Difference Actually, there is…
What are the Odds? (II) You think there is… TYPE I ERROR    5 % No difference TYPE II ERROR    POWER A Difference No Difference A Difference Actually, there is…
What are the Odds (III) When 20 of us run the same study, one of us will find a significant difference between groups,  EVEN IF THERE ACTUALLY IS NO DIFFERENCE!
Calculating Sums of Squares
An Example Let’s calculate a simple example For simplicity, we will look at a between subjects design    each subject contributes one data point
An Example We want to know whether taking a linguistics class affects your grammaticality judgments. 2 groups: students that have taken a class and students that have not  (this is the independent variable) We give them 20 grammatical sentences taken from syntax papers. They have to decide whether they are grammatical or not. Dependent Variable: How many out of the 20 sentences do they find grammatical? There are 4 subjects in each treatment group
Total Sums of Squares Group 1  Group 2 (mean 5)  (mean 15) 232 Total SS 64 8 18 118 Group 2 total SS 36 6 16 9 3 13 9 3 13 114 Group1 total SS 4 -2 8 25 -5 5 36 -6 4 49 -7 3 Squared X – overall mean (10) Score (X)
Variance We get (something very close to) the mean of the SS by dividing the SS by the degrees of freedom (usually # of x – 1) MS = variance =  SS = 232  =  33.1   df  7
Standard deviation We get (something very close to) the mean distance of the data points from the overall mean by taking the square root of the variance Variance = 33.1  Standard deviation = square root of variance = 5.8
More Sums of Squares We have calculated the overall variance How much of this is due to Variability within groups? Variability between groups? Let’s calculate Sums of Squares for these
Within Group Sums of Squares Group 1  Group 2 (mean 5)  (mean 15) 32 Total Within Group SS 9 3 18 18 Group 2 within group SS 1 1 16 4 -2 13 4 -2 13 14 Group1 within group SS 9 3 8 0 0 5 1 -1 4 4 -2 3 Squared X - group mean Score (X)
Between Group Sums of Squares Group 1  Group 2 (mean 5)  (mean 15) 5 5 5 5 -5 -5 -5 -5 Group mean – overall mean 200 Total Between Group SS 25 15 18 100 Group 2 contribution to between group SS 25 15 16 25 15 13 25 15 13 100 Group1 contribution to between group SS 25 5 8 25 5 5 25 5 4 25 5 3 Squared group mean Score (X)
Relation between SS You may have noted that the total SS is the sum of the within group and between group SS: SS  total  = SS within + SS between
The F-ratio We almost have everything we need for calculating the F-ratio. We just need to calculate the within group and between group variance MS within  = 32/6 = 5.33 MS between  = 200/1 = 200
The F-ratio F =  MS between   = 200  =  37.5 MS within   5.33
What does this tell you? How likely is it that you would have ended up with this F-value by chance? This depends on how many subjects you ran in how many conditions. You could look this up in an F-table, but any program will give you the desired p-value.
What are the odds, really? Imagine your study would have been run a large number of times Even if there was no difference, every once in a while you’d get a high F-value by chance F-tables tell you how likely it is that this happened
What are the odds, really? The F-values one would get for running a study over and over would form a normal curve.   3SD   99% 2SD 95%   1SD   66% The p-value tells you the probability of having found a difference even though there isn’t one
The p-value The typical cutoff accepted in the social sciences is p = .05 That is, if we are 95% sure that our result did not come about by chance, we accept it (This is, of course, somewhat random)
Appendix I - Formulas MS = SS/ df SD = square root of MS F = MS between  / Ms within
Appendix II – degrees of Freedom n: # of subjects per treatment group a: # of treatment groups df total  = (a * n) – 1 df between   = a – 1 df within  = a (n-1) Note: df total  = df between  + df within
Designing your study We usually use WITHIN SUBJECT designs I.e. every subject sees every condition A very typical design:  S1  S2 2/4 conditions 6 items per condition  I1 ~ 24 subjects Counterbalance  items/conditions  I2 6 x A 6 x B 6 x B 6 x A

Introduction to ANOVAs

  • 1.
    Analyses of Variance(ANOVA’s) A Basic Introduction Florian Schwarz http://florianschwarz.net
  • 2.
    What ANOVA’s doANOVA’s are used to answer a simple question: Do different treatment groups differ on a certain measure? In other words, did our treatment have an effect?
  • 3.
    The Null-Hypothesis TheNull-hypothesis is that the groups are NOT different What we try to do is to show that the Null-hypothesis is FALSE DON’T try to PROVE the Null-Hypothesis!
  • 4.
    Independent Variable ‘Treatment’ can mean any two (or more) different ways in which we vary an experimental factor For example, we might vary whether subjects have a time constraint or not on making a grammaticality judgment. This is our INDEPENDENT VARIABLE  It has to be CATEGORICAL
  • 5.
    Dependent Variable Whatwe measure is the DEPENDENT VARIABLE An example would be the percentage of how often a certain construction is judged to be grammatical.  It has to be CONTINUOUS (or QUANTITATIVE)
  • 6.
    Generalizing our FindingJust because for the few people we happened to check there was a difference in the different treatment conditions, that doesn’t mean that that is true for the entire POPULATION ANOVA’s tell you whether it is reasonable to generalize your finding
  • 7.
    Sources of VariabilityAn ANOVA does that by comparing how different sources of VARIABILITY contribute to the overall variation: Some variance is just due to individual differences between people etc. Some variance is due to our varying the independent variable
  • 8.
    Within vs. BetweenGroups To measure how much of the variability is due to other factors, we look at how much the people WITHIN ONE TREATMENT group differ. To measure how much of the variability is due to our factor, we look at how much of a difference there is BETWEEN GROUPS.
  • 9.
    The heart ofANOVA’s The basic ratio of ANOVA’s: F = BETWEEN GROUP VARIANCE WITHIN GROUP VARIANCE
  • 10.
    What are theOdds? (I) The more variance is due to the treatment, and the less is due to other factors, the bigger your F-value The bigger your F-value, the less likely it is that the differences you found are due to chance
  • 11.
    4 Research ScenariosYou think there is… Wrong Question? Lucky (sort of) TYPE I ERROR No difference Hmm. Try again TYPE II ERROR Yeah! A Difference No Difference A Difference Actually, there is…
  • 12.
    What are theOdds? (II) You think there is… TYPE I ERROR  5 % No difference TYPE II ERROR  POWER A Difference No Difference A Difference Actually, there is…
  • 13.
    What are theOdds (III) When 20 of us run the same study, one of us will find a significant difference between groups, EVEN IF THERE ACTUALLY IS NO DIFFERENCE!
  • 14.
  • 15.
    An Example Let’scalculate a simple example For simplicity, we will look at a between subjects design  each subject contributes one data point
  • 16.
    An Example Wewant to know whether taking a linguistics class affects your grammaticality judgments. 2 groups: students that have taken a class and students that have not (this is the independent variable) We give them 20 grammatical sentences taken from syntax papers. They have to decide whether they are grammatical or not. Dependent Variable: How many out of the 20 sentences do they find grammatical? There are 4 subjects in each treatment group
  • 17.
    Total Sums ofSquares Group 1 Group 2 (mean 5) (mean 15) 232 Total SS 64 8 18 118 Group 2 total SS 36 6 16 9 3 13 9 3 13 114 Group1 total SS 4 -2 8 25 -5 5 36 -6 4 49 -7 3 Squared X – overall mean (10) Score (X)
  • 18.
    Variance We get(something very close to) the mean of the SS by dividing the SS by the degrees of freedom (usually # of x – 1) MS = variance = SS = 232 = 33.1 df 7
  • 19.
    Standard deviation Weget (something very close to) the mean distance of the data points from the overall mean by taking the square root of the variance Variance = 33.1 Standard deviation = square root of variance = 5.8
  • 20.
    More Sums ofSquares We have calculated the overall variance How much of this is due to Variability within groups? Variability between groups? Let’s calculate Sums of Squares for these
  • 21.
    Within Group Sumsof Squares Group 1 Group 2 (mean 5) (mean 15) 32 Total Within Group SS 9 3 18 18 Group 2 within group SS 1 1 16 4 -2 13 4 -2 13 14 Group1 within group SS 9 3 8 0 0 5 1 -1 4 4 -2 3 Squared X - group mean Score (X)
  • 22.
    Between Group Sumsof Squares Group 1 Group 2 (mean 5) (mean 15) 5 5 5 5 -5 -5 -5 -5 Group mean – overall mean 200 Total Between Group SS 25 15 18 100 Group 2 contribution to between group SS 25 15 16 25 15 13 25 15 13 100 Group1 contribution to between group SS 25 5 8 25 5 5 25 5 4 25 5 3 Squared group mean Score (X)
  • 23.
    Relation between SSYou may have noted that the total SS is the sum of the within group and between group SS: SS total = SS within + SS between
  • 24.
    The F-ratio Wealmost have everything we need for calculating the F-ratio. We just need to calculate the within group and between group variance MS within = 32/6 = 5.33 MS between = 200/1 = 200
  • 25.
    The F-ratio F= MS between = 200 = 37.5 MS within 5.33
  • 26.
    What does thistell you? How likely is it that you would have ended up with this F-value by chance? This depends on how many subjects you ran in how many conditions. You could look this up in an F-table, but any program will give you the desired p-value.
  • 27.
    What are theodds, really? Imagine your study would have been run a large number of times Even if there was no difference, every once in a while you’d get a high F-value by chance F-tables tell you how likely it is that this happened
  • 28.
    What are theodds, really? The F-values one would get for running a study over and over would form a normal curve. 3SD 99% 2SD 95% 1SD 66% The p-value tells you the probability of having found a difference even though there isn’t one
  • 29.
    The p-value Thetypical cutoff accepted in the social sciences is p = .05 That is, if we are 95% sure that our result did not come about by chance, we accept it (This is, of course, somewhat random)
  • 30.
    Appendix I -Formulas MS = SS/ df SD = square root of MS F = MS between / Ms within
  • 31.
    Appendix II –degrees of Freedom n: # of subjects per treatment group a: # of treatment groups df total = (a * n) – 1 df between = a – 1 df within = a (n-1) Note: df total = df between + df within
  • 32.
    Designing your studyWe usually use WITHIN SUBJECT designs I.e. every subject sees every condition A very typical design: S1 S2 2/4 conditions 6 items per condition I1 ~ 24 subjects Counterbalance items/conditions I2 6 x A 6 x B 6 x B 6 x A