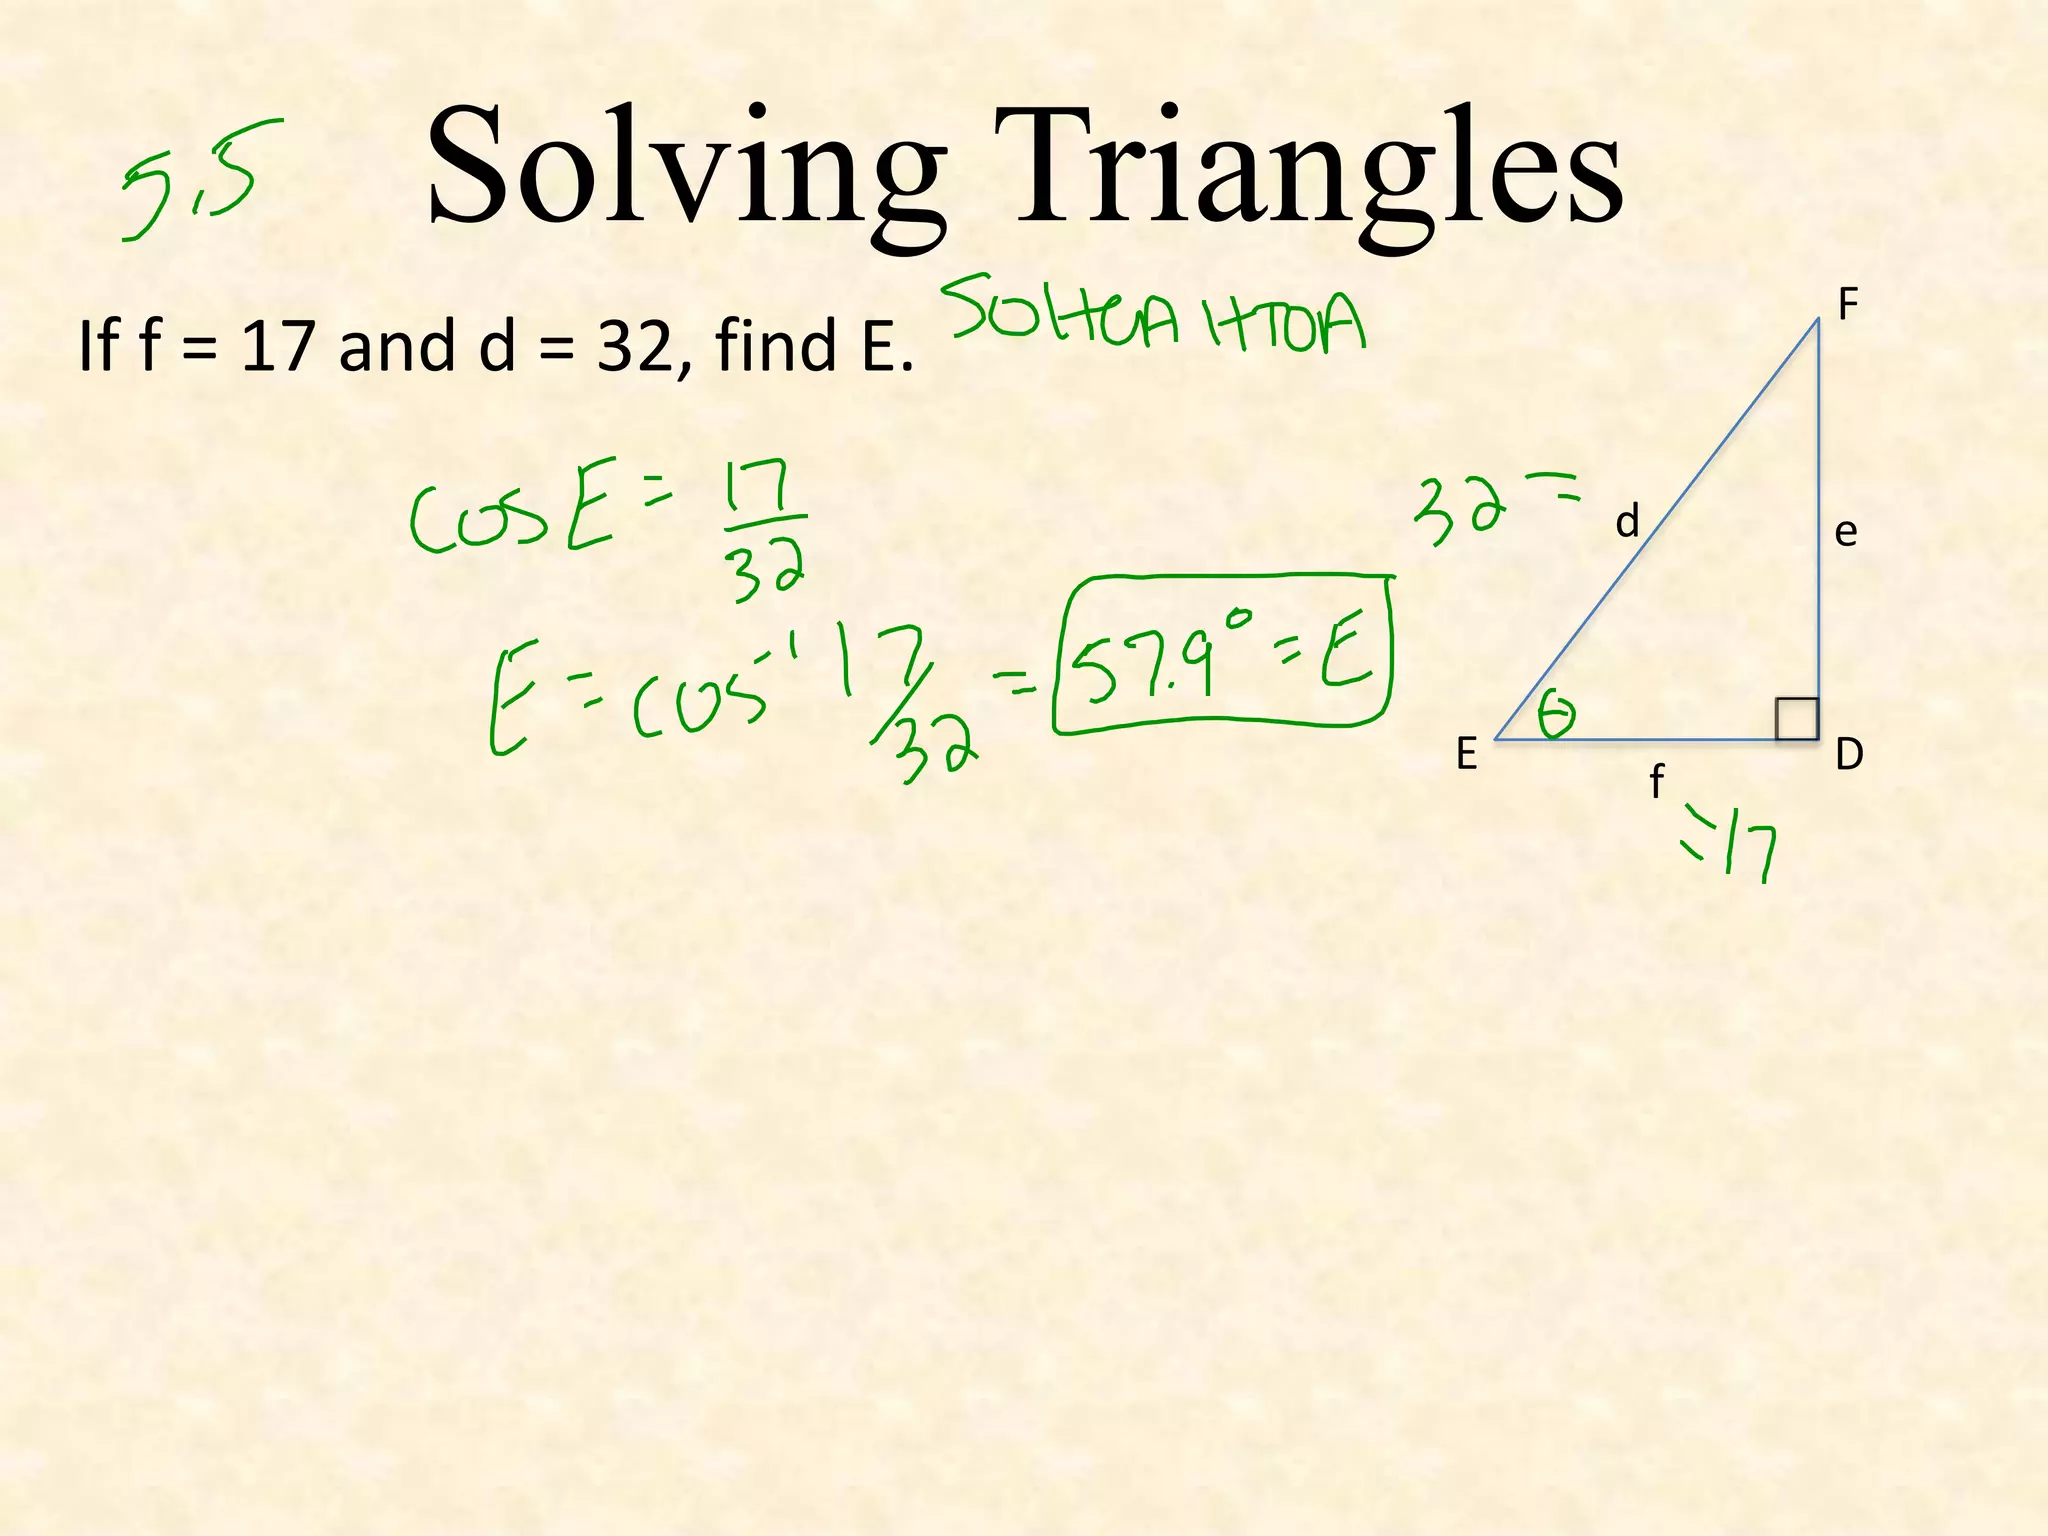
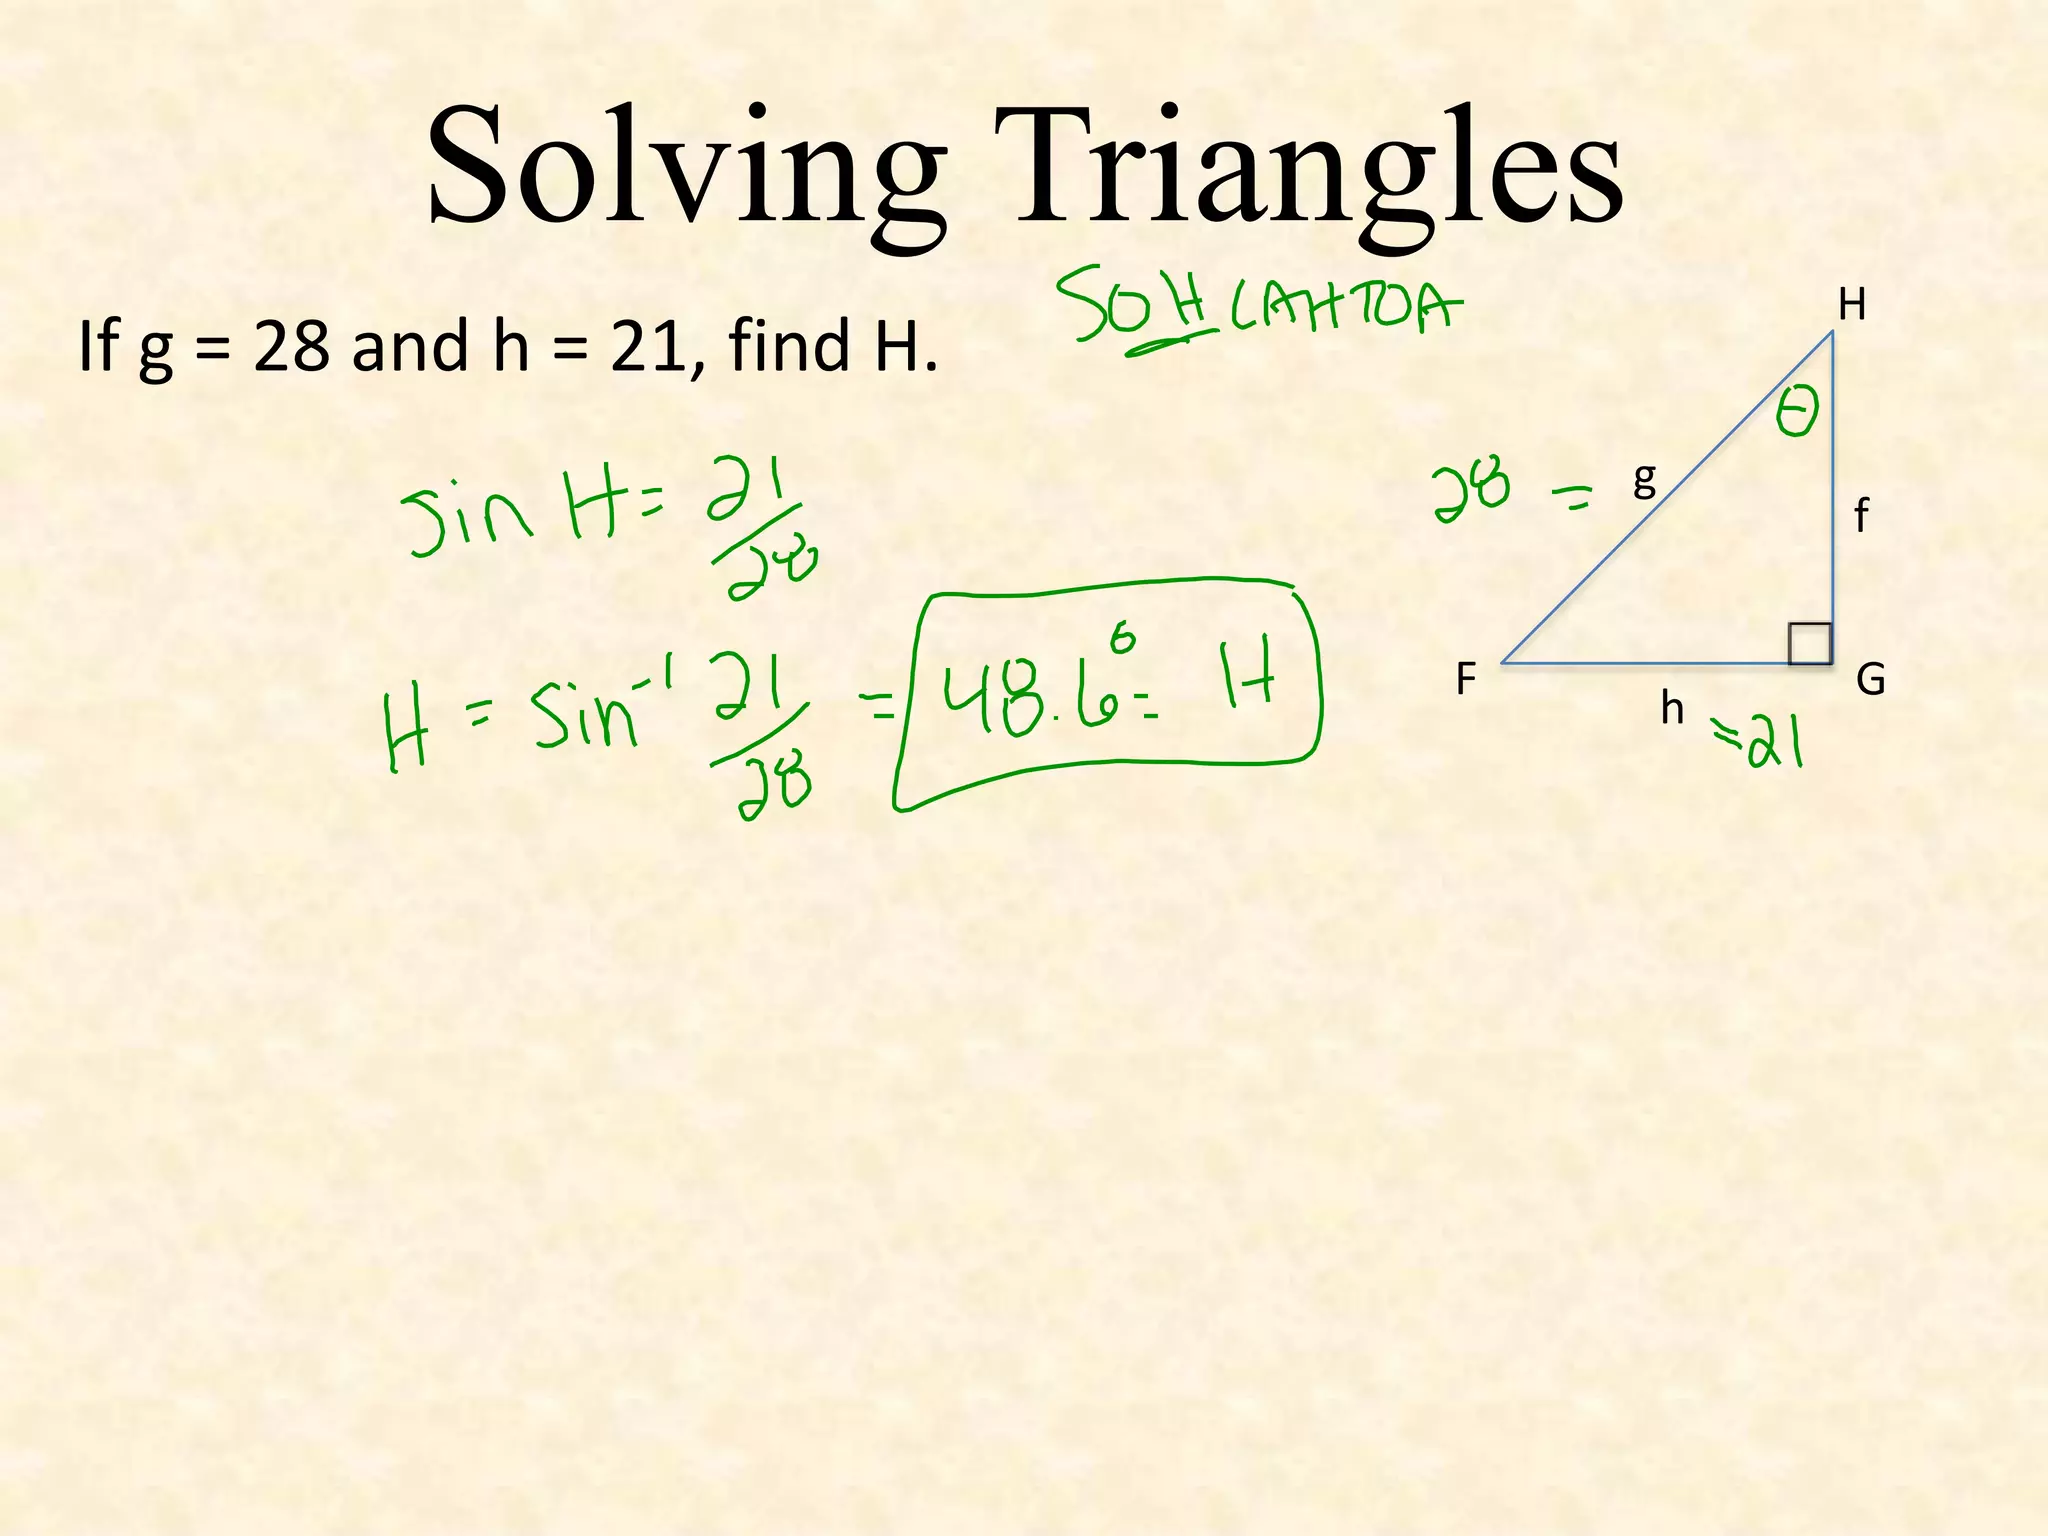
This document contains two triangle problems. The first asks to find angle E given that f = 17 and d = 32. The second asks to find angle H given that g = 28 and h = 21.
Combining Existential Rules with the Power of CP-Theories
Tommaso Di Noia (Politecnico di Bari); Thomas Lukasiewicz (University of Oxford); Maria Vanina Martinez (Univ. Nacional del Sur and CONICET, Argentina); Gerardo I Simari (Univ. Nacional del Sur and CONICET, Argentina); Oana Tifrea-Marciuska (University of Oxford);
The document shows Ashlyn Gilson's solution to finding the values of a and b in the function f(x)=ax+b, given that f(f(f(0)))=29 and f(f(f(1)))=27. She first finds the expressions for f(f(f(0))) and f(f(f(1))) in terms of a and b, then sets them equal to 29 and 27 respectively to form an equation to solve for a and b. She solves for a first, getting a=3, then plugs this back into the original equation to find b=2/13.
The document describes an algorithm for enumerating 2-level polytopes in fixed dimensions. A 2-level polytope has vertices that are contained in two parallel hyperplanes. The algorithm takes as input a list of (d-1)-dimensional 2-level polytopes and extends each one to d dimensions, computing the closed sets of vertices to obtain new d-dimensional 2-level polytopes. Experimental results show the numbers of 2-level polytopes enumerated for dimensions up to 6. Open questions ask for a more output-sensitive enumeration algorithm and whether the number of d-dimensional 2-level polytopes is exponential in d.
This document discusses linear equations and their properties. It provides examples of solving linear equations by finding the slope and y-intercept. The slope is calculated as -10.82 and the y-intercept is 16 based on the given linear equation xy = k(1/x) + p. Further examples and solutions are provided for additional problems.
The document explores different types of conic sections, including ellipses, hyperbolas, circles, and parabolas. It shows how to use completing the square to rewrite general form conic equations into standard form equations for each type. The values of coefficients A, B, C, D, E determine whether the conic is an ellipse, hyperbola, circle, or may degenerate into a line or point. When B is not equal to 0, polar coordinates can be used to graph the conic section.
This document contains 10 math problems with their solutions. Problem 1 asks to find values of m, n, and h for a given function g(x). The answer is m=-3, n=15, h=-3. Problem 2 asks to find values of x, the common difference d, and the sum of the first 12 terms of an arithmetic progression. The answer is x=11, d=14, sum=148.
The document discusses the First Isomorphism Theorem from group theory. It states that if f is a homomorphism from group G to group H with image Im(f) and kernel ker(f), then the quotient group G/ker(f) is isomorphic to the image Im(f).
As an example, it describes the complex numbers C* under multiplication as a group, and the function P that maps each element to its squared absolute value. P is a homomorphism with kernel equal to the unit circle. The quotient group C*/ker(P) is shown to be isomorphic to the positive real numbers under multiplication.
Researchers want to test if a new detergent works better in warm or cold water for hand-washing clothes. To do this, they will use a randomized block design where they block, or separate, the clothes into categories based on expected differences in how they respond to temperature (e.g. cotton vs. wool). They will then randomly assign the detergent and water temperatures within each block to get more precise conclusions about how the detergent performs in each temperature for each type of fabric.
The document discusses simulations and provides examples. It describes simulating a parking lottery at a high school to determine if it was plausibly fair after two students from the same statistics class won spots. It outlines planning the simulation by numbering all 95 eligible students, those in statistics 1-28 and others 29-95, then randomly selecting two numbers using a random number table to simulate drawing winning tickets. The document also discusses simulating collecting NASCAR trading cards from cereal boxes to determine if a fan should be surprised it took 23 boxes to collect all 5 cards.
1) The document discusses conditional probability and independence using examples of students with pierced ears and their gender.
2) Conditional probability is defined as P(B|A), the probability of event B occurring given that event A has already occurred.
3) The example shows that the probability of a student being male given they have pierced ears is different than the probability of being male in general, indicating the events are dependent.
The document discusses trigonometric ratios and solving word problems involving angles of elevation and depression. It provides examples of calculating heights or distances using trigonometric ratios like tangent given angles of elevation or depression and known lengths of the adjacent or opposite sides of right triangles. Specifically, it gives the example of calculating the height of a tree as 8.49 meters using the tangent of the angle of elevation of 23 degrees from a point 20 meters from the base of the tree.
The document discusses using tree diagrams and outcome tables to calculate probabilities of events. It provides examples of flipping a coin twice and drawing colored beads from a bag with replacement. A tree diagram models the possible outcomes as branches and assigns probabilities using the multiplicative principle for independent events. Calculating probabilities involves listing the outcomes and assigning probabilities based on the likelihood of each outcome.
Robots are machines that can be programmed to perform various tasks. There are two main types: stationary robots fixed in one location like on an assembly line, and mobile robots that can move around like robotic forklifts. Robots generally have an arm, power supply, and controlling computer. The arm has movable joints called degrees of freedom. Mobile robots use wheels or tracks and guidance systems like magnets or light to navigate. Intelligent robots have powerful processors, memory, sensors and can learn from their experiences.
This document provides guidance on writing the method section of a research paper. It discusses the purpose of the method section, which is to explain how the data was collected and analyzed. It also discusses common problems to avoid, such as including irrelevant details or unnecessary explanations of basic procedures. The document provides examples of different types of research and an example method section to illustrate the purpose of each part of the methodology. Researchers should describe their methodology in a way that allows others to replicate or adapt their methods.
This document provides instructions for long hand polynomial division. It explains that polynomial division involves splitting up the dividend polynomial and dividing it by the divisor polynomial. It demonstrates the step-by-step process of long hand division with an example of (m^2 - 7m - 11) / (m - 8). The key steps are multiplying the divisor by terms of the dividend and subtracting to cancel out terms until a remainder is reached.
Students in a college statistics class collected data on 178 students' gender and whether their ears were pierced. They recorded this information in a two-way table to calculate probabilities. The two-way table showed that of the 90 male students, 19 had pierced ears. Of the 88 female students, 84 had pierced ears. The probabilities of being male with pierced ears, having pierced ears, or being male or having pierced ears can be determined from this two-way table.
This document provides an overview of key concepts in probability models, including:
1. A probability model consists of a sample space (the set of all possible outcomes) and probabilities assigned to each outcome. Common examples are coin tosses and dice rolls.
2. Events are subsets of outcomes from the sample space. The probability of an event, written P(A), is the chance it occurs.
3. For mutually exclusive events like getting a sum of 5 or 6 on dice, the total probability is the sum of the individual probabilities. Basic rules of probability include that all probabilities must sum to 1 and the probability of an event's complement is 1 minus the original probability.
1. The document discusses various considerations that enter into the process of doing management and business research, including theoretical, epistemological, ontological, and practical issues.
2. It explores the relationship between theory and research, distinguishing between deductive and inductive approaches, and between grand theories and theories of middle range.
3. The document also examines different research strategies and paradigms, such as positivism, realism, interpretivism, and constructionism, and how they relate to the quantitative/qualitative research distinction.
This paper explores how varying definitions of computer-mediated communication (CMC) have led to contradictory findings in research on online and offline relationships. The paper examines four research articles that defined and studied CMC in different ways - as only email, or more broadly. It argues that to fully understand how CMC influences relationships, all forms of online communication need to be considered. The paper analyzes Cummings et al.'s research against other studies to propose more comprehensive examination of CMC that includes all modes of online interaction.
The document provides information about web browsers, email, and how they work. It discusses:
- How web browsers connect to web servers to access web pages coded in HTML and display them, with hyperlinks allowing navigation between pages.
- The basics of email, how it works by sending messages between users through email servers, and some common functions like compose, reply, forward, and attach files.
- Two common ways for users to access their email - through a webmail interface or by using email software like Outlook Express to download messages from the server to their computer.
This document discusses nutrition requirements during pregnancy and lactation. It notes that physiological changes during these periods increase demands for energy, protein, iron, vitamins and other nutrients. Recommended dietary allowances are provided for additional intake of calories, protein, iron, vitamin A, B vitamins and folic acid during pregnancy and lactation. The document recommends eating an extra meal per day to meet increased nutritional needs and emphasizes including foods like cereals, legumes, vegetables, fruits, meat and dairy. Proper nutrition during these critical life stages is important for both maternal and fetal health.
This document discusses the odds of a successful outcome of an event. It defines odds as the ratio of the probability of success to the probability of failure. It also notes that probability is a ratio of the desired outcome to the total possible outcomes. The document directs the reader to additional examples on specific pages to further illustrate the concept of odds and probability.
1. The document discusses logarithmic transformations, which can be used to transform non-linear data into a linear format to better model exponential relationships.
2. There are two options for logarithmic transformations: taking the log of just the response variable y, or taking the log of both the explanatory variable x and the response variable y.
3. Graphing the transformed data allows one to determine which option produces a more linear relationship and thus the better transformation to use.
Transforming data involves changing the scale of measurement used to collect data in order to better model relationships between variables. For example, when modeling the relationship between length and weight of fish, a power model using length cubed better fits the data than a linear model, since weight is related to the cube of length. The marine lab provided reference data that was used to find the least-squares regression line equation to predict fish weights based on their lengths.
This document discusses regression inference and significance testing for the slope parameter in a simple linear regression model. It provides details on conducting a t-test for the slope of the population regression line to test if the slope is equal to some hypothesized value (the null hypothesis) versus an alternative hypothesis where the slope is greater than, less than, or not equal to the hypothesized value. Examples are given on interpreting test statistics and p-values and drawing conclusions about the evidence for or against a linear relationship between two variables based on the regression analysis and test results.
This document discusses regression analysis and the conditions needed to perform statistical inference on regression models. It summarizes key concepts like the population regression line, sample regression line, residuals, and sampling distributions. It then describes 5 conditions for regression inference: linearity, independence, normality, equal variance, and randomness. An example is provided of students collecting data by dropping helicopters from various heights and analyzing the results. Steps are outlined to check if the conditions are met and interpret results from the computer output and confidence interval.
The document discusses using chi-square tests to analyze categorical data. It explains that a chi-square test for homogeneity determines if variables are distributed the same across groups, while a chi-square test for association determines if variables are associated. The key is to select the right test based on whether data came from independent samples or a single sample classified on two variables. An example analyzes data on gender and fear from scary movies using a chi-square test for association.
This document discusses conditions for performing a chi-square goodness-of-fit test and chi-square test for homogeneity. The chi-square goodness-of-fit test requires that all expected counts be greater than 5. The chi-square test for homogeneity can be used to compare distributions across multiple groups, requires random sampling and independence of observations, and that expected counts be at least 5. The document provides an example comparing wine purchases with different music, calculates the chi-square statistic, and interprets the p-value to determine if distributions differ.
The document describes a study conducted in a supermarket to examine the effect of background music on wine purchases. Customers were randomly assigned to one of three conditions: no music, French accordion music, or Italian string music. The number of bottles of French, Italian, and other wines purchased under each condition were recorded. A chi-square test is proposed to determine if the distribution of wine purchases differs across the three music treatments.
The document describes using a chi-square test to determine if the number of cars choosing each of three toll booth lanes is equal. An toll collector randomly sampled cars and recorded the lane chosen. The appropriate hypothesis is that the proportions of cars choosing each lane are equal (option c). The document then provides an example chi-square test on birth data to see if births are evenly distributed by day of week. It describes the chi-square test steps and conditions.
This document discusses using the chi-square statistic to test whether observed sample results differ significantly from expected results. It provides the formula for calculating chi-square and explains that larger chi-square values provide stronger evidence against the null hypothesis. It then works through an example using data on M&M colors to calculate chi-square and determine the P-value to assess significance. The key steps are outlined as calculating chi-square, determining the degrees of freedom, using a chi-square table to find the P-value based on the chi-square value and degrees of freedom, and comparing the P-value to the significance level to determine whether to reject or fail to reject the null hypothesis.
This document discusses using a chi-square goodness-of-fit test to determine if the observed color distribution of M&M's in a sample package matches the expected distribution claimed by the company. Students are instructed to calculate expected counts for each color based on the company's proportions, observe counts in their package, and calculate a chi-square statistic by summing the squared differences between observed and expected counts divided by the expected counts. A large chi-square value provides evidence against the null hypothesis that the company's claimed color distribution is correct.
This document discusses key concepts in probability, including examples using dice, coin tosses, and the law of large numbers. It explains that the proportion of specific outcomes approaches a single probability value as the number of repetitions increases. Probability is defined as a value between 0 and 1 describing the long-run frequency of an outcome. Myths about probability, like short-run predictability and the law of averages, are also addressed.
The document discusses different types of studies and the inferences that can be drawn from them. Random selection of individuals allows inferences about a population, while random assignment to groups allows inferences about causation. Observational studies using non-randomly assigned groups can infer characteristics of populations but not causation. Only randomized experiments and observational studies using random selection can potentially establish causal relationships.
This document describes an experiment conducted by an electric company to test two approaches to encouraging energy conservation among customers: 1) providing small digital displays in households to show current electricity use and estimated monthly cost, and 2) giving customers a chart and information to monitor electricity use from their outside meter. The company will conduct an experiment comparing these two approaches to a control group that only receives general energy consumption information. The summary describes how the experiment would use a randomized design involving 60 households willing to participate, with the households randomly assigned to the three groups to compare the approaches.
Walmart Business+ and Spark Good for Nonprofits.pdfTechSoup
"Learn about all the ways Walmart supports nonprofit organizations.
You will hear from Liz Willett, the Head of Nonprofits, and hear about what Walmart is doing to help nonprofits, including Walmart Business and Spark Good. Walmart Business+ is a new offer for nonprofits that offers discounts and also streamlines nonprofits order and expense tracking, saving time and money.
The webinar may also give some examples on how nonprofits can best leverage Walmart Business+.
The event will cover the following::
Walmart Business + (https://business.walmart.com/plus) is a new shopping experience for nonprofits, schools, and local business customers that connects an exclusive online shopping experience to stores. Benefits include free delivery and shipping, a 'Spend Analytics” feature, special discounts, deals and tax-exempt shopping.
Special TechSoup offer for a free 180 days membership, and up to $150 in discounts on eligible orders.
Spark Good (walmart.com/sparkgood) is a charitable platform that enables nonprofits to receive donations directly from customers and associates.
Answers about how you can do more with Walmart!"
How to Make a Field Mandatory in Odoo 17Celine George
In Odoo, making a field required can be done through both Python code and XML views. When you set the required attribute to True in Python code, it makes the field required across all views where it's used. Conversely, when you set the required attribute in XML views, it makes the field required only in the context of that particular view.
Leveraging Generative AI to Drive Nonprofit InnovationTechSoup
In this webinar, participants learned how to utilize Generative AI to streamline operations and elevate member engagement. Amazon Web Service experts provided a customer specific use cases and dived into low/no-code tools that are quick and easy to deploy through Amazon Web Service (AWS.)
Chapter wise All Notes of First year Basic Civil Engineering.pptxDenish Jangid
Chapter wise All Notes of First year Basic Civil Engineering
Syllabus
Chapter-1
Introduction to objective, scope and outcome the subject
Chapter 2
Introduction: Scope and Specialization of Civil Engineering, Role of civil Engineer in Society, Impact of infrastructural development on economy of country.
Chapter 3
Surveying: Object Principles & Types of Surveying; Site Plans, Plans & Maps; Scales & Unit of different Measurements.
Linear Measurements: Instruments used. Linear Measurement by Tape, Ranging out Survey Lines and overcoming Obstructions; Measurements on sloping ground; Tape corrections, conventional symbols. Angular Measurements: Instruments used; Introduction to Compass Surveying, Bearings and Longitude & Latitude of a Line, Introduction to total station.
Levelling: Instrument used Object of levelling, Methods of levelling in brief, and Contour maps.
Chapter 4
Buildings: Selection of site for Buildings, Layout of Building Plan, Types of buildings, Plinth area, carpet area, floor space index, Introduction to building byelaws, concept of sun light & ventilation. Components of Buildings & their functions, Basic concept of R.C.C., Introduction to types of foundation
Chapter 5
Transportation: Introduction to Transportation Engineering; Traffic and Road Safety: Types and Characteristics of Various Modes of Transportation; Various Road Traffic Signs, Causes of Accidents and Road Safety Measures.
Chapter 6
Environmental Engineering: Environmental Pollution, Environmental Acts and Regulations, Functional Concepts of Ecology, Basics of Species, Biodiversity, Ecosystem, Hydrological Cycle; Chemical Cycles: Carbon, Nitrogen & Phosphorus; Energy Flow in Ecosystems.
Water Pollution: Water Quality standards, Introduction to Treatment & Disposal of Waste Water. Reuse and Saving of Water, Rain Water Harvesting. Solid Waste Management: Classification of Solid Waste, Collection, Transportation and Disposal of Solid. Recycling of Solid Waste: Energy Recovery, Sanitary Landfill, On-Site Sanitation. Air & Noise Pollution: Primary and Secondary air pollutants, Harmful effects of Air Pollution, Control of Air Pollution. . Noise Pollution Harmful Effects of noise pollution, control of noise pollution, Global warming & Climate Change, Ozone depletion, Greenhouse effect
Text Books:
1. Palancharmy, Basic Civil Engineering, McGraw Hill publishers.
2. Satheesh Gopi, Basic Civil Engineering, Pearson Publishers.
3. Ketki Rangwala Dalal, Essentials of Civil Engineering, Charotar Publishing House.
4. BCP, Surveying volume 1
Temple of Asclepius in Thrace. Excavation resultsKrassimira Luka
The temple and the sanctuary around were dedicated to Asklepios Zmidrenus. This name has been known since 1875 when an inscription dedicated to him was discovered in Rome. The inscription is dated in 227 AD and was left by soldiers originating from the city of Philippopolis (modern Plovdiv).
हिंदी वर्णमाला पीपीटी, hindi alphabet PPT presentation, hindi varnamala PPT, Hindi Varnamala pdf, हिंदी स्वर, हिंदी व्यंजन, sikhiye hindi varnmala, dr. mulla adam ali, hindi language and literature, hindi alphabet with drawing, hindi alphabet pdf, hindi varnamala for childrens, hindi language, hindi varnamala practice for kids, https://www.drmullaadamali.com
ISO/IEC 27001, ISO/IEC 42001, and GDPR: Best Practices for Implementation and...PECB
Denis is a dynamic and results-driven Chief Information Officer (CIO) with a distinguished career spanning information systems analysis and technical project management. With a proven track record of spearheading the design and delivery of cutting-edge Information Management solutions, he has consistently elevated business operations, streamlined reporting functions, and maximized process efficiency.
Certified as an ISO/IEC 27001: Information Security Management Systems (ISMS) Lead Implementer, Data Protection Officer, and Cyber Risks Analyst, Denis brings a heightened focus on data security, privacy, and cyber resilience to every endeavor.
His expertise extends across a diverse spectrum of reporting, database, and web development applications, underpinned by an exceptional grasp of data storage and virtualization technologies. His proficiency in application testing, database administration, and data cleansing ensures seamless execution of complex projects.
What sets Denis apart is his comprehensive understanding of Business and Systems Analysis technologies, honed through involvement in all phases of the Software Development Lifecycle (SDLC). From meticulous requirements gathering to precise analysis, innovative design, rigorous development, thorough testing, and successful implementation, he has consistently delivered exceptional results.
Throughout his career, he has taken on multifaceted roles, from leading technical project management teams to owning solutions that drive operational excellence. His conscientious and proactive approach is unwavering, whether he is working independently or collaboratively within a team. His ability to connect with colleagues on a personal level underscores his commitment to fostering a harmonious and productive workplace environment.
Date: May 29, 2024
Tags: Information Security, ISO/IEC 27001, ISO/IEC 42001, Artificial Intelligence, GDPR
-------------------------------------------------------------------------------
Find out more about ISO training and certification services
Training: ISO/IEC 27001 Information Security Management System - EN | PECB
ISO/IEC 42001 Artificial Intelligence Management System - EN | PECB
General Data Protection Regulation (GDPR) - Training Courses - EN | PECB
Webinars: https://pecb.com/webinars
Article: https://pecb.com/article
-------------------------------------------------------------------------------
For more information about PECB:
Website: https://pecb.com/
LinkedIn: https://www.linkedin.com/company/pecb/
Facebook: https://www.facebook.com/PECBInternational/
Slideshare: http://www.slideshare.net/PECBCERTIFICATION
How to Setup Warehouse & Location in Odoo 17 InventoryCeline George
In this slide, we'll explore how to set up warehouses and locations in Odoo 17 Inventory. This will help us manage our stock effectively, track inventory levels, and streamline warehouse operations.