Downloaded 202 times
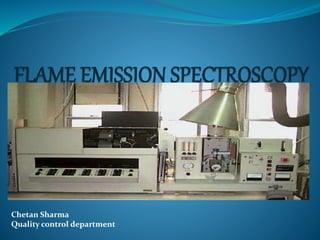

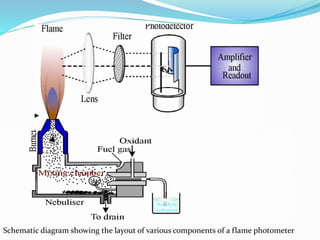

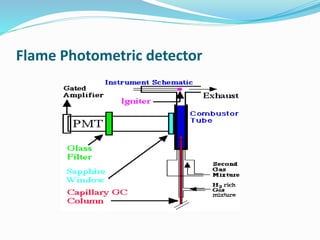

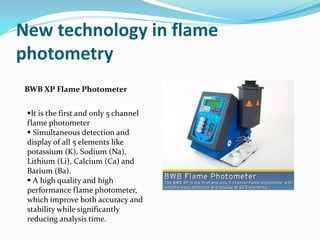


Flame photometry is a technique that uses the intensity of light emitted from excited metal atoms to determine the concentration of metals in a solution. It works by nebulizing a liquid sample into a flame, which excites the metal atoms causing them to emit light at characteristic wavelengths. A monochromator isolates the wavelengths, and a detector measures the light intensities to quantify the metals. Common applications include analysis of sodium, potassium, lithium, calcium, and barium in biological fluids and industrial samples. Potential interferences include overlap of emission spectra between elements, ionization of atoms, and chemical reactions affecting atomization. New technologies allow simultaneous detection of multiple elements to improve accuracy and efficiency.


