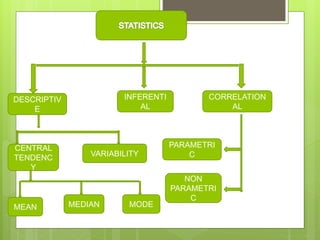
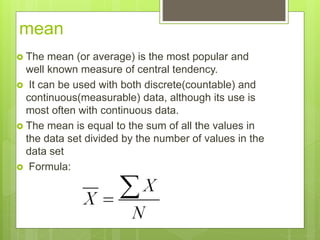
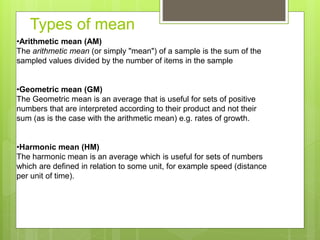
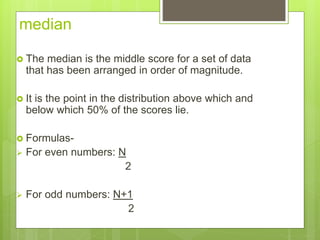
Descriptive Statistics:
Measures of central tendency
Dr. Molly Joy
Professor and Head, Department of Psychology
, Kristu Jayanti College Bangalore
DESCRIPTIV
E
INFERENTI
AL
CORRELATION
AL
PARAMETRI
C
NON
PARAMETRI
C
CENTRAL
TENDENC
Y
VARIABILITY
MEAN MEDIAN MODE
Descriptive Statistics
 Descriptive statistics is the term given to the analysis of
data that helps describe, show or summarize data in a
meaningful way.
 Descriptive statistics do not, allow us to make
conclusions beyond the data we have analyzed or
reach conclusions regarding any hypotheses we might
have made.
 They are simply a way to describe the data.
 Descriptive statistics is very important because if
we simply presented our raw data it would be hard
to visualize what the data was showing, especially
if there was a lot of it.
 Descriptive statistics therefore enables us to
present the data in a more meaningful way, which
allows simpler interpretation of the data.
 Typically, there are two general types of statistic
that are used to describe data:
1. Measures of Central Tendency.
2. Variability.
Measures of Central Tendency
 A measure of central tendency is a single value
that attempts to describe a set of data by
identifying the central position within that set of
data.
 Measures of central tendency are sometimes
called measures of central location.
 They are also classed as summary statistics.
 The mean (often called the average) is most
likely the measure of central tendency that you
are most familiar with, but there are others, such
as the median and the mode.
 These are ways of describing the central position
of a frequency distribution for a group of data.
mean
 The mean (or average) is the most popular and
well known measure of central tendency.
 It can be used with both discrete(countable) and
continuous(measurable) data, although its use is
most often with continuous data.
 The mean is equal to the sum of all the values in
the data set divided by the number of values in the
data set
 Formula:
Types of mean
•Arithmetic mean (AM)
The arithmetic mean (or simply "mean") of a sample is the sum of the
sampled values divided by the number of items in the sample
•Geometric mean (GM)
The Geometric mean is an average that is useful for sets of positive
numbers that are interpreted according to their product and not their
sum (as is the case with the arithmetic mean) e.g. rates of growth.
•Harmonic mean (HM)
The harmonic mean is an average which is useful for sets of numbers
which are defined in relation to some unit, for example speed (distance
per unit of time).
median
 The median is the middle score for a set of data
that has been arranged in order of magnitude.
 It is the point in the distribution above which and
below which 50% of the scores lie.
 Formulas-
 For even numbers: N
2
 For odd numbers: N+1
2
For Class interval: N – Cf
L+ 2_________ * Ci
fm
Where,
• N is the median
2
• Cumulative previous will be the lower cumulative
frequency score.
• l = lower limit of the class interval at which the
median lies.
• Fm = corresponding frequency of the median
• i = length of the class interval.
Our median mark is the middle mark - in this case, 56
(highlighted in bold). It is the middle mark because there are 5
scores before it and 5 scores after it.
 This works fine when you have an odd number of
scores, but what happens when you have an even
number of scores? What if you had only 10 scores?
 Well, you simply have to take the middle two scores
and average the result.
mode
 The mode is the highest occurring score score in the
distribution.
 On a histogram it represents the highest bar in a bar
chart or histogram.
 You can, therefore, sometimes consider the mode as
being the most popular option.
 Normally, the mode is used for categorical data
where we wish to know which is the most common
category.
 Formula: Mode = 3 Median – 2 Mean
2
 An example of a mode is presented below:
Types of mode
• Unimodal:
Single highest occurring value.
• Bimodal:
A pair of the highest occurring value.
• Multimodal:
Three or more than three highest occurring
values.
Reference:
 https://statistics.laerd.com/statistical-
guides/measures-central-tendency-mean-
mode-median-faqs.php

Descriptive statistics

  • 1.
    Descriptive Statistics: Measures ofcentral tendency Dr. Molly Joy Professor and Head, Department of Psychology , Kristu Jayanti College Bangalore
  • 2.
  • 3.
    Descriptive Statistics  Descriptivestatistics is the term given to the analysis of data that helps describe, show or summarize data in a meaningful way.  Descriptive statistics do not, allow us to make conclusions beyond the data we have analyzed or reach conclusions regarding any hypotheses we might have made.  They are simply a way to describe the data.
  • 4.
     Descriptive statisticsis very important because if we simply presented our raw data it would be hard to visualize what the data was showing, especially if there was a lot of it.  Descriptive statistics therefore enables us to present the data in a more meaningful way, which allows simpler interpretation of the data.
  • 5.
     Typically, thereare two general types of statistic that are used to describe data: 1. Measures of Central Tendency. 2. Variability.
  • 6.
    Measures of CentralTendency  A measure of central tendency is a single value that attempts to describe a set of data by identifying the central position within that set of data.  Measures of central tendency are sometimes called measures of central location.  They are also classed as summary statistics.
  • 7.
     The mean(often called the average) is most likely the measure of central tendency that you are most familiar with, but there are others, such as the median and the mode.  These are ways of describing the central position of a frequency distribution for a group of data.
  • 8.
    mean  The mean(or average) is the most popular and well known measure of central tendency.  It can be used with both discrete(countable) and continuous(measurable) data, although its use is most often with continuous data.  The mean is equal to the sum of all the values in the data set divided by the number of values in the data set  Formula:
  • 9.
    Types of mean •Arithmeticmean (AM) The arithmetic mean (or simply "mean") of a sample is the sum of the sampled values divided by the number of items in the sample •Geometric mean (GM) The Geometric mean is an average that is useful for sets of positive numbers that are interpreted according to their product and not their sum (as is the case with the arithmetic mean) e.g. rates of growth. •Harmonic mean (HM) The harmonic mean is an average which is useful for sets of numbers which are defined in relation to some unit, for example speed (distance per unit of time).
  • 10.
    median  The medianis the middle score for a set of data that has been arranged in order of magnitude.  It is the point in the distribution above which and below which 50% of the scores lie.  Formulas-  For even numbers: N 2  For odd numbers: N+1 2
  • 11.
    For Class interval:N – Cf L+ 2_________ * Ci fm Where, • N is the median 2 • Cumulative previous will be the lower cumulative frequency score. • l = lower limit of the class interval at which the median lies. • Fm = corresponding frequency of the median • i = length of the class interval.
  • 12.
    Our median markis the middle mark - in this case, 56 (highlighted in bold). It is the middle mark because there are 5 scores before it and 5 scores after it.
  • 13.
     This worksfine when you have an odd number of scores, but what happens when you have an even number of scores? What if you had only 10 scores?  Well, you simply have to take the middle two scores and average the result.
  • 15.
    mode  The modeis the highest occurring score score in the distribution.  On a histogram it represents the highest bar in a bar chart or histogram.  You can, therefore, sometimes consider the mode as being the most popular option.  Normally, the mode is used for categorical data where we wish to know which is the most common category.  Formula: Mode = 3 Median – 2 Mean 2
  • 16.
     An exampleof a mode is presented below:
  • 17.
    Types of mode •Unimodal: Single highest occurring value. • Bimodal: A pair of the highest occurring value. • Multimodal: Three or more than three highest occurring values.
  • 18.