Downloaded 152 times
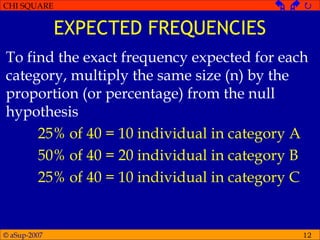
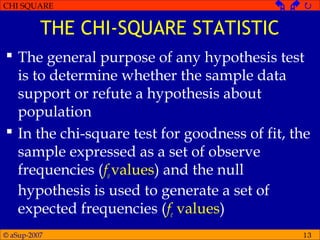
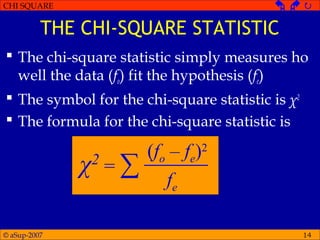
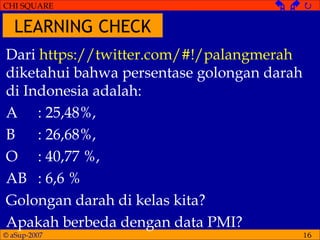
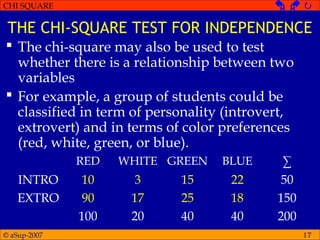
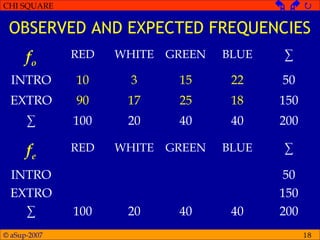
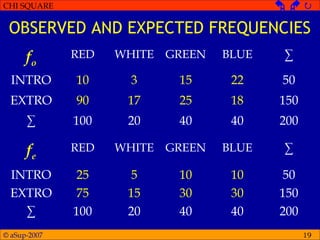
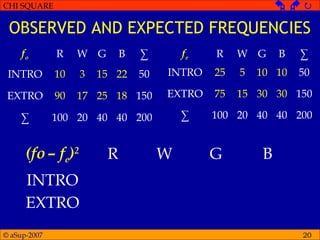
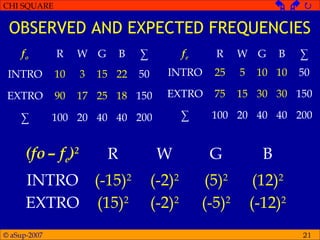
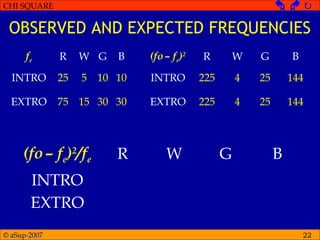
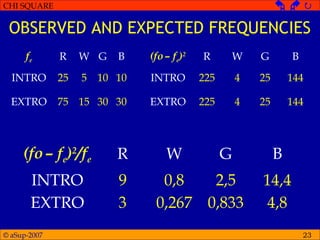

The document provides an overview of chi-square tests, including chi-square tests for goodness of fit and tests of independence. It explains that chi-square tests are used with categorical or classified data rather than numerical data. For a chi-square test of goodness of fit, the null hypothesis specifies the expected proportions in different categories. Observed and expected frequencies are calculated and compared using the chi-square statistic. A chi-square test of independence examines whether two categorical variables are related by comparing observed and expected joint frequencies.


