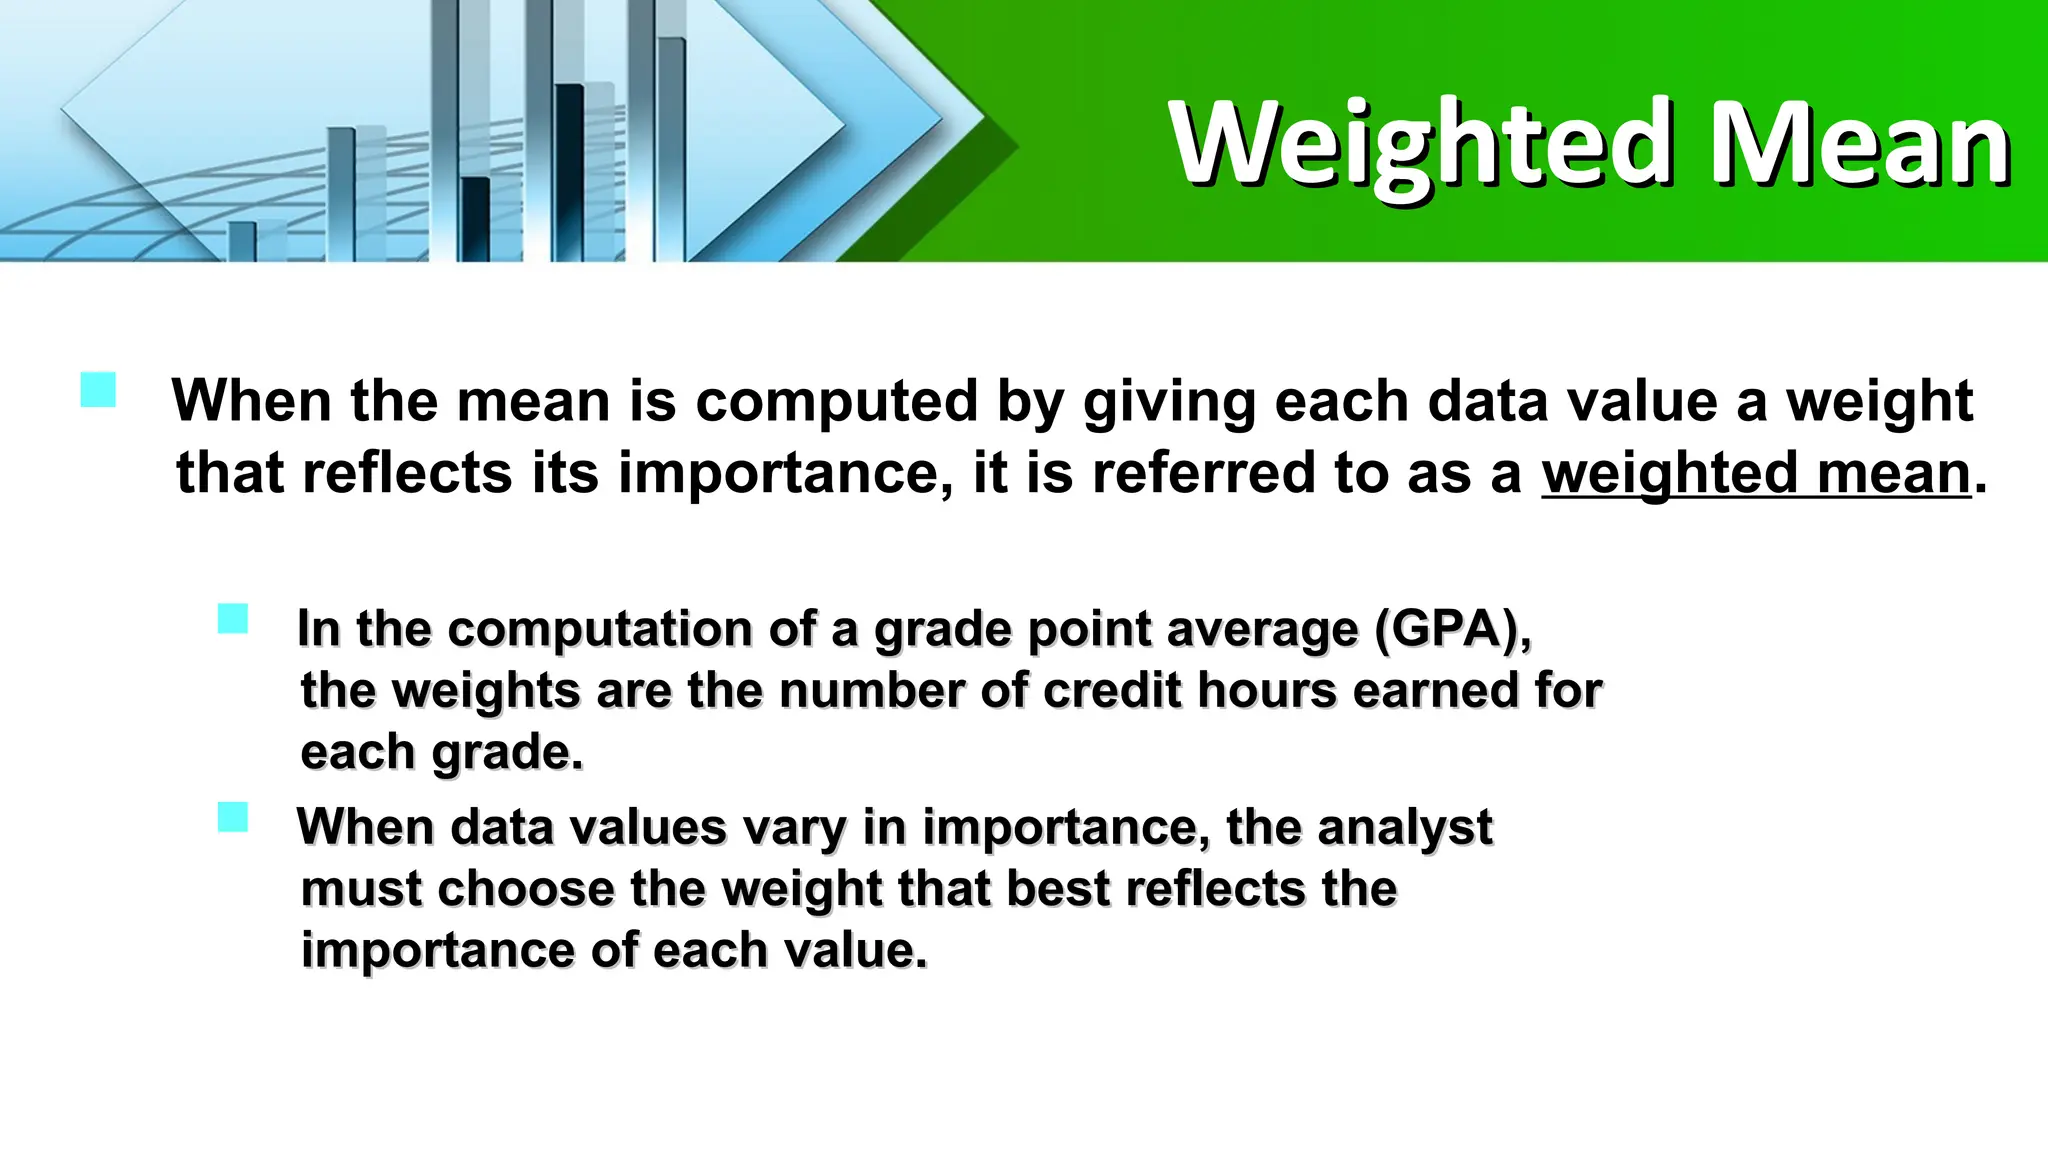
1
MEASURES
OF
CENTRAL TENDENCY
Measures of Central Tendency
• A measure of central tendency is a descriptive statistic
that describes the average, or typical value of a set of
scores
• There are three common measures of central
tendency:
–the mode
–the median
–the mean
2
The Mean
The Mean
3
The arithmetic mean, often called as the mean,
is the most frequently used measure of central
tendency.
The mean is the only common measure in which
all values play an equal role, meaning, to
determine its values you would need to consider
all the values of any given data set.
The Mean
The Mean
4
The mean is appropriate to determine the
central tendency of an interval or ratio data.
The symbol x̄,, called "xbar," is used to
represent the mean of a sample and the symbol
µ, called “mu", is used to denote the mean of a
population.
Properties of Mean
Properties of Mean
5
1.A set of data has only one mean.
2. Mean can be applied for interval and ratio
data.
3. All values in the data set are included in
computing the mean.
Properties of Mean
Properties of Mean
6
4. The mean is very useful in comparing two
or more data sets.
5. Mean is affected by the extreme small or
large values on a data set,
6. Mean is most appropriate in symmetrical
data.
The Mean
The Mean
7
The mean for ungrouped data is obtained by dividing the sum of all values by
the number of values in the data set. Thus,
Mean for population data:
Mean for sample data:
where is the sum of all values; N is the population size; n is the sample
size; is the population mean; and is the sample mean.
N
x



n
x
x


 x
 x
Calculating the Mean
• Calculate the mean of the following data:
1 5 4 3 2
• Sum the scores (X):
1 + 5 + 4 + 3 + 2 = 15
• Divide the sum (X = 15) by the number of scores (N = 5):
15 / 5 = 3
• Mean = X = 3
8
When To Use the Mean
• You should use the mean when
–the data are interval or ratio scaled
• Many people will use the mean with ordinally scaled data
too
–and the data are not skewed
• The mean is preferred because it is sensitive to every score
–If you change one score in the data set, the mean will change
9
The Median
The Median
10
The median is the midpoint of the
data array.
When the data set is ordered,
whether ascending or descending, it is
called a data array.
The Median
The Median
11
Properties of Median
1.The median is unique, there is only one median for
a set of data.
2. The median is found by arranging the set of data
from lowest or highest (or highest to lowest) and
getting the value of the middle observation.
The Median
The Median
12
3. Median is not affected by the extreme small
or large values.
4. Median can be applied for ordinal, interval
and ratio data.
5. Median is most appropriate in a skewed
data.
How To Calculate the Median
• Sort the data from highest to lowest
• Find the score in the middle
–middle = (N + 1) / 2
–If N, the number of scores, is even the
median is the average of the middle two
scores
13
Median Example
Median Example
• What is the median of the following scores:
10 8 14 15 7 3 3 8 12 10 9
• Sort the scores:
15 14 12 10 10 9 8 8 7 3 3
• Determine the middle score:
middle = (N + 1) / 2 = (11 + 1) / 2 = 6
• Middle score = median = 9 14
Median Example
Median Example
• What is the median of the following scores:
24 18 19 42 16 12
• Sort the scores:
42 24 19 18 16 12
• Determine the middle score:
middle = (N + 1) / 2 = (6 + 1) / 2 = 3.5
• Median = average of 3rd
and 4th
scores:
(19 + 18) / 2 = 18.5
15
Median Example
Median Example
Find the median of the ages of 9 middle-
management employees of a certain
company. The ages are 53, 45, 59, 48, 54,
46, 51, 58, and 55.
16
When To Use the Median
• The median is often used when the
distribution of scores is either positively or
negatively skewed
–The few really large scores (positively
skewed) or really small scores (negatively
skewed) will not overly influence the median
17
The Mode
•The mode is the
score that occurs
most frequently
in a set of data 0
1
2
3
4
5
6
75 80 85 90 95
Score on Exam 1
Fre
q
u
e
n
c
y
18
The Mode
0
1
2
3
4
5
6
75 80 85 90 95
Score on Exam 1
Fre
q
u
e
n
c
y
19
Like the median
and unlike the
mean, extreme
values in a data set
do not affect the
mode.
Bimodal
Distributions
•When a
distribution has
two “modes,” it
is called bimodal
0
1
2
3
4
5
6
75 80 85 90 95
Score on Exam 1
Frequency
20
Multimodal
Distributions
• If a distribution
has more than 2
“modes,” it is
called multimodal 0
1
2
3
4
5
6
75 80 85 90 95
Score on Exam 1
F
re
q
u
e
n
c
y
21
There are some cases when a data set
values have the same number
frequency. When this occurs, the
data set is said to be no mode.
22
23
The following data represent the total
unit sales for Smartphones from a
sample of 10 Communication Centers for
the month of August: 15, 17, 10, 12, 13,
10, 14, 10,8, and 9. Find the mode,
Example of Mode
Example of Mode
24
25
When To Use the Mode
• The mode is not a very useful measure of central tendency
–It is insensitive to large changes in the data set
• That is, two data sets that are very different from each other can have
the same mode
26
0
1
2
3
4
5
6
7
1 2 3 4 5 6 7 8 9 10
0
20
40
60
80
100
120
10 20 30 40 50 60 70 80 90 100
When To Use the Mode
• The mode is primarily used with nominally
scaled data
–It is the only measure of central tendency
that is appropriate for nominally scaled
data
27
Relations Between the
Measures of Central Tendency
• In symmetrical distributions, the
median and mean are equal
– For normal distributions, mean =
median = mode
• In positively skewed distributions,
the mean is greater than the
median
28
In negatively skewed
distributions, the mean is smaller
than the median
Weighted Mean
Weighted Mean
 When the mean is computed by giving each data value a weight
that reflects its importance, it is referred to as a weighted mean.
 In the computation of a grade point average (GPA),
In the computation of a grade point average (GPA),
the weights are the number of credit hours earned for
each grade.
each grade.
 When data values vary in importance, the analyst
When data values vary in importance, the analyst
must choose the weight that best reflects the
importance of each value.
When the mean is computed by
giving each data value a weight
that reflects its importance, it is
referred to as a weighted mean
30
Weighted Mean
Weighted Mean
31
In the computation of a grade point
average (GPA), the weights are the
number of credit hours earned for
each grade.
32
Weighted Mean
Weighted Mean
When data values vary in
importance, the analyst must
choose the weight that best
reflects the importance of each
value.
33
Weighted Mean
Weighted Mean
34
Weighted Mean Example

Measures of Central Tendency (mean, median, mode).ppt

  • 1.
  • 2.
    Measures of CentralTendency Measures of Central Tendency • A measure of central tendency is a descriptive statistic that describes the average, or typical value of a set of scores • There are three common measures of central tendency: –the mode –the median –the mean 2
  • 3.
    The Mean The Mean 3 Thearithmetic mean, often called as the mean, is the most frequently used measure of central tendency. The mean is the only common measure in which all values play an equal role, meaning, to determine its values you would need to consider all the values of any given data set.
  • 4.
    The Mean The Mean 4 Themean is appropriate to determine the central tendency of an interval or ratio data. The symbol x̄,, called "xbar," is used to represent the mean of a sample and the symbol µ, called “mu", is used to denote the mean of a population.
  • 5.
    Properties of Mean Propertiesof Mean 5 1.A set of data has only one mean. 2. Mean can be applied for interval and ratio data. 3. All values in the data set are included in computing the mean.
  • 6.
    Properties of Mean Propertiesof Mean 6 4. The mean is very useful in comparing two or more data sets. 5. Mean is affected by the extreme small or large values on a data set, 6. Mean is most appropriate in symmetrical data.
  • 7.
    The Mean The Mean 7 Themean for ungrouped data is obtained by dividing the sum of all values by the number of values in the data set. Thus, Mean for population data: Mean for sample data: where is the sum of all values; N is the population size; n is the sample size; is the population mean; and is the sample mean. N x    n x x    x  x
  • 8.
    Calculating the Mean Calculatingthe Mean • Calculate the mean of the following data: 1 5 4 3 2 • Sum the scores (X): 1 + 5 + 4 + 3 + 2 = 15 • Divide the sum (X = 15) by the number of scores (N = 5): 15 / 5 = 3 • Mean = X = 3 8
  • 9.
    When To Usethe Mean When To Use the Mean • You should use the mean when –the data are interval or ratio scaled • Many people will use the mean with ordinally scaled data too –and the data are not skewed • The mean is preferred because it is sensitive to every score –If you change one score in the data set, the mean will change 9
  • 10.
    The Median The Median 10 Themedian is the midpoint of the data array. When the data set is ordered, whether ascending or descending, it is called a data array.
  • 11.
    The Median The Median 11 Propertiesof Median 1.The median is unique, there is only one median for a set of data. 2. The median is found by arranging the set of data from lowest or highest (or highest to lowest) and getting the value of the middle observation.
  • 12.
    The Median The Median 12 3.Median is not affected by the extreme small or large values. 4. Median can be applied for ordinal, interval and ratio data. 5. Median is most appropriate in a skewed data.
  • 13.
    How To Calculatethe Median How To Calculate the Median • Sort the data from highest to lowest • Find the score in the middle –middle = (N + 1) / 2 –If N, the number of scores, is even the median is the average of the middle two scores 13
  • 14.
    Median Example Median Example •What is the median of the following scores: 10 8 14 15 7 3 3 8 12 10 9 • Sort the scores: 15 14 12 10 10 9 8 8 7 3 3 • Determine the middle score: middle = (N + 1) / 2 = (11 + 1) / 2 = 6 • Middle score = median = 9 14
  • 15.
    Median Example Median Example •What is the median of the following scores: 24 18 19 42 16 12 • Sort the scores: 42 24 19 18 16 12 • Determine the middle score: middle = (N + 1) / 2 = (6 + 1) / 2 = 3.5 • Median = average of 3rd and 4th scores: (19 + 18) / 2 = 18.5 15
  • 16.
    Median Example Median Example Findthe median of the ages of 9 middle- management employees of a certain company. The ages are 53, 45, 59, 48, 54, 46, 51, 58, and 55. 16
  • 17.
    When To Usethe Median When To Use the Median • The median is often used when the distribution of scores is either positively or negatively skewed –The few really large scores (positively skewed) or really small scores (negatively skewed) will not overly influence the median 17
  • 18.
    The Mode •The modeis the score that occurs most frequently in a set of data 0 1 2 3 4 5 6 75 80 85 90 95 Score on Exam 1 Fre q u e n c y 18
  • 19.
    The Mode 0 1 2 3 4 5 6 75 8085 90 95 Score on Exam 1 Fre q u e n c y 19 Like the median and unlike the mean, extreme values in a data set do not affect the mode.
  • 20.
    Bimodal Distributions •When a distribution has two“modes,” it is called bimodal 0 1 2 3 4 5 6 75 80 85 90 95 Score on Exam 1 Frequency 20
  • 21.
    Multimodal Distributions • If adistribution has more than 2 “modes,” it is called multimodal 0 1 2 3 4 5 6 75 80 85 90 95 Score on Exam 1 F re q u e n c y 21
  • 22.
    There are somecases when a data set values have the same number frequency. When this occurs, the data set is said to be no mode. 22
  • 23.
    23 The following datarepresent the total unit sales for Smartphones from a sample of 10 Communication Centers for the month of August: 15, 17, 10, 12, 13, 10, 14, 10,8, and 9. Find the mode, Example of Mode Example of Mode
  • 24.
  • 25.
  • 26.
    When To Usethe Mode When To Use the Mode • The mode is not a very useful measure of central tendency –It is insensitive to large changes in the data set • That is, two data sets that are very different from each other can have the same mode 26 0 1 2 3 4 5 6 7 1 2 3 4 5 6 7 8 9 10 0 20 40 60 80 100 120 10 20 30 40 50 60 70 80 90 100
  • 27.
    When To Usethe Mode When To Use the Mode • The mode is primarily used with nominally scaled data –It is the only measure of central tendency that is appropriate for nominally scaled data 27
  • 28.
    Relations Between the RelationsBetween the Measures of Central Tendency Measures of Central Tendency • In symmetrical distributions, the median and mean are equal – For normal distributions, mean = median = mode • In positively skewed distributions, the mean is greater than the median 28 In negatively skewed distributions, the mean is smaller than the median
  • 29.
    Weighted Mean Weighted Mean When the mean is computed by giving each data value a weight that reflects its importance, it is referred to as a weighted mean.  In the computation of a grade point average (GPA), In the computation of a grade point average (GPA), the weights are the number of credit hours earned for the weights are the number of credit hours earned for each grade. each grade.  When data values vary in importance, the analyst When data values vary in importance, the analyst must choose the weight that best reflects the must choose the weight that best reflects the importance of each value. importance of each value.
  • 30.
    When the meanis computed by giving each data value a weight that reflects its importance, it is referred to as a weighted mean 30 Weighted Mean Weighted Mean
  • 31.
  • 32.
    In the computationof a grade point average (GPA), the weights are the number of credit hours earned for each grade. 32 Weighted Mean Weighted Mean
  • 33.
    When data valuesvary in importance, the analyst must choose the weight that best reflects the importance of each value. 33 Weighted Mean Weighted Mean
  • 34.