The PPT describes the Measures of Central Tendency in detail such as Mean, Median, Mode, Percentile, Quartile, Arthemetic mean. Measures of Variability: Range, Mean Absolute deviation, Standard Deviation, Z-Score, Variance, Coefficient of Variance as well as Measures of Shape such as kurtosis and skewness in the grouped and normal data.
The present power point presentation explains the following concepts such as organization, organisation, organisational structure, definition, factors affecting organizational structure, departmentalisation, span of management, centralisation, decentralisation, delegation of authority, methods, function, process, product, customers, territory, centralization, decentralization, departmentalization
The present power point presentation explains the concepts of organisation, organisational structure, definition, types of organizational structure, line organization, functional organization, Line and staff organization, Matrix organization, Committee organization, Advantages, Disadvantages
The present ppt explains the concept of motivation, Features and significance of motivation, Process of motivation and theories of motivation such as Maslow's need hierarchy theory, Herzberg hygiene theory, McCellend Theory, ERG Theory, Vroom Expectany theory, Carrot and Stick Theory, Theory X and Theory Y, Theory Z
The PPT covered the distinguish between discrete and continuous distribution. Detailed explanation of the types of discrete distributions such as binomial distribution, Poisson distribution & Hyper-geometric distribution.
Taurus Zodiac Sign_ Personality Traits and Sign Dates.pptxmy Pandit
Explore the world of the Taurus zodiac sign. Learn about their stability, determination, and appreciation for beauty. Discover how Taureans' grounded nature and hardworking mindset define their unique personality.
Falcon stands out as a top-tier P2P Invoice Discounting platform in India, bridging esteemed blue-chip companies and eager investors. Our goal is to transform the investment landscape in India by establishing a comprehensive destination for borrowers and investors with diverse profiles and needs, all while minimizing risk. What sets Falcon apart is the elimination of intermediaries such as commercial banks and depository institutions, allowing investors to enjoy higher yields.
Skye Residences | Extended Stay Residences Near Toronto Airportmarketingjdass
Experience unparalleled EXTENDED STAY and comfort at Skye Residences located just minutes from Toronto Airport. Discover sophisticated accommodations tailored for discerning travelers.
Website Link :
https://skyeresidences.com/
https://skyeresidences.com/about-us/
https://skyeresidences.com/gallery/
https://skyeresidences.com/rooms/
https://skyeresidences.com/near-by-attractions/
https://skyeresidences.com/commute/
https://skyeresidences.com/contact/
https://skyeresidences.com/queen-suite-with-sofa-bed/
https://skyeresidences.com/queen-suite-with-sofa-bed-and-balcony/
https://skyeresidences.com/queen-suite-with-sofa-bed-accessible/
https://skyeresidences.com/2-bedroom-deluxe-queen-suite-with-sofa-bed/
https://skyeresidences.com/2-bedroom-deluxe-king-queen-suite-with-sofa-bed/
https://skyeresidences.com/2-bedroom-deluxe-queen-suite-with-sofa-bed-accessible/
#Skye Residences Etobicoke, #Skye Residences Near Toronto Airport, #Skye Residences Toronto, #Skye Hotel Toronto, #Skye Hotel Near Toronto Airport, #Hotel Near Toronto Airport, #Near Toronto Airport Accommodation, #Suites Near Toronto Airport, #Etobicoke Suites Near Airport, #Hotel Near Toronto Pearson International Airport, #Toronto Airport Suite Rentals, #Pearson Airport Hotel Suites
Explore our most comprehensive guide on lookback analysis at SafePaaS, covering access governance and how it can transform modern ERP audits. Browse now!
India Orthopedic Devices Market: Unlocking Growth Secrets, Trends and Develop...Kumar Satyam
According to TechSci Research report, “India Orthopedic Devices Market -Industry Size, Share, Trends, Competition Forecast & Opportunities, 2030”, the India Orthopedic Devices Market stood at USD 1,280.54 Million in 2024 and is anticipated to grow with a CAGR of 7.84% in the forecast period, 2026-2030F. The India Orthopedic Devices Market is being driven by several factors. The most prominent ones include an increase in the elderly population, who are more prone to orthopedic conditions such as osteoporosis and arthritis. Moreover, the rise in sports injuries and road accidents are also contributing to the demand for orthopedic devices. Advances in technology and the introduction of innovative implants and prosthetics have further propelled the market growth. Additionally, government initiatives aimed at improving healthcare infrastructure and the increasing prevalence of lifestyle diseases have led to an upward trend in orthopedic surgeries, thereby fueling the market demand for these devices.
Affordable Stationery Printing Services in Jaipur | Navpack n PrintNavpack & Print
Looking for professional printing services in Jaipur? Navpack n Print offers high-quality and affordable stationery printing for all your business needs. Stand out with custom stationery designs and fast turnaround times. Contact us today for a quote!
[Note: This is a partial preview. To download this presentation, visit:
https://www.oeconsulting.com.sg/training-presentations]
Sustainability has become an increasingly critical topic as the world recognizes the need to protect our planet and its resources for future generations. Sustainability means meeting our current needs without compromising the ability of future generations to meet theirs. It involves long-term planning and consideration of the consequences of our actions. The goal is to create strategies that ensure the long-term viability of People, Planet, and Profit.
Leading companies such as Nike, Toyota, and Siemens are prioritizing sustainable innovation in their business models, setting an example for others to follow. In this Sustainability training presentation, you will learn key concepts, principles, and practices of sustainability applicable across industries. This training aims to create awareness and educate employees, senior executives, consultants, and other key stakeholders, including investors, policymakers, and supply chain partners, on the importance and implementation of sustainability.
LEARNING OBJECTIVES
1. Develop a comprehensive understanding of the fundamental principles and concepts that form the foundation of sustainability within corporate environments.
2. Explore the sustainability implementation model, focusing on effective measures and reporting strategies to track and communicate sustainability efforts.
3. Identify and define best practices and critical success factors essential for achieving sustainability goals within organizations.
CONTENTS
1. Introduction and Key Concepts of Sustainability
2. Principles and Practices of Sustainability
3. Measures and Reporting in Sustainability
4. Sustainability Implementation & Best Practices
To download the complete presentation, visit: https://www.oeconsulting.com.sg/training-presentations
Remote sensing and monitoring are changing the mining industry for the better. These are providing innovative solutions to long-standing challenges. Those related to exploration, extraction, and overall environmental management by mining technology companies Odisha. These technologies make use of satellite imaging, aerial photography and sensors to collect data that might be inaccessible or from hazardous locations. With the use of this technology, mining operations are becoming increasingly efficient. Let us gain more insight into the key aspects associated with remote sensing and monitoring when it comes to mining.
Business Valuation Principles for EntrepreneursBen Wann
This insightful presentation is designed to equip entrepreneurs with the essential knowledge and tools needed to accurately value their businesses. Understanding business valuation is crucial for making informed decisions, whether you're seeking investment, planning to sell, or simply want to gauge your company's worth.
Attending a job Interview for B1 and B2 Englsih learnersErika906060
It is a sample of an interview for a business english class for pre-intermediate and intermediate english students with emphasis on the speking ability.
Discover the innovative and creative projects that highlight my journey throu...dylandmeas
Discover the innovative and creative projects that highlight my journey through Full Sail University. Below, you’ll find a collection of my work showcasing my skills and expertise in digital marketing, event planning, and media production.
"𝑩𝑬𝑮𝑼𝑵 𝑾𝑰𝑻𝑯 𝑻𝑱 𝑰𝑺 𝑯𝑨𝑳𝑭 𝑫𝑶𝑵𝑬"
𝐓𝐉 𝐂𝐨𝐦𝐬 (𝐓𝐉 𝐂𝐨𝐦𝐦𝐮𝐧𝐢𝐜𝐚𝐭𝐢𝐨𝐧𝐬) is a professional event agency that includes experts in the event-organizing market in Vietnam, Korea, and ASEAN countries. We provide unlimited types of events from Music concerts, Fan meetings, and Culture festivals to Corporate events, Internal company events, Golf tournaments, MICE events, and Exhibitions.
𝐓𝐉 𝐂𝐨𝐦𝐬 provides unlimited package services including such as Event organizing, Event planning, Event production, Manpower, PR marketing, Design 2D/3D, VIP protocols, Interpreter agency, etc.
Sports events - Golf competitions/billiards competitions/company sports events: dynamic and challenging
⭐ 𝐅𝐞𝐚𝐭𝐮𝐫𝐞𝐝 𝐩𝐫𝐨𝐣𝐞𝐜𝐭𝐬:
➢ 2024 BAEKHYUN [Lonsdaleite] IN HO CHI MINH
➢ SUPER JUNIOR-L.S.S. THE SHOW : Th3ee Guys in HO CHI MINH
➢FreenBecky 1st Fan Meeting in Vietnam
➢CHILDREN ART EXHIBITION 2024: BEYOND BARRIERS
➢ WOW K-Music Festival 2023
➢ Winner [CROSS] Tour in HCM
➢ Super Show 9 in HCM with Super Junior
➢ HCMC - Gyeongsangbuk-do Culture and Tourism Festival
➢ Korean Vietnam Partnership - Fair with LG
➢ Korean President visits Samsung Electronics R&D Center
➢ Vietnam Food Expo with Lotte Wellfood
"𝐄𝐯𝐞𝐫𝐲 𝐞𝐯𝐞𝐧𝐭 𝐢𝐬 𝐚 𝐬𝐭𝐨𝐫𝐲, 𝐚 𝐬𝐩𝐞𝐜𝐢𝐚𝐥 𝐣𝐨𝐮𝐫𝐧𝐞𝐲. 𝐖𝐞 𝐚𝐥𝐰𝐚𝐲𝐬 𝐛𝐞𝐥𝐢𝐞𝐯𝐞 𝐭𝐡𝐚𝐭 𝐬𝐡𝐨𝐫𝐭𝐥𝐲 𝐲𝐨𝐮 𝐰𝐢𝐥𝐥 𝐛𝐞 𝐚 𝐩𝐚𝐫𝐭 𝐨𝐟 𝐨𝐮𝐫 𝐬𝐭𝐨𝐫𝐢𝐞𝐬."
Unveiling the Secrets How Does Generative AI Work.pdfSam H
At its core, generative artificial intelligence relies on the concept of generative models, which serve as engines that churn out entirely new data resembling their training data. It is like a sculptor who has studied so many forms found in nature and then uses this knowledge to create sculptures from his imagination that have never been seen before anywhere else. If taken to cyberspace, gans work almost the same way.
2. Learning Objectives
Measures of Central Tendency
Measures of Variability
Measures of Central Tendency and Variability : Grouped Data
Measures of Shape
3. Measures of Central
Tendency
◦ Measures of Central Tendency yield information about “Particular places
or locations in a group of numbers.”
◦ Measures of Central Tendency can yield information as the average offer
price, the middle offer price and the most frequently occurring offer
price.
◦ Common measures of central tendency :-
Mean, Mode, Median, Percentiles, Quartiles.
4. Mode
◦ Mode is the most frequently occurring value in a set of data.
◦ Mode is applicable to all levels of data measurement (Nominal, Ordinal,
Ratio, Interval).
◦ Mode can be used to determine what categories occurs most frequently.
◦ When there is tie for the most frequently occurring value, two modes are
listed, then the data are said to be Bimodal.
◦ Data sets with more than two modes are referred to as Multimodal.
5. Example of Mode
7 11 14 15 15
15.5 19 19 19 19
21 22 23 24 25
27 27 28 34 43
This table makes it easier to see that 19 is the most frequently
occurring number(4 Times). So Here Mode is 19.
Table 1:
6. Median
◦ Median is the middle value in an ordered array of numbers.
◦ For an array with an odd number of terms, the median is the middle
number.
◦ For an array with an even number of terms, the median is the average of
the two middle numbers.
◦ Steps used to determine the median.
Step 1. Arrange the observations in an ordered data array.
Step 2. For an odd number of terms, find the middle term of the
ordered array. It is the median.
Step 3. For an even number of terms, find the average of the middle
two terms. This is the median.
7. Example of Median
Suppose a business researcher wants to determine the median for the
following numbers.
15 11 14 3 21 17 22 16 19 16 5 7 19 8 9 20 4
Step 1: Now the researcher arranges the numbers in an ordered array.
3 4 5 7 8 9 11 14 15 16 16 17 19 19 20 21 22
Now the array contains 17 terms (odd number of terms), the Median is middle
number, i.e. 15.
If one number (for ex. Number 22) is eliminated from the list the array would
contain only 16 terms.
3 4 5 7 8 9 11 14 15 16 16 17 19 19 20 21
Now, for an even number of terms, the median is determined by averaging the
2 middle values, 14 and 15. The resulting MEDIAN value is 14.5.
8. ARITHMETIC MEAN
◦ Arithmetic mean is the average of a group of numbers
◦ Arithmetic mean is applicable for interval and ratio data.
◦ Arithmetic mean is affected by each value in the data set, including
extreme values
◦ The arithmetic mean is computed by summing all numbers and dividing
by the number of numbers.
9. Example of Mean
Suppose a company has 5 departments with 24,13,19,26 and 11 workers each.
Compute the population mean number of workers.
Solution :-
Step 1. We will add all the workers of each department.
24+13+19+26+11 = 93
Step 2. We will divide total no. of workers by total no. of departments.
93/5 = 18.6
Step 3. Hence, the Population Mean number of workers in each department is
18.6 workers.
10. Percentiles
◦ Percentiles are measures of central tendency that divide a group
of data into 100 parts.
◦ The nth percentile is the value such that at least n% of the data
are below that value and at most (100 – n) % are above that
value.
◦ Example – 87th percentile indicates that at least 87% of the data
are below the value and no more that 13% are above the value.
◦ Percentiles are widely used in reporting test results.
11. Steps in determining the
location of a percentile
Step 1. Organize the numbers into ascending – order array.
Step 2. Calculate the percentile location(i) by:
(i) = P/100*(N)
where
P = the percentile of interest
i = percentile location
N = number in the data set
Step 3. Determine the location by either (a) or (b).
a. If I is a whole number, the Pth percentile is the average of the value at the ith
location and the value at the (i + 1)st location.
b. If I is not a whole number, the Pth percentile value is located at the whole number
part of i + 1.
12. Example of Percentiles
◦ Suppose you want to determine the 80th percentile of 1240 numbers.
◦ So, P is 80 and N is 1240. First, order the numbers from lowest to
highest.
◦ Next, calculate the location of the 80th percentile.
i = 80/100 * (1240) = 992
◦ So i = 992 is a whole number, the 80th percentile is the average of 992nd
number and 993rd number.
P80 = (992nd number = 993rd number) /
13. Quartiles
◦ Quartiles are the measures of central tendency that divide a group of data into
four subgroups or parts.
◦ The three quartiles are denoted as Q1, Q2 and Q3.
◦ The first quartile Q1, separates the first or lowest, one-fourth of the data
from the upper three-fourths and is equal to the 25th percentile.
◦ The second quartile Q2, separates the second quarter of the data from the
third quartile, Q2 is located at the 50th percentile and equals to the median of
the data.
◦ The third quartile Q3, divides the first three-quarters of the data from the last
quarter and is equal to the value of 75th percentile.
14. Measures of Variability :
Ungrouped Data
◦ Measures of variability describe the spread or the dispersion of a set of
data.
◦ Using measures of variability with measures of central tendency makes
possible a more complete numerical description of the data.
◦ Different measures of variability :-
I. Range
II. Mean absolute deviation
III. Variance
IV. Standard deviation
V. Z score
VI. Coefficient of variation
15. Range
◦ Range is the difference between the largest value of a data set and the
smallest value of a set.
◦ It describes the distance to the outer bounds of data set.
◦ It is easy to compute and affected by the extreme values.
◦ Interquartile Range :- It is the range of values between the first and
third quartile.
RANGE = Highest value – Lowest value
INTERQUARTILE RANGE = Q3 – Q1
16. Mean Absolute Deviation
◦ Mean absolute deviation is the average of the absolute values of the
deviations around the mean for a set of numbers.
◦ Subtracting the mean from each value of data yields the deviation from
the mean (X - µ).
◦ Mean Deviation = Σ|x − μ|
N
17. Example of Mean Absolute
Deviation
M A D
X
N
. . .
.
24
5
4 8
5
9
16
17
18
-8
-4
+3
+4
+5
0
+8
+4
+3
+4
+5
24
X X X
18. Variance
◦ Variance is the average of the squared deviations about the arithmetic
mean for a set of numbers.
◦ The population variance is denoted by σ2
◦ Formula :-
19. Standard Deviation
◦ Standard deviation is the square root of variance.
◦ Standard deviation was given by Karl Pearson in 1893.
◦ Standard deviation is the most popular and useful measure of variability.
◦ Median and Mode is not considered while computing standard deviation.
◦ The standard deviation is represented by the Greek letter 𝝈(sigma).
21. Z- Scores
◦ A z-score represents the number of standard deviations a value (x) is above
or below the mean of a set of numbers when the data are normally
distributed.
◦ Z scores allows translation of a value’s raw distance from the mean into units
of standard deviations.
◦ Z = (x-µ)/σ
22. Z-Scores
◦ If Z is negative, the raw value (x) is below the mean
◦ If Z is positive, the raw value (x) is above the mean
◦ Between
◦ Z = + 1, are approximately 68% of the values
◦ Z = + 2, are approximately 95% of the values
◦ Z = + 3, are approximately 99% of the values
23. Coefficient of Variation
◦ The coefficient of variation is the ratio of the standard deviation to the
mean expressed in percentage.
◦ The coefficient of variation is a relative comparison of a standard
deviation to its mean.
◦ The coefficient of variation can be useful in comparing standard
deviations that have been computed from data with different means.
◦ Coefficient of variation :- C V. .
100
24. Measures of Central
Tendency and Variability:
Grouped Data
Measures of Central Tendency
◦ Mean
◦ Median
◦ Mode
Measures of Variability
◦ Variance
◦ Standard Deviation
25. Measures of Central
Tendency: Grouped Data
MEAN
◦ For mean with grouped data the midpoint of each class interval is used
to represent all the values in a class interval.
◦ Midpoint is weighted by the frequency of values in the class interval.
◦ Mean is computed by summing the products of class midpoint, and the
class frequency for each class and dividing that sum by the total
number of frequencies.
27. Measures of Central
Tendency: Grouped Data
MEDIAN
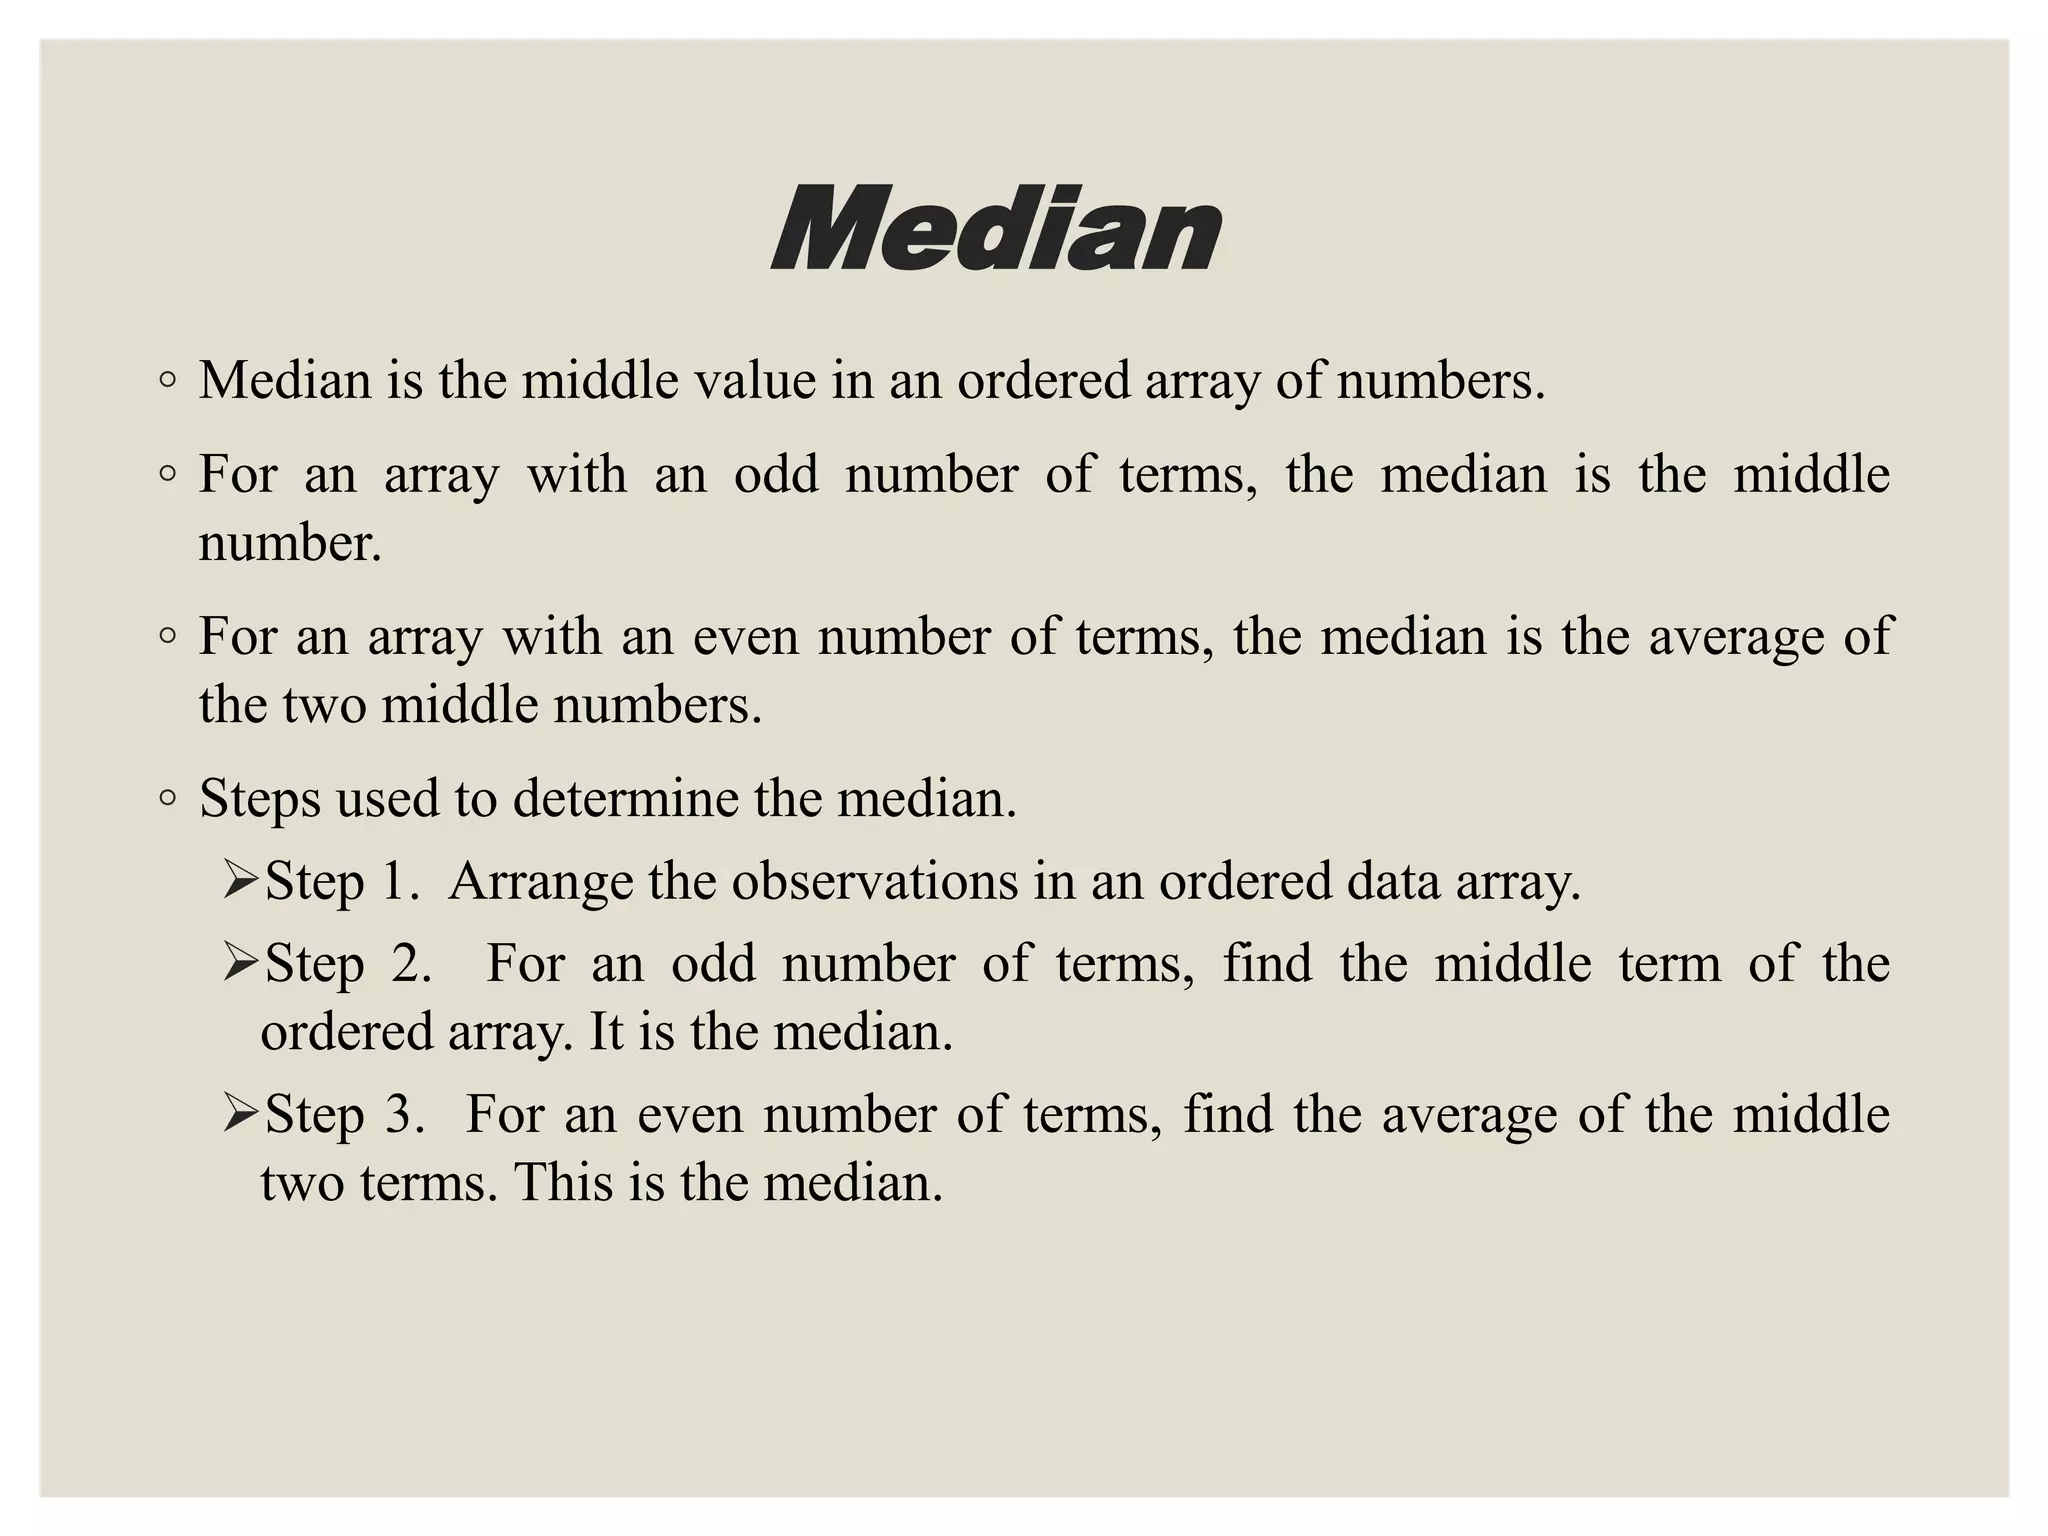
◦ The median for grouped data is the middle value of an ordered array of
numbers.
◦ Formula to calculate median for grouped data :
M=L+[ (N/2–F)/f ]C
Where,
L means lower boundary of the median class
N means sum of frequencies
F means cumulative frequency before the median class.
f means frequency of the median class
C means the size of the median class
29. Measures of Central
Tendency: Grouped Data
MODE
◦ Mode for the grouped data is the class midpoint of the modal class.
◦ The modal class is the class interval with the greatest frequency.
30. Mode of Grouped Data
Class Interval Frequency
20-under 30 6
30-under 40 18
40-under 50 11
50-under 60 11
60-under 70 3
70-under 80 1
Mode
30 40
2
35
31. Variance and Standard
Deviation Of Grouped Data
2
2
2
f
N
M 2
2
2
1S
M X
S
f
n
S
Population Sample
32. MEASURES OF SHAPE
Measures of shape are tools that can be used to describe the shape of a
distribution of data.
Measures of shape
◦ Skewness
◦ kurtosis
33. Skewness
◦ Skewness is when a distribution is asymmetrical or lacks symmetry.
◦ Symmetrical – A distribution of data in which the right half is a mirror
image of the left half is said to be symmetrical.
◦ The concept of skewness helps to understand the relationship of the
mean, median and mode.
34. Coefficient of Skewness
◦ Coefficient of Skewness (Sk) - compares the mean
and median in light of the magnitude to the standard deviation; Md is
the median; Sk is coefficient of skewness; σ is the Standard deviation.
dM
Sk
3
36. Kurtosis
◦ Kurtosis describes the amount of peakedness of a distribution.
◦ Distributions that are high and thin are referred as Leptokurtic
distributions.
◦ Distributions that are flat and spread out are referred as Platykurtic
distributions.
◦ Distributions that are normal in shape are referred as Mesokurtic
distributions.