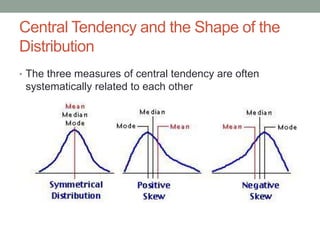
CENTRAL TENDENCY
Behavioral Statistics
Summer 2017
Dr. Germano
What is Central Tendency?
• A statistical measure that determines a single value that
accurately describes the center of a distribution
• Conceptually, an average — or representative — score
• Why is Central Tendency useful?
• Can summarize or condense a large set of data into a single value
• A descriptive statistic
• Can compare two (or more) sets of data
• e.g., weather data
Average
Temperature
Average
Precipitation
New York City 55° 42”
Austin 69° 29”
San Francisco 57° 22”
Seattle 53° 34”
How Do We Determine Central Tendency?
No single measure determines a central, representative
value in every situation
What would be the most representative score?
The Mean The ModeThe Median
The Mean (a.k.a. the “average”)
• The sum of scores (ƩX) in a distribution divided by the
number of scores (n or N)
• The amount every individual would get if the total was
distributed equally among everyone
• The balance point for a distribution
Population Mean (μ) Sample Mean (M or )X
N
X M =
Xå
n
The Weighted Mean
• What if I have two samples from the same population?
• Sample 1: n = 6, M = 10
• Sample 2: n = 50, M = 20
• Simply take an average of the two means?
Average mean =
10 + 20
2
30
2= = 15
• What are we not taking into account if we average means
this way?
n (sample size)
The Weighted Mean
• If you have two samples of different sizes, you would want
to “weight” your statistic by the amount of information (n)
provided
Overall Mean = Mweighted =
ΣX (overall sum for the combined group)
n (total number in the combined group)
Mweighted =
ΣX1 + ΣX2
n1 + n2
Mweighted =
60 + 1000
6 + 50
1060
56
= = 18.93
Sample 1: n = 6, M = 10
Sample 2: n = 50, M = 20
The Weighted Mean
When Sample 1: n = 6, M = 10
and Sample 2: n = 50, M = 20
Averaged Mean
15
Weighted Mean
18.93
How does sample size affect the resulting statistic?
The larger sample makes a larger contribution to the total group;
thus, it carries more weight in determining the overall mean
Characteristics of the Mean
Computed by ΣX and n (or N)
• ΣX is computed by summing all scores
• Therefore, adding or removing any individual score will
typically change the value of the mean, since both values
in the formula will change
When is this not the case?
When the value added or subtracted is equal to the mean
What happens when…
• We add a value larger than
the mean?
• We add a value smaller than
the mean?
• We remove a value larger
than the mean?
• We add twenty scores equal
to the mean?
What happens when…
• We add a value larger than
the mean?
• We add a value smaller than
the mean?
• We remove a value larger
than the mean?
• We add twenty scores equal
to the mean?
• Mean increases
• Mean decreases
• Mean decreases
• The mean remains the
same
What happens when…
• We change consistently every score in the
distribution?
X = 1, 2, 3, 3, 1 M = 2
Subtract a constant (2) from every score
X = -1, 0, 1, 1, -1 M = 0
What happens when…
• We change consistently every score in the
distribution?
X = 1, 2, 3, 3, 1 M = 2
Subtract a constant (2) from every score
X = -1, 0, 1, 1, -1 M = 0
The mean is reduced by the same number
(2 – 2 = 0)
What happens when…
• We change consistently every score in the
distribution?
X = 1, 2, 3, 3, 1 M = 2
Add a constant (1) to every score
X = -2, 3, 4, 4, 2 M = 3
What happens when…
• We change consistently every score in the
distribution?
X = 1, 2, 3, 3, 1 M = 2
Add a constant (1) to every score
X = -2, 3, 4, 4, 2 M = 3
The mean is increased by the same number
(2 + 1 = 3)
What happens when…
• We change consistently every score in the
distribution?
X = 1, 2, 3, 3, 1 M = 2
Divide every score by a constant (2)
X = 0.5, 1, 1.5, 1.5, 0.5 M = 1
What happens when…
• We change consistently every score in the
distribution?
X = 1, 2, 3, 3, 1 M = 2
Divide every score by a constant (2)
X = 0.5, 1, 1.5, 1.5, 0.5 M = 1
The mean must also be divided by the constant
(2 ÷ 2 = 1)
What happens when…
• We change consistently every score in the
distribution?
X = 1, 2, 3, 3, 1 M = 2
Multiply every score by a constant (2)
X = 2, 4, 6, 6, 2 M = 4
What happens when…
• We change consistently every score in the
distribution?
X = 1, 2, 3, 3, 1 M = 2
Multiply every score by a constant (2)
X = 2, 4, 6, 6, 2 M = 4
The mean must also be multiplied by the constant
(2 × 2 = 4)
When the Mean Won’t Work
• When a distribution is very skewed (outliers), the mean
will be pulled toward the extremes
• The mean does not provide a “central” value
• When data is from a nominal scale, it is impossible to
compute a mean
• What is the mean of 1 = male and 2 = female?
• When data is from an ordinal scale, it is usually
inappropriate to compute a mean
• What is the mean of a rank? Alice placed 1st in math; Alfred placed
3rd. Between them, the mean placement was 2.
The Median
• The score that divides a distribution exactly in half
(50th percentile)
• The first score that is greater than 50% of the scores in the distribution
• 50% of individuals in a distribution have scores at or below the median
• Odd number of scores:
• Score in the middle of an ordered distribution
• Even number of scores:
• Mean of the two scores in the middle
of an ordered distribution
3, 5, 8, 10, 11
1, 1, 4, 5, 7, 8
The median
The median
Is the average of the
middle two scores
(4+5)/2 = 9/2 = 4.5
The ‘Precise’ Median
• For continuous variables, a ‘precise’ median can be
determined
• Place the scores in a frequency distribution histogram with each
score represented by a box in the graph
• Then, draw a vertical line through the distribution so that
exactly half the boxes are on each side of the line.
The median is defined by the location of the line.
The Mode
• The score or category that has the greatest frequency (the
most common observation)
• The only measure of central tendency that can be used
with nominal data
• Often a supplemental measure of central tendency
reported along with the mean or the median
• More than one mode:
• Bimodal: A distribution with two
scores with (the same) highest
frequency
• Multimodal: A distribution with
more than two modes
Selecting a Measure of Central Tendency
• Mean is often preferred
• Uses every score and typically gives a good representative value
• Useful in later inferential statistics
• However, there are certain situations in which the mean is unable
to be used or undesirable for use.
Selecting a Measure of Central Tendency
• We use the median for:
• Extreme scores or skewed data – the median is not influenced by
extreme scores
Selecting a Measure of Central Tendency
• We use the median for:
• Extreme scores or skewed data – the median is not influenced by
extreme scores
• Undetermined values (e.g., participant drops out before
completing a task) –we cannot compute a mean with a missing
value
Selecting a Measure of Central Tendency
• We use the median for:
• Extreme scores or skewed data – the median is not influenced by
extreme scores
• Undetermined values (e.g., participant drops out before
completing a task) –we cannot compute a mean with a missing
value
• Open-ended distributions – impossible
to compute a mean because there is
no way to compute ΣX
Number of
Pizzas (X)
f
5 or more 3
4 2
3 2
2 3
1 6
0 4
Selecting a Measure of Central Tendency
• We use the median for:
• Extreme scores or skewed data – the median is not influenced by
extreme scores
• Undetermined values (e.g., participant drops out before
completing a task) –we cannot compute a mean with a missing
value
• Open-ended distributions – impossible
to compute a mean because there is
no way to compute ΣX
• Ordinal data – the median is defined by direction (half of scores
above, half below) and is not defined by distance
Selecting a Measure of Central Tendency
• We use the mode for:
• Nominal data
• Impossible to compute a mean or median
• Discrete variables
• Means and medians produce unrealistic values
“The average family has 2.5 children”
vs.
“The typical family has 3 children”
• Description of the shape of the distribution
• In addition to the mean and the median values
Central Tendency and the Shape of the
Distribution
• The three measures of central tendency are often
systematically related to each other

Central Tendency

  • 1.
  • 2.
    What is CentralTendency? • A statistical measure that determines a single value that accurately describes the center of a distribution • Conceptually, an average — or representative — score • Why is Central Tendency useful? • Can summarize or condense a large set of data into a single value • A descriptive statistic • Can compare two (or more) sets of data • e.g., weather data Average Temperature Average Precipitation New York City 55° 42” Austin 69° 29” San Francisco 57° 22” Seattle 53° 34”
  • 3.
    How Do WeDetermine Central Tendency? No single measure determines a central, representative value in every situation What would be the most representative score? The Mean The ModeThe Median
  • 4.
    The Mean (a.k.a.the “average”) • The sum of scores (ƩX) in a distribution divided by the number of scores (n or N) • The amount every individual would get if the total was distributed equally among everyone • The balance point for a distribution Population Mean (μ) Sample Mean (M or )X N X M = Xå n
  • 5.
    The Weighted Mean •What if I have two samples from the same population? • Sample 1: n = 6, M = 10 • Sample 2: n = 50, M = 20 • Simply take an average of the two means? Average mean = 10 + 20 2 30 2= = 15 • What are we not taking into account if we average means this way? n (sample size)
  • 6.
    The Weighted Mean •If you have two samples of different sizes, you would want to “weight” your statistic by the amount of information (n) provided Overall Mean = Mweighted = ΣX (overall sum for the combined group) n (total number in the combined group) Mweighted = ΣX1 + ΣX2 n1 + n2 Mweighted = 60 + 1000 6 + 50 1060 56 = = 18.93 Sample 1: n = 6, M = 10 Sample 2: n = 50, M = 20
  • 7.
    The Weighted Mean WhenSample 1: n = 6, M = 10 and Sample 2: n = 50, M = 20 Averaged Mean 15 Weighted Mean 18.93 How does sample size affect the resulting statistic? The larger sample makes a larger contribution to the total group; thus, it carries more weight in determining the overall mean
  • 8.
    Characteristics of theMean Computed by ΣX and n (or N) • ΣX is computed by summing all scores • Therefore, adding or removing any individual score will typically change the value of the mean, since both values in the formula will change When is this not the case? When the value added or subtracted is equal to the mean
  • 9.
    What happens when… •We add a value larger than the mean? • We add a value smaller than the mean? • We remove a value larger than the mean? • We add twenty scores equal to the mean?
  • 10.
    What happens when… •We add a value larger than the mean? • We add a value smaller than the mean? • We remove a value larger than the mean? • We add twenty scores equal to the mean? • Mean increases • Mean decreases • Mean decreases • The mean remains the same
  • 11.
    What happens when… •We change consistently every score in the distribution? X = 1, 2, 3, 3, 1 M = 2 Subtract a constant (2) from every score X = -1, 0, 1, 1, -1 M = 0
  • 12.
    What happens when… •We change consistently every score in the distribution? X = 1, 2, 3, 3, 1 M = 2 Subtract a constant (2) from every score X = -1, 0, 1, 1, -1 M = 0 The mean is reduced by the same number (2 – 2 = 0)
  • 13.
    What happens when… •We change consistently every score in the distribution? X = 1, 2, 3, 3, 1 M = 2 Add a constant (1) to every score X = -2, 3, 4, 4, 2 M = 3
  • 14.
    What happens when… •We change consistently every score in the distribution? X = 1, 2, 3, 3, 1 M = 2 Add a constant (1) to every score X = -2, 3, 4, 4, 2 M = 3 The mean is increased by the same number (2 + 1 = 3)
  • 15.
    What happens when… •We change consistently every score in the distribution? X = 1, 2, 3, 3, 1 M = 2 Divide every score by a constant (2) X = 0.5, 1, 1.5, 1.5, 0.5 M = 1
  • 16.
    What happens when… •We change consistently every score in the distribution? X = 1, 2, 3, 3, 1 M = 2 Divide every score by a constant (2) X = 0.5, 1, 1.5, 1.5, 0.5 M = 1 The mean must also be divided by the constant (2 ÷ 2 = 1)
  • 17.
    What happens when… •We change consistently every score in the distribution? X = 1, 2, 3, 3, 1 M = 2 Multiply every score by a constant (2) X = 2, 4, 6, 6, 2 M = 4
  • 18.
    What happens when… •We change consistently every score in the distribution? X = 1, 2, 3, 3, 1 M = 2 Multiply every score by a constant (2) X = 2, 4, 6, 6, 2 M = 4 The mean must also be multiplied by the constant (2 × 2 = 4)
  • 19.
    When the MeanWon’t Work • When a distribution is very skewed (outliers), the mean will be pulled toward the extremes • The mean does not provide a “central” value • When data is from a nominal scale, it is impossible to compute a mean • What is the mean of 1 = male and 2 = female? • When data is from an ordinal scale, it is usually inappropriate to compute a mean • What is the mean of a rank? Alice placed 1st in math; Alfred placed 3rd. Between them, the mean placement was 2.
  • 20.
    The Median • Thescore that divides a distribution exactly in half (50th percentile) • The first score that is greater than 50% of the scores in the distribution • 50% of individuals in a distribution have scores at or below the median • Odd number of scores: • Score in the middle of an ordered distribution • Even number of scores: • Mean of the two scores in the middle of an ordered distribution 3, 5, 8, 10, 11 1, 1, 4, 5, 7, 8 The median The median Is the average of the middle two scores (4+5)/2 = 9/2 = 4.5
  • 21.
    The ‘Precise’ Median •For continuous variables, a ‘precise’ median can be determined • Place the scores in a frequency distribution histogram with each score represented by a box in the graph • Then, draw a vertical line through the distribution so that exactly half the boxes are on each side of the line. The median is defined by the location of the line.
  • 22.
    The Mode • Thescore or category that has the greatest frequency (the most common observation) • The only measure of central tendency that can be used with nominal data • Often a supplemental measure of central tendency reported along with the mean or the median • More than one mode: • Bimodal: A distribution with two scores with (the same) highest frequency • Multimodal: A distribution with more than two modes
  • 23.
    Selecting a Measureof Central Tendency • Mean is often preferred • Uses every score and typically gives a good representative value • Useful in later inferential statistics • However, there are certain situations in which the mean is unable to be used or undesirable for use.
  • 24.
    Selecting a Measureof Central Tendency • We use the median for: • Extreme scores or skewed data – the median is not influenced by extreme scores
  • 25.
    Selecting a Measureof Central Tendency • We use the median for: • Extreme scores or skewed data – the median is not influenced by extreme scores • Undetermined values (e.g., participant drops out before completing a task) –we cannot compute a mean with a missing value
  • 26.
    Selecting a Measureof Central Tendency • We use the median for: • Extreme scores or skewed data – the median is not influenced by extreme scores • Undetermined values (e.g., participant drops out before completing a task) –we cannot compute a mean with a missing value • Open-ended distributions – impossible to compute a mean because there is no way to compute ΣX Number of Pizzas (X) f 5 or more 3 4 2 3 2 2 3 1 6 0 4
  • 27.
    Selecting a Measureof Central Tendency • We use the median for: • Extreme scores or skewed data – the median is not influenced by extreme scores • Undetermined values (e.g., participant drops out before completing a task) –we cannot compute a mean with a missing value • Open-ended distributions – impossible to compute a mean because there is no way to compute ΣX • Ordinal data – the median is defined by direction (half of scores above, half below) and is not defined by distance
  • 28.
    Selecting a Measureof Central Tendency • We use the mode for: • Nominal data • Impossible to compute a mean or median • Discrete variables • Means and medians produce unrealistic values “The average family has 2.5 children” vs. “The typical family has 3 children” • Description of the shape of the distribution • In addition to the mean and the median values
  • 29.
    Central Tendency andthe Shape of the Distribution • The three measures of central tendency are often systematically related to each other