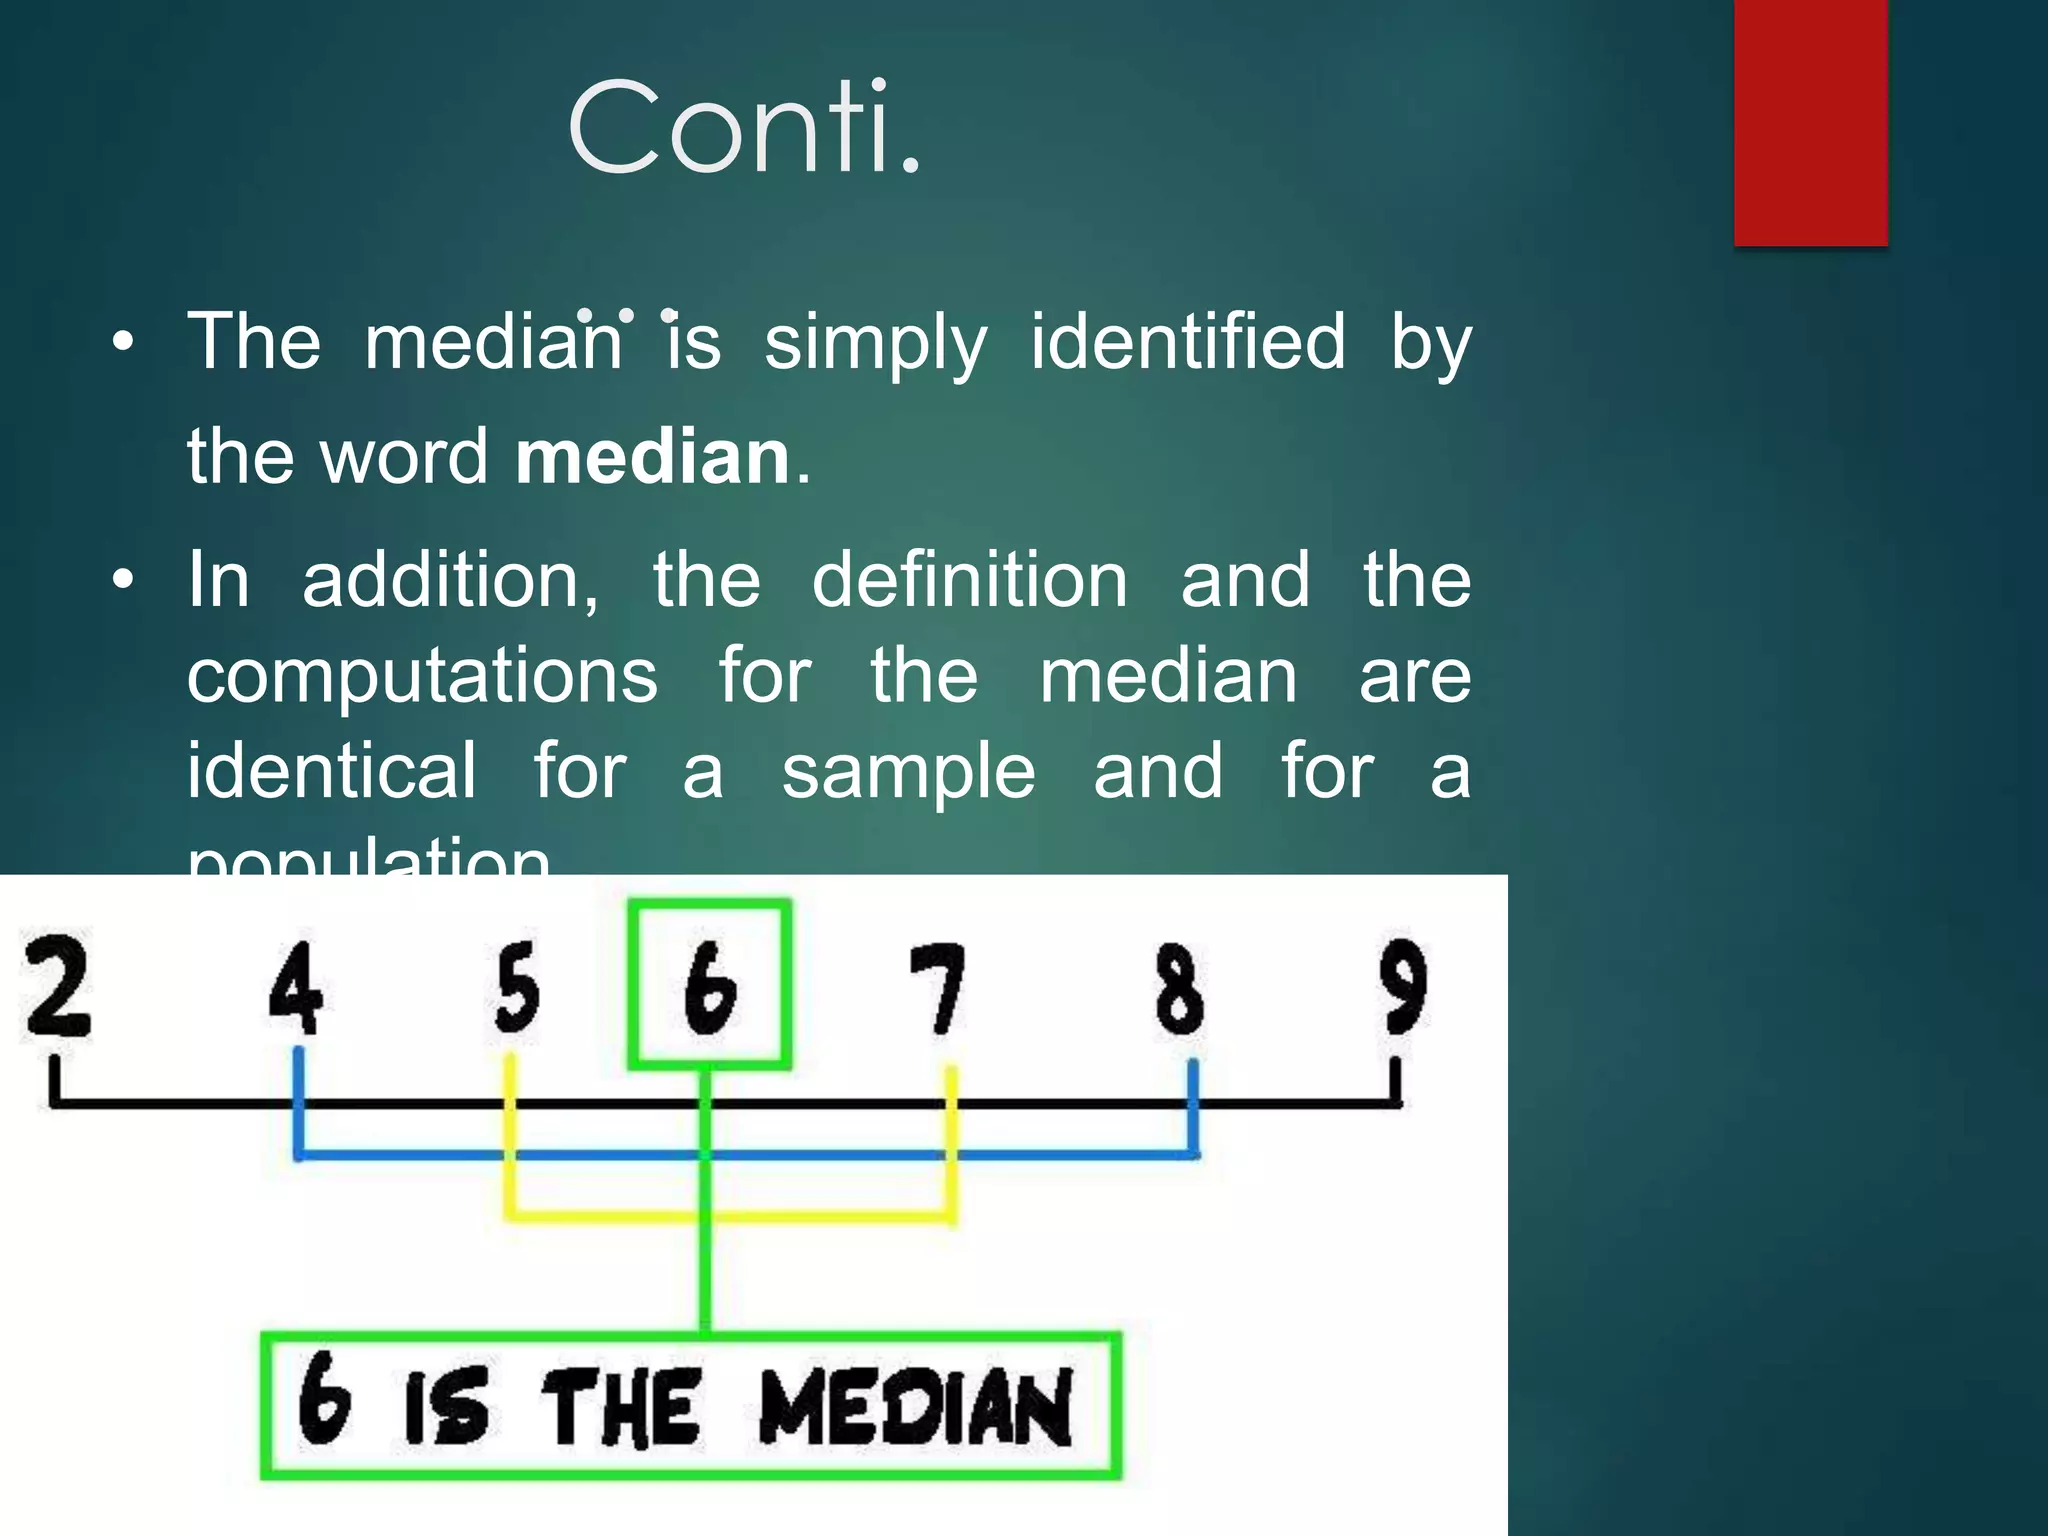
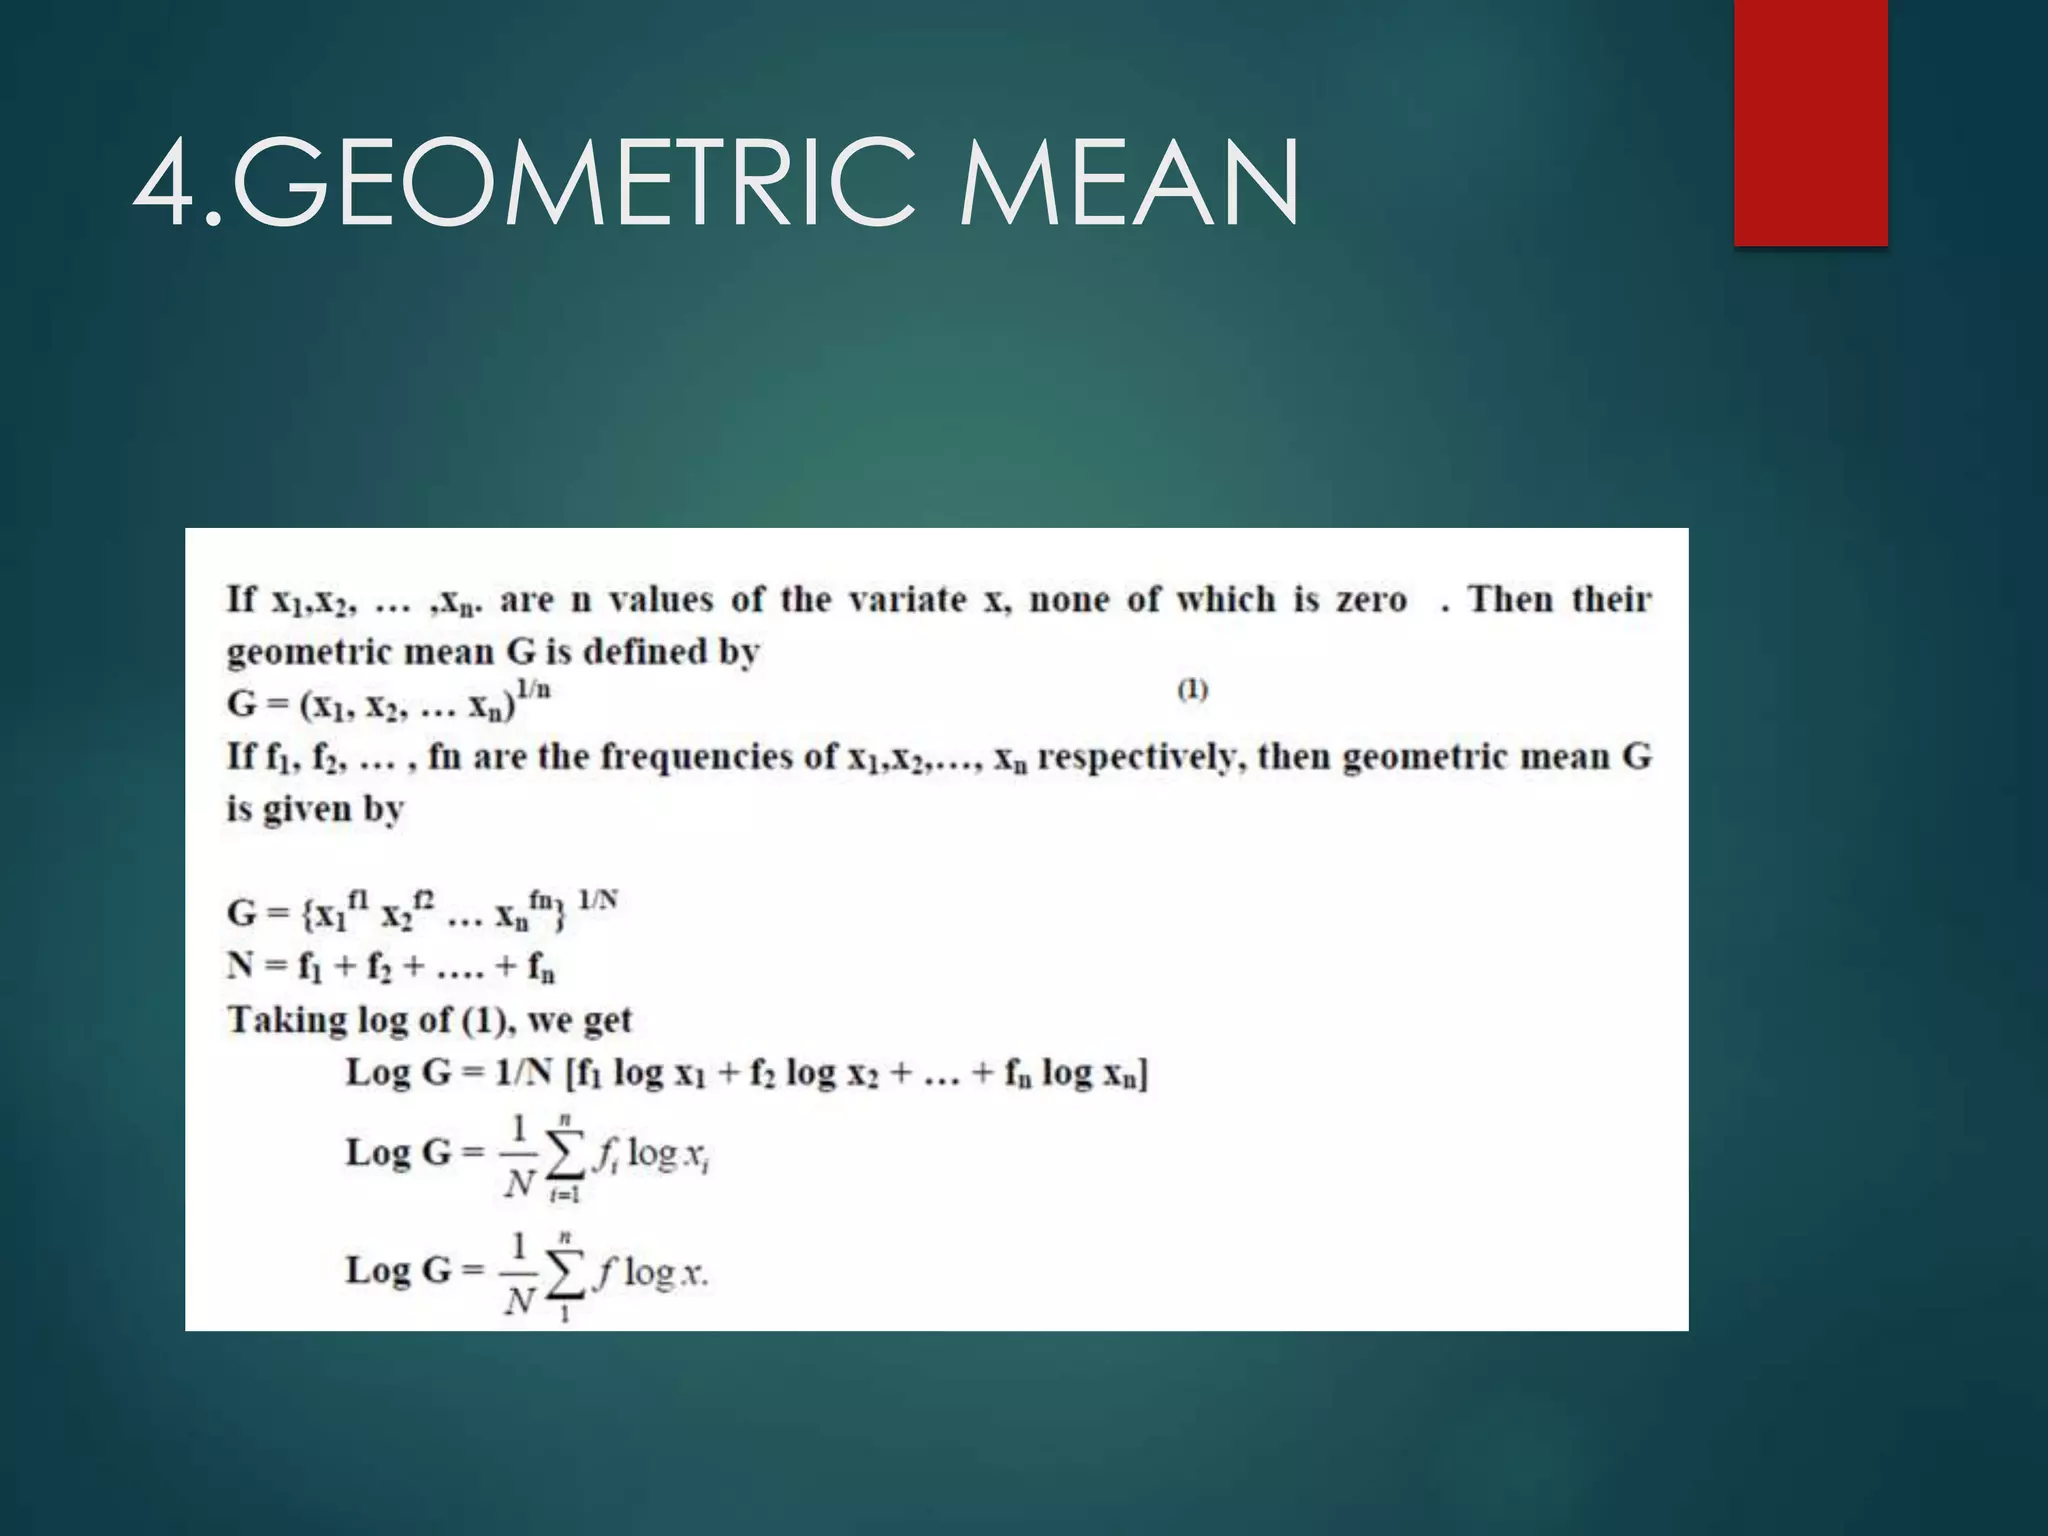
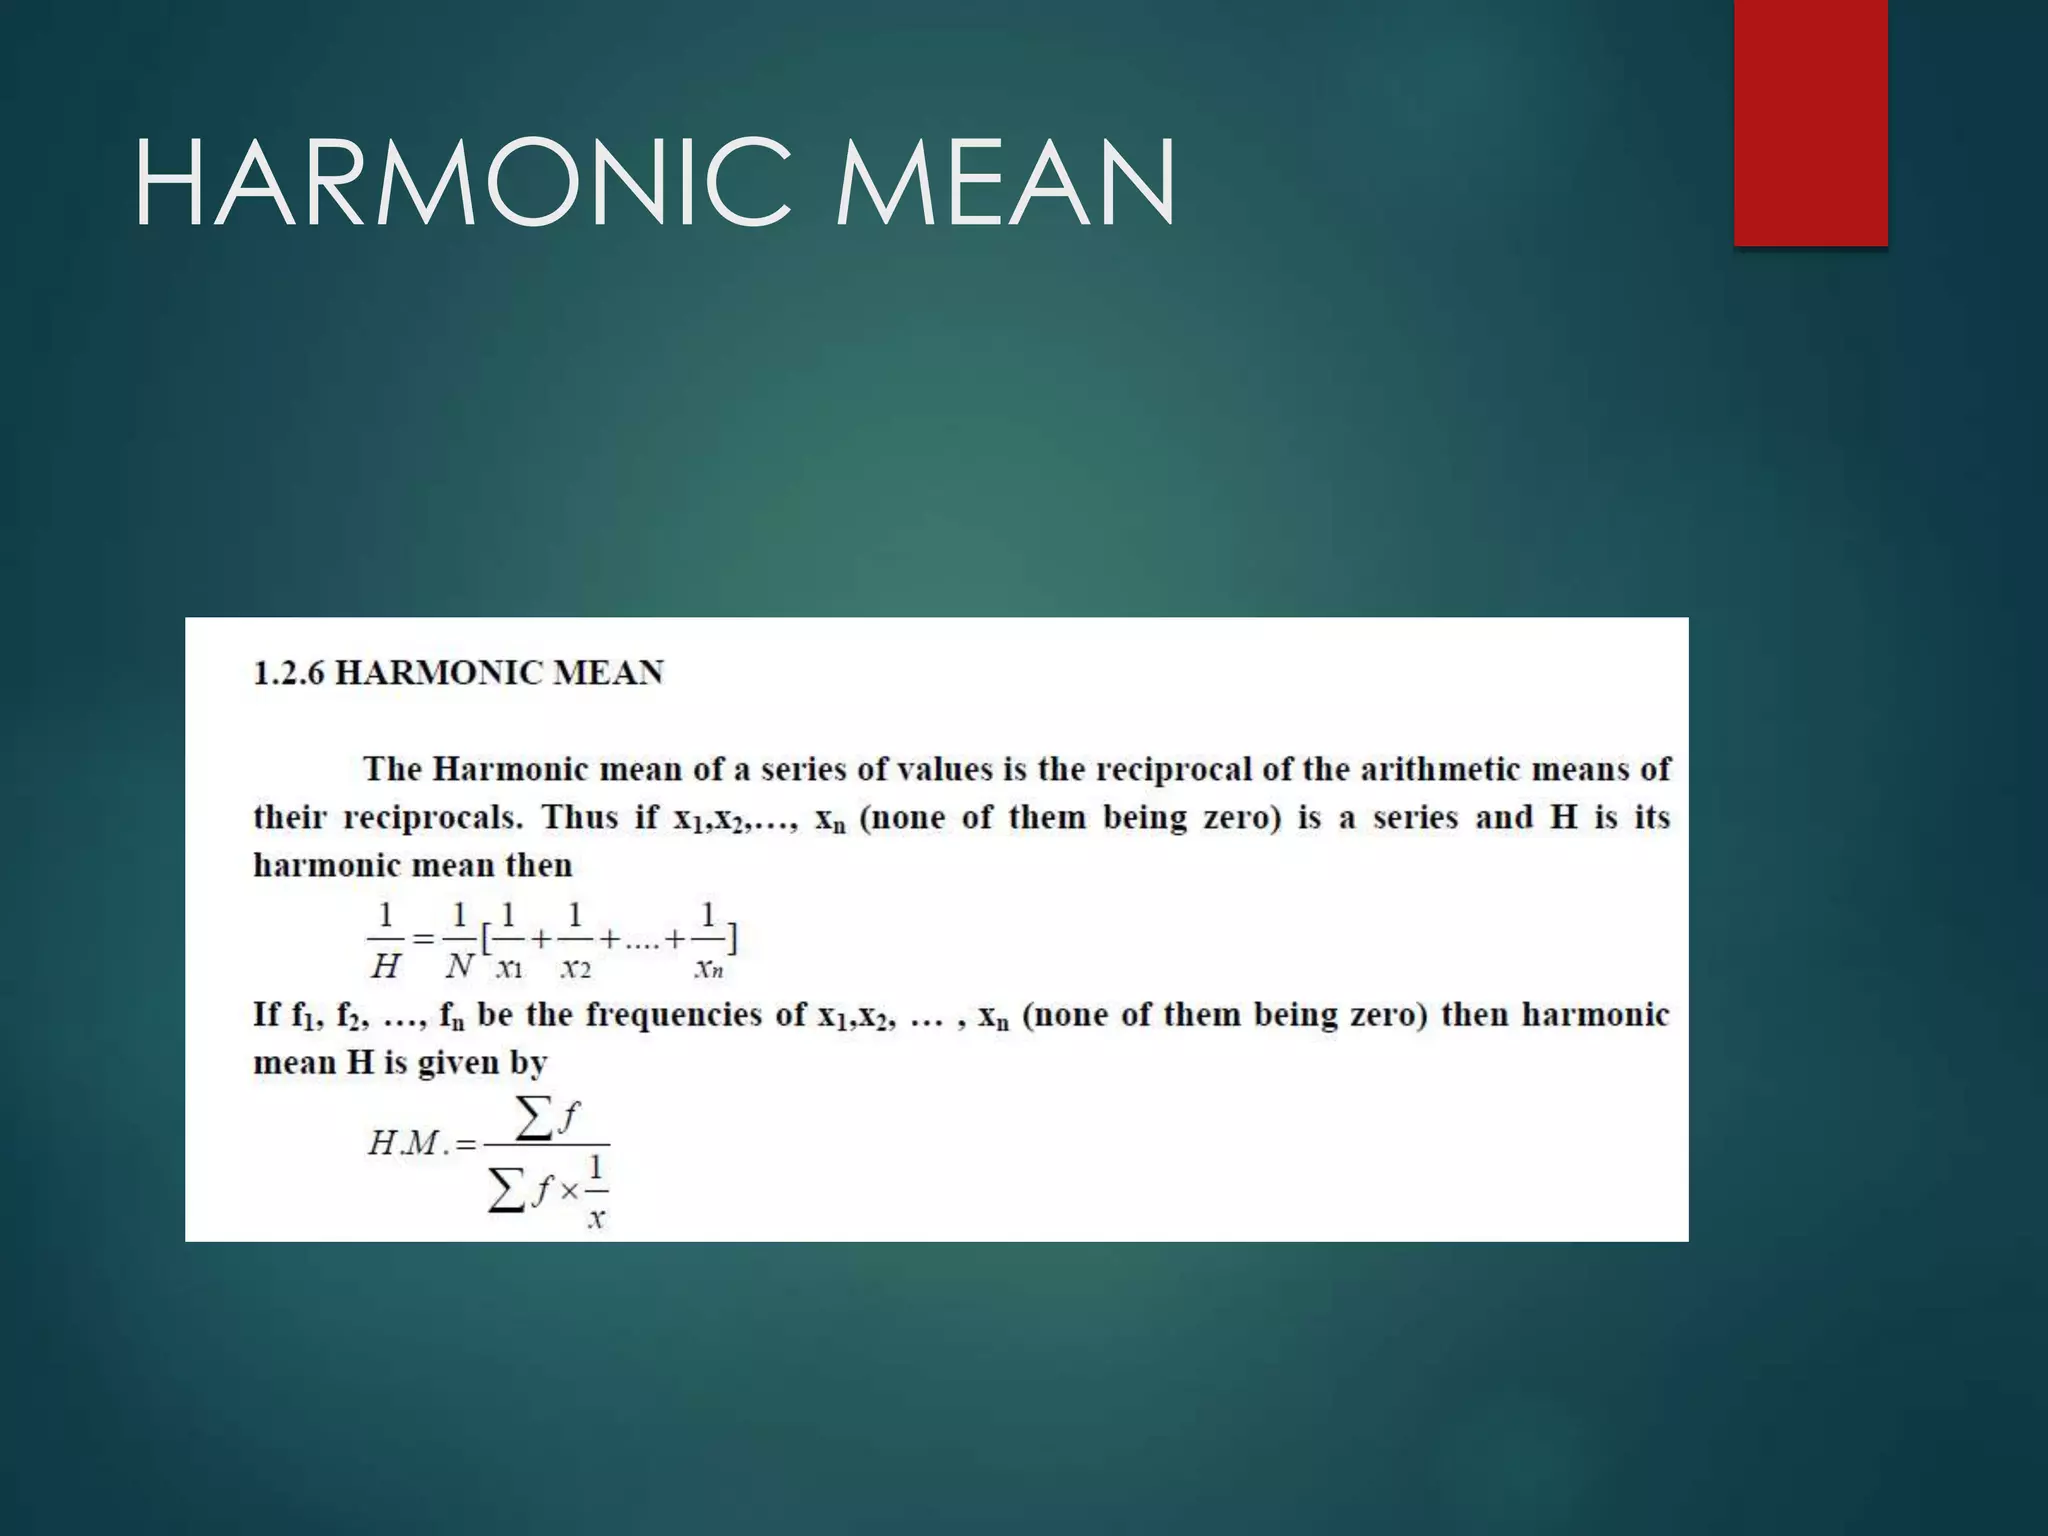
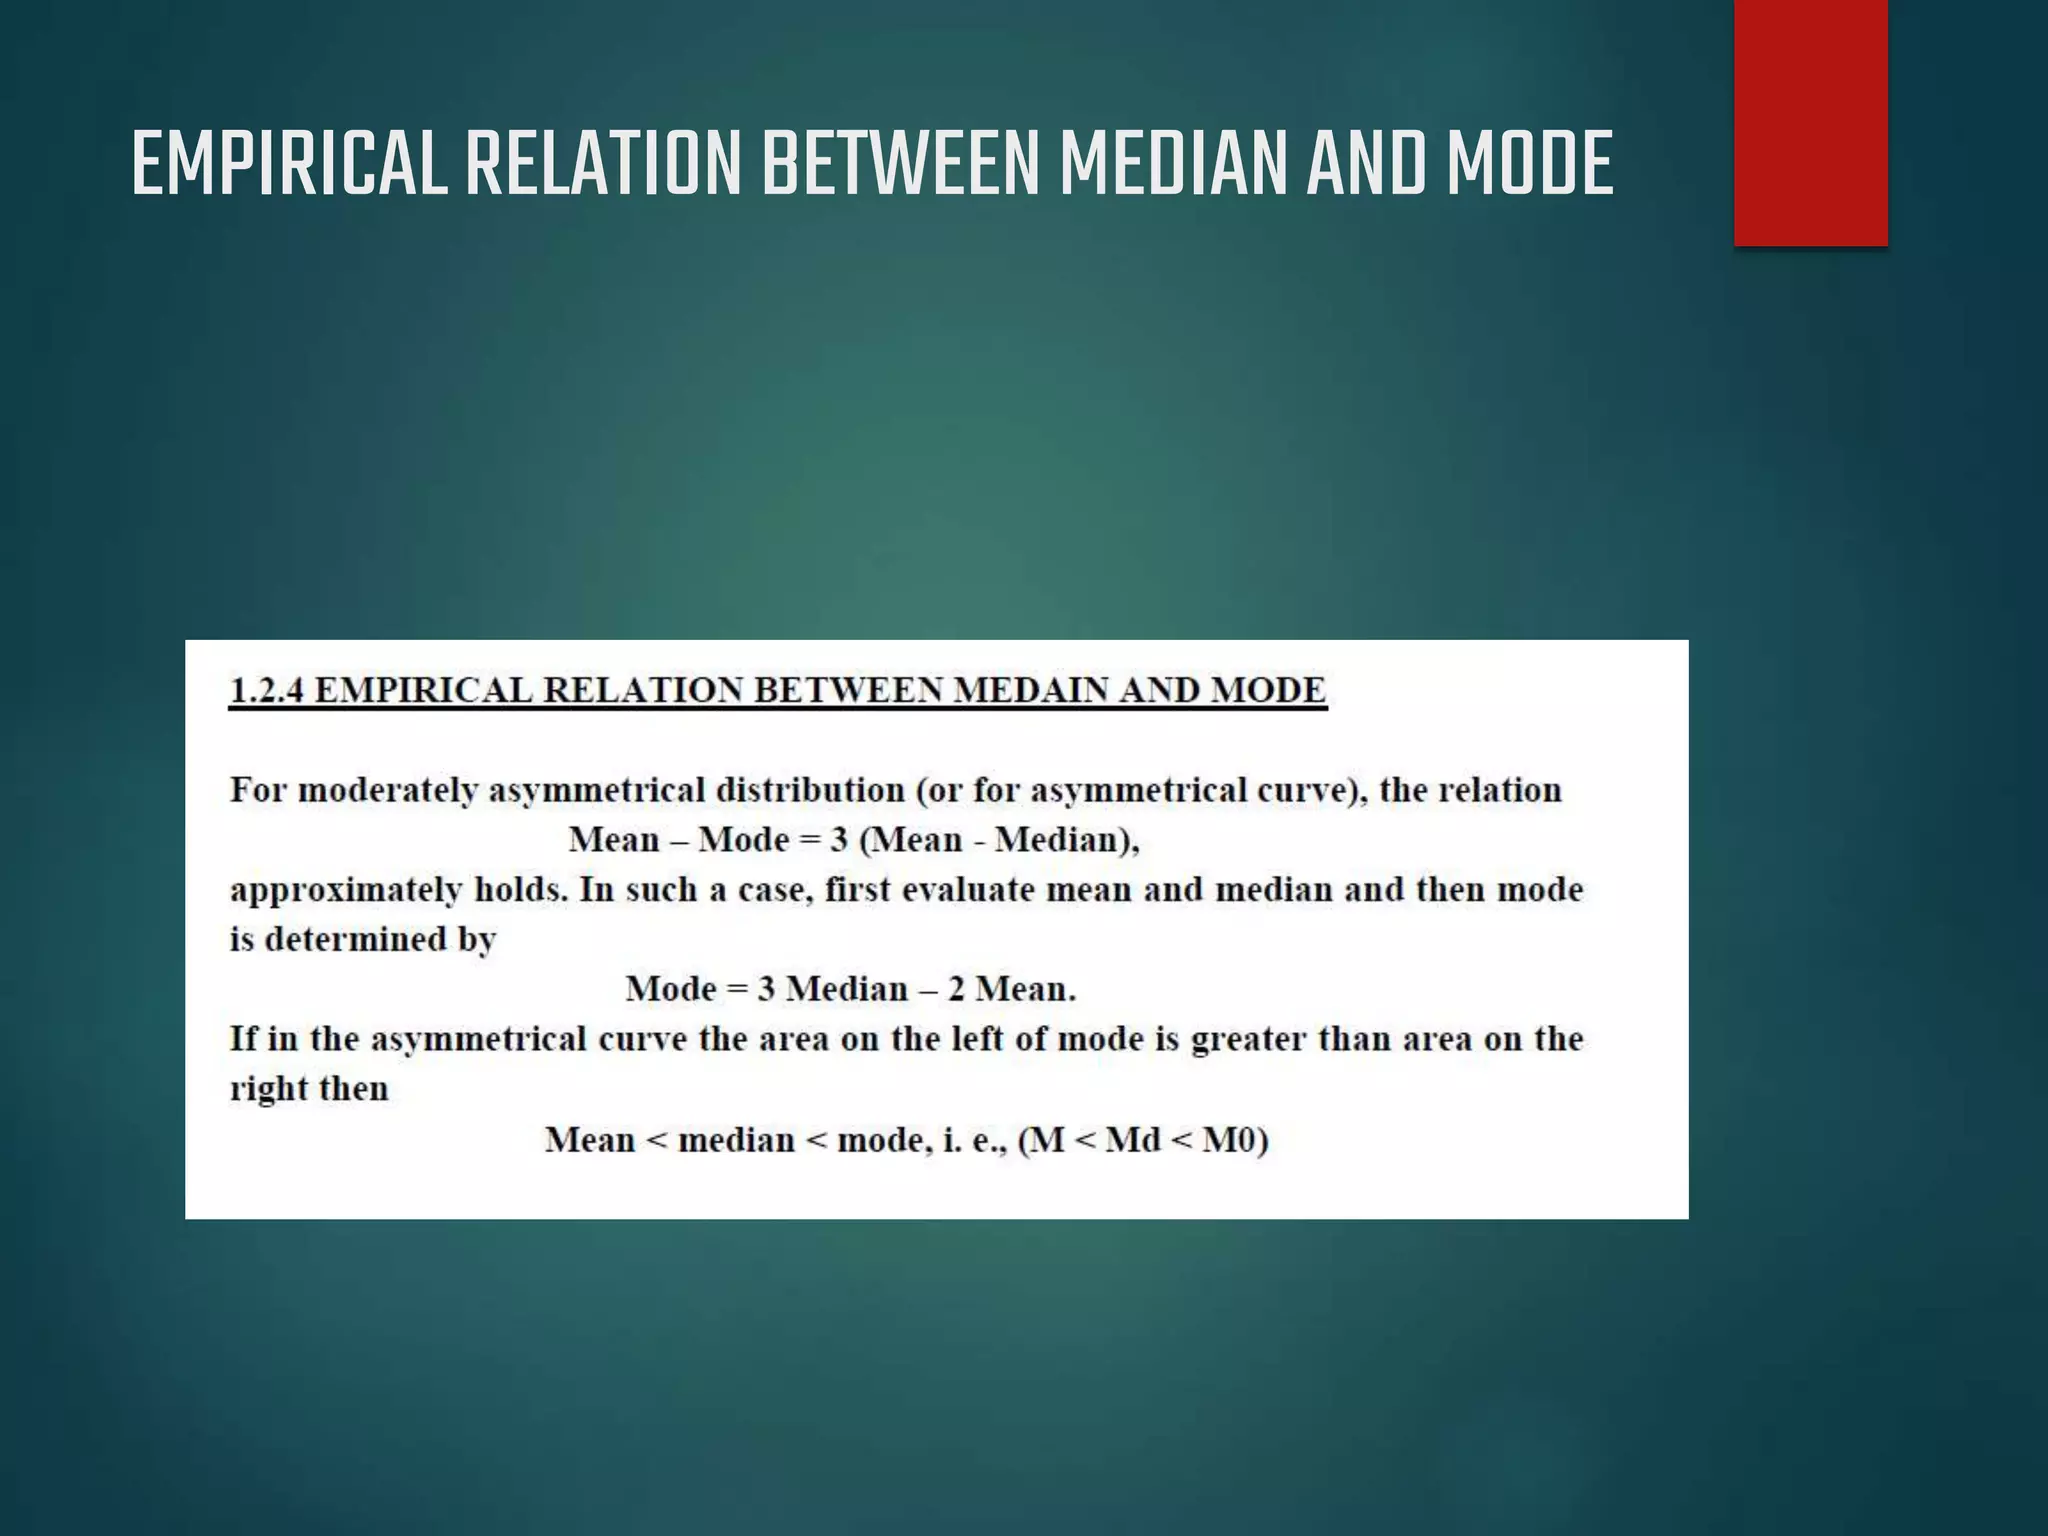
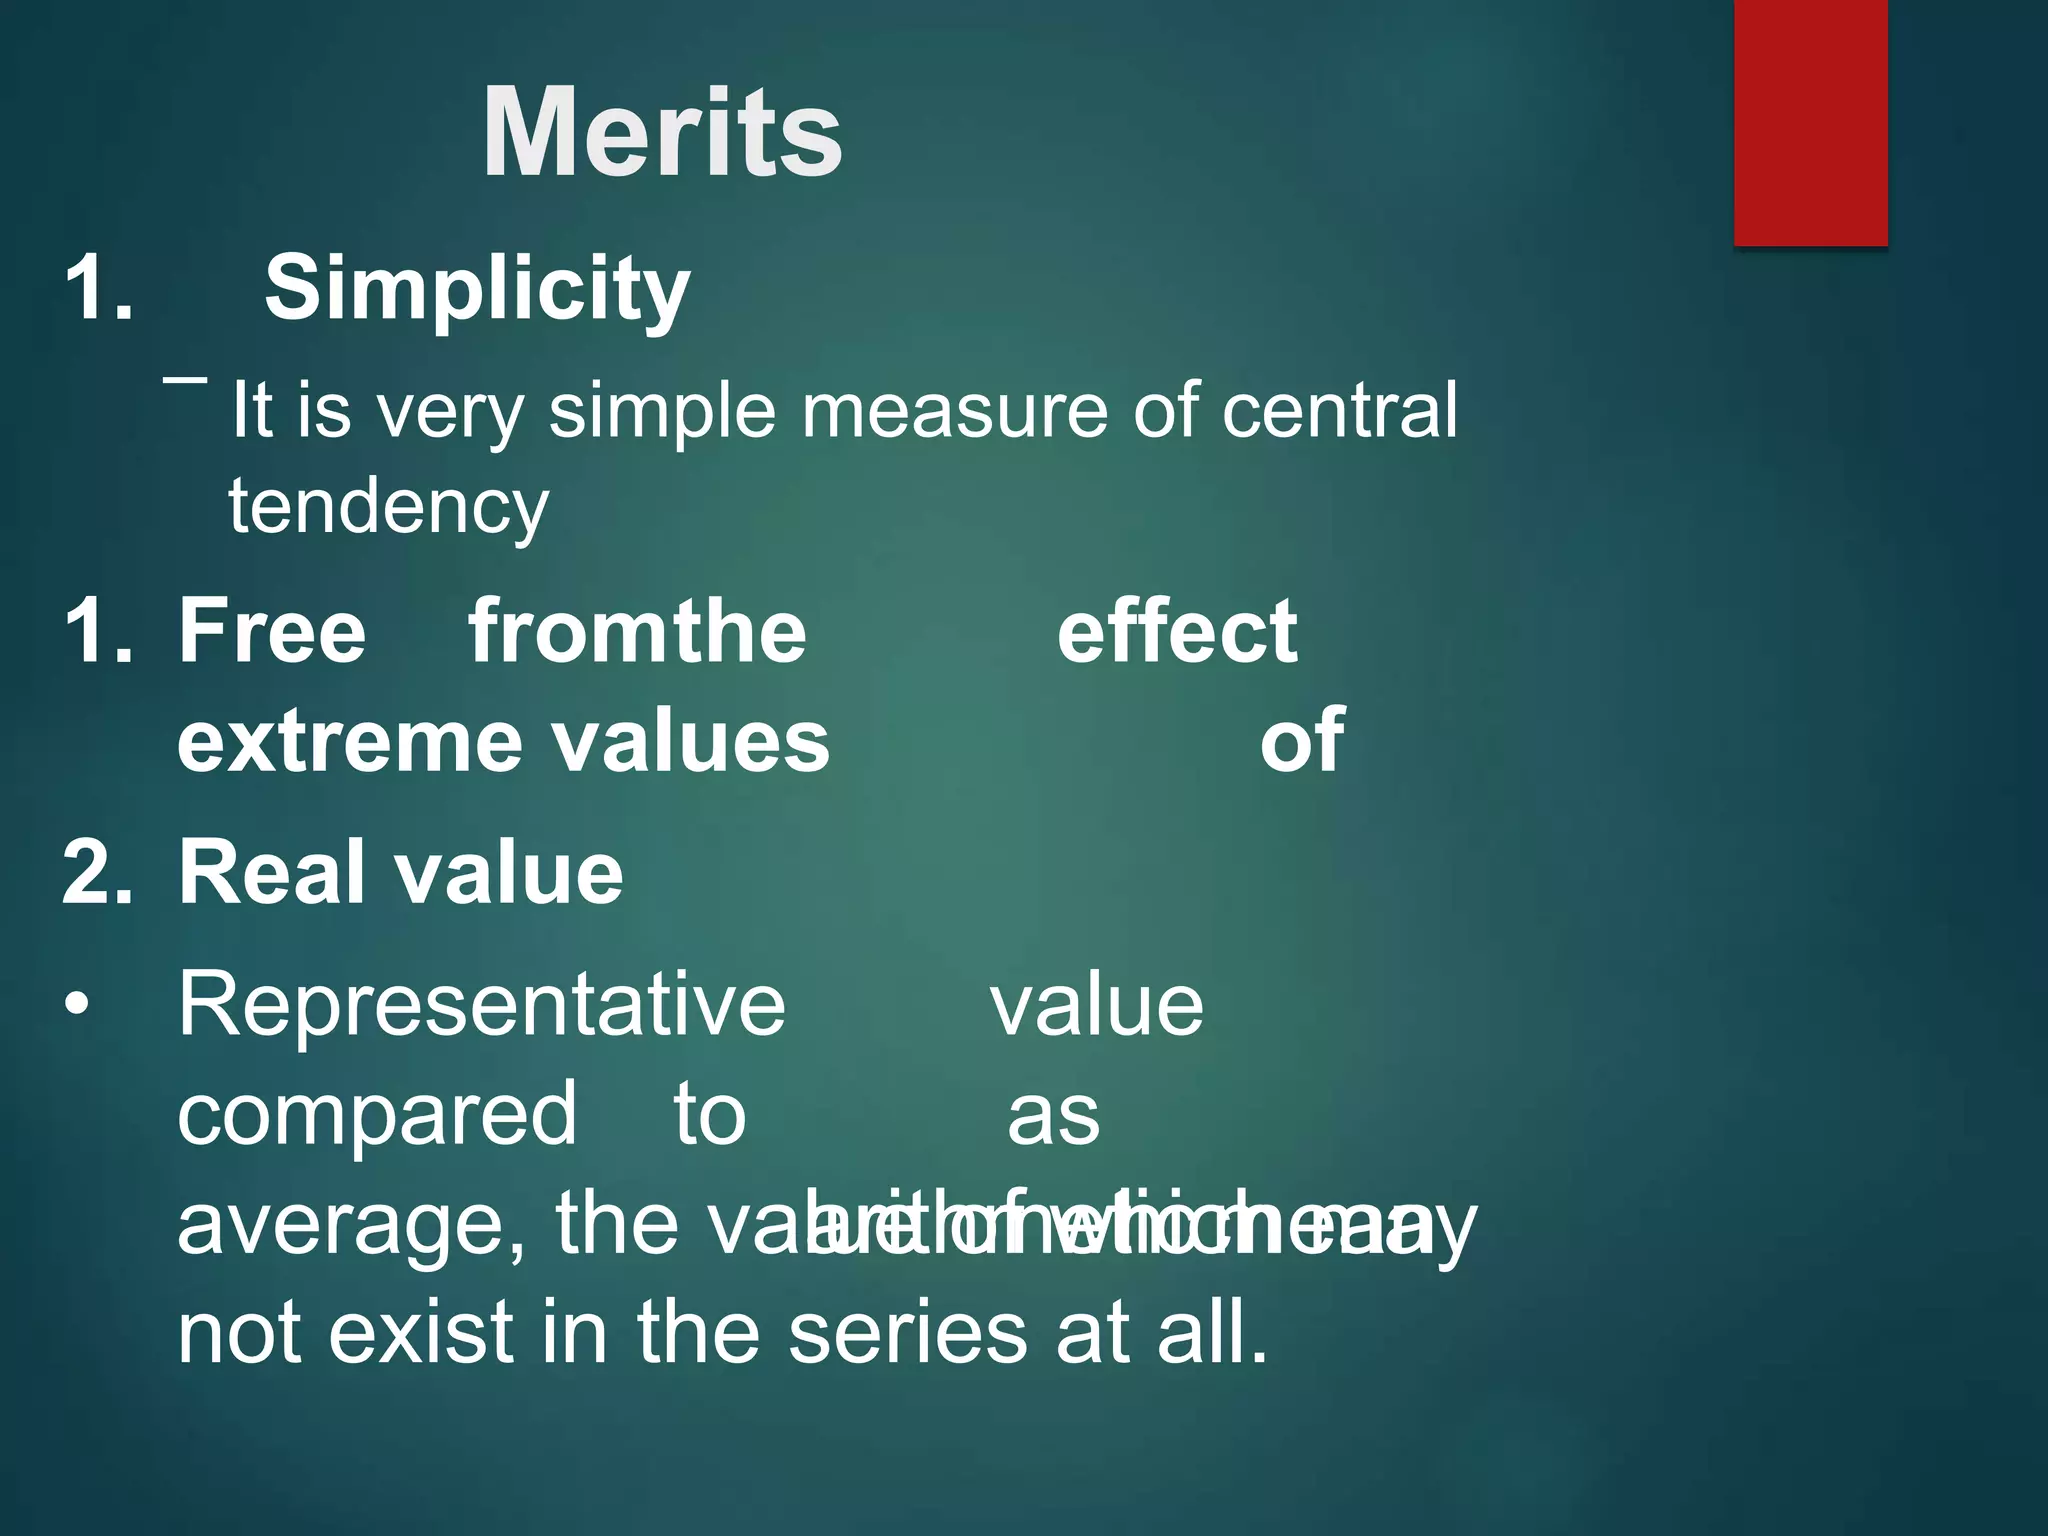
SlideShare a Scribd company logo
1 of 32
PRESENTATION OF SNM
► Fiston roll no. 25
► MARWADI UNIVERSITY
► B.CHEMICAL ENG, 4TH SEM
CONTENT:
► CENTRAL TENDENCIES
► MEAN
► MODE
► MEDIAN
► HORMONIC MEAN AND
GEOMETRIC MEAN
► THEIR MERTS AND DIMERTS
► THEIR APPLICATIONS
MEASURES OF CENTRAL
TENDANCY:
• Statisticians have developed four
different methods for measuring
central tendency;
1.The Mean
2.The Median
3.The Mode
4.HARMONIC MEAN AND
Continue
..
• A measure of central tendency is
a single value that attempts to
describe a set of data by
identifying the central position
within that set of data. As such,
measures of central tendency
are sometimes called measures
of central location.
Continue
..
• They are
also
classed as
summary statistics.
• The
mean
called
the
likely
the
average)
measure
(often
is
most
of
centr
al
tendency
that you are most familiar with,
but there are others, such as
the median and the mode.
Continue
..
• The mean, median and
mode,harmonic and geometric mean
are all valid measures of central
tendency, but under different
conditions, some measures of
central tendency become more
appropriate to use than others.
• In the following sections, we will look
at the mean, median and mode, and
learn how to calculate them and
under what conditions they are most
appropriate to be used.
1. Mean
The mean is the sum of the value of each observation in
a dataset divided by the number of observations. This is
also known as the arithmetic average.
The mean, often called the average, of a numerical set of
data, is simply the sum of the data values divided by the
number of values. The mean is the balance point of a
distribution. The calculations for the mean of a sample and
the total population are done in the same way. However, the
mean of a population is constant, while the mean of a sample
varies from sample to sample
Continued
The mean of a sample or a population is computed
by adding all of the observations and dividing by the
number of observations.
Population mean = μ = ΣX / N OR Sample mean
= x = Σx / n
where ΣX is the sum of all the population
observations, N is the number of population
observations, Σx is the sum of all the sample
observations, and n is the number of sample
observations.
Continued
When statisticians talk about the mean of a
population, they use the Greek letter μ to
refer to the mean score. When they talk
about the mean of a sample, statisticians
use the symbol x to refer to the mean score.
Arihtmetic Mean (group-data) :
Formula:
A.M=ΣfX/Σf
where
X = Individual
value
f = Frequency
The symbol of Σ is pronounced as sigma and is used to
represent the sum of number.
Ungrouped data
Ungrouped data is the opposite of grouped data
with only one possible answer.
For example: The ages of 200 people
entering a park on a Saturday afternoon. The
ages are:
27, 8, 10, 49 etc.
Arithmetic Mean (ungroup-
data)
Formula:
Mean = sum of elements / number of
elements
= a1+a2+a3+.....+an/n
Arithmetic Mean = ΣX/n
where
X = Individual value
n = Total number of values
Advantages of Mean:
•
•
•
It is easy to understand & simple calculate.
It is based on all the values.
It is easy to understand the arithmetic
average even if some of the details of the
data are lacking.
Disadvantages of Mean:
•
•
•
•
It is affected by extreme values.
It cannot be calculated for open end classes.
It cannot be located graphically
It gives misleading conclusions.
2.The Median
• The second measure of central
tendencies
• The goal of the median is to
locate the midpoint of the
distribution.
• There are no specific symbols
or notions to identify the
median
Conti.
…
• The median is simply identified by
the word median.
• In addition, the definition and the
computations for the median are
identical for a sample and for a
population.
The
Definition
• If the scores in a distribution
are listed in order from
smallest to largest
• The median is the midpoint of
the list
• More specifically, the median is
the point on the measurement
scale below which 50% of the
scores in the distribution are
located.
Finding the Median
for most
distribution
• The scores are divided into
equal-sized group.
• We are not locating the
midpoint from highest to lowest
X values
• To find the median, list the
scores in order from smallest
to largest
Conti.
…
• Begin with the smallest score
and count the score as you
move up the list
• The median is the first point you
reach that is greater than of
50% of the score in the
distribution
• The median can be equal to a
score in the list or it can be a
point between two scores
Conti.
…
• Notice that the median is not
algebraically defined (there is
no equation for computing the
median)
• Means that there is a degree of
subjectivity in determining the
exact value
4.GEOMETRIC MEAN
HARMONIC MEAN
EMPIRICALRELATIONBETWEENMEDIANANDMODE
Merits
1. Simplicity
– It is very simple measure of central
tendency
effect
of
1. Free fromthe
extreme values
2. Real value
• Representative
compared to
value
as
arithmeticmean
average, the value of which may
not exist in the series at all.
Demerits
Unrealistic
– When the median is located somewhere
between the two middle values, it remains
only an approximate measure, not a
precise value.
Cont.
…
Lack of representative character
– limited representative character as it is
not based on all the items in the series.
Lack of algebraic treatment
– Arithmetic mean is capable of further
algebraic treatment, but median is not.
3.Mode
Mode is the most frequent
value or score in the distribution.
It is defined as that value of the item in
a series.
It is denoted by the capital letter Z.
Highest point of the
frequencies distribution curve.
Merits of Mode :
•
•
•
•
•
Mode is readily
comprehensible and easily
calculated
It is the best representative of data
It is not at all affected by extreme
value.
The valueof mode can
also be determined
graphically.
It is usually an actual value of an
Demerits of
Mode
•
•
It is not based on
all observations.
It is not capable of
further
mathematical
manipulation.
• Mode
is
extent
affected to a
great by
sampling
•
fluctuations.
Choice of grouping has
great influence on the
value of mode.
Conclusion:
A measure of central tendency is a
measure that tells us where the
middle of a bunch of data lies.
Mean is the most common measure
of central tendency. It is simply the
sum of the numbers divided by the
number of numbers in a set of data.
This is also known as average.
Continue…
► Median is the number present
in the middle when the numbers
in a set of data are arranged in
ascending or descending order..
► Mode is the value that occurs
most frequently in a set of data.
THANK YOU
FOR YOUR
INTENTION
!!.

More Related Content

What's hot

Measures of Dispersion
Measures of DispersionMeasures of Dispersion
Measures of DispersionMohit Mahajan
 
Measures of dispersion
Measures of dispersionMeasures of dispersion
Measures of dispersionJagdish Powar
 
Pearson's correlation
Pearson's  correlationPearson's  correlation
Pearson's correlationTRIPTI DUBEY
 
Bar Diagram (chart) in Statistics presentation
Bar Diagram (chart) in Statistics presentationBar Diagram (chart) in Statistics presentation
Bar Diagram (chart) in Statistics presentationsheiblu
 
MEASURES OF CENTRAL TENDENCY AND MEASURES OF DISPERSION
MEASURES OF CENTRAL TENDENCY AND  MEASURES OF DISPERSION MEASURES OF CENTRAL TENDENCY AND  MEASURES OF DISPERSION
MEASURES OF CENTRAL TENDENCY AND MEASURES OF DISPERSION Tanya Singla
 
Measure OF Central Tendency
Measure OF Central TendencyMeasure OF Central Tendency
Measure OF Central TendencyIqrabutt038
 
FREQUENCY DISTRIBUTION.pptx
FREQUENCY DISTRIBUTION.pptxFREQUENCY DISTRIBUTION.pptx
FREQUENCY DISTRIBUTION.pptxSreeLatha98
 
F test and ANOVA
F test and ANOVAF test and ANOVA
F test and ANOVAMEENURANJI
 
Measures of central tendency
Measures of central tendency Measures of central tendency
Measures of central tendency Jagdish Powar
 
APPLICATION OF CORRELATION AND CASE STUDY
APPLICATION OF CORRELATION AND CASE STUDYAPPLICATION OF CORRELATION AND CASE STUDY
APPLICATION OF CORRELATION AND CASE STUDYANKUSH
 

What's hot (20)

Skewness
SkewnessSkewness
Skewness
 
Standard deviation
Standard deviationStandard deviation
Standard deviation
 
Correlation
CorrelationCorrelation
Correlation
 
Measures of Dispersion
Measures of DispersionMeasures of Dispersion
Measures of Dispersion
 
Measures of dispersion
Measures of dispersionMeasures of dispersion
Measures of dispersion
 
Pearson's correlation
Pearson's  correlationPearson's  correlation
Pearson's correlation
 
Bar Diagram (chart) in Statistics presentation
Bar Diagram (chart) in Statistics presentationBar Diagram (chart) in Statistics presentation
Bar Diagram (chart) in Statistics presentation
 
MEASURES OF CENTRAL TENDENCY AND MEASURES OF DISPERSION
MEASURES OF CENTRAL TENDENCY AND  MEASURES OF DISPERSION MEASURES OF CENTRAL TENDENCY AND  MEASURES OF DISPERSION
MEASURES OF CENTRAL TENDENCY AND MEASURES OF DISPERSION
 
Measure OF Central Tendency
Measure OF Central TendencyMeasure OF Central Tendency
Measure OF Central Tendency
 
Scatter Diagram
Scatter DiagramScatter Diagram
Scatter Diagram
 
MODE.pptx
MODE.pptxMODE.pptx
MODE.pptx
 
FREQUENCY DISTRIBUTION.pptx
FREQUENCY DISTRIBUTION.pptxFREQUENCY DISTRIBUTION.pptx
FREQUENCY DISTRIBUTION.pptx
 
Standard deviation
Standard deviationStandard deviation
Standard deviation
 
Median & mode
Median & modeMedian & mode
Median & mode
 
The Mean Deviation.pptx
The Mean Deviation.pptxThe Mean Deviation.pptx
The Mean Deviation.pptx
 
F test and ANOVA
F test and ANOVAF test and ANOVA
F test and ANOVA
 
Measure of central tendency
Measure of central tendencyMeasure of central tendency
Measure of central tendency
 
Measures of central tendency
Measures of central tendency Measures of central tendency
Measures of central tendency
 
Standard deviation
Standard deviationStandard deviation
Standard deviation
 
APPLICATION OF CORRELATION AND CASE STUDY
APPLICATION OF CORRELATION AND CASE STUDYAPPLICATION OF CORRELATION AND CASE STUDY
APPLICATION OF CORRELATION AND CASE STUDY
 

Similar to Slideshare notes about measures of central tendancy(mean,median and mode)

Measure of Central Tendency
Measure of Central Tendency Measure of Central Tendency
Measure of Central Tendency Umme Habiba
 
Measure of central tendency grouped data.pptx
Measure of central tendency grouped data.pptxMeasure of central tendency grouped data.pptx
Measure of central tendency grouped data.pptxSandeAlotaBoco
 
Upload 140103034715-phpapp01 (1)
Upload 140103034715-phpapp01 (1)Upload 140103034715-phpapp01 (1)
Upload 140103034715-phpapp01 (1)captaininfantry
 
measuresofcentraltendency-141113111140-conversion-gate02.pptx
measuresofcentraltendency-141113111140-conversion-gate02.pptxmeasuresofcentraltendency-141113111140-conversion-gate02.pptx
measuresofcentraltendency-141113111140-conversion-gate02.pptxIshikaRoy32
 
measures of central tendency in statistics which is essential for business ma...
measures of central tendency in statistics which is essential for business ma...measures of central tendency in statistics which is essential for business ma...
measures of central tendency in statistics which is essential for business ma...SoujanyaLk1
 
measures of central tendency.pptx
measures of central tendency.pptxmeasures of central tendency.pptx
measures of central tendency.pptxSabaIrfan11
 
Business statistics
Business statisticsBusiness statistics
Business statisticsRavi Prakash
 
UNIT III -Central Tendency.ppt
UNIT III -Central Tendency.pptUNIT III -Central Tendency.ppt
UNIT III -Central Tendency.pptssuser620c82
 
3 measures of central dendency
3  measures of central dendency3  measures of central dendency
3 measures of central dendencyDr. Nazar Jaf
 
Statistics digital text book
Statistics digital text bookStatistics digital text book
Statistics digital text bookdeepuplr
 
3. Statistical Analysis.pptx
3. Statistical Analysis.pptx3. Statistical Analysis.pptx
3. Statistical Analysis.pptxjeyanthisivakumar
 
Topic 2 Measures of Central Tendency.pptx
Topic 2   Measures of Central Tendency.pptxTopic 2   Measures of Central Tendency.pptx
Topic 2 Measures of Central Tendency.pptxCallplanetsDeveloper
 
Descriptive statistics
Descriptive statisticsDescriptive statistics
Descriptive statisticsmolly joy
 
Measures of Central Tendency-Mean, Median , Mode- Dr. Vikramjit Singh
Measures of Central Tendency-Mean, Median , Mode- Dr. Vikramjit SinghMeasures of Central Tendency-Mean, Median , Mode- Dr. Vikramjit Singh
Measures of Central Tendency-Mean, Median , Mode- Dr. Vikramjit SinghVikramjit Singh
 
Chapter 12 Data Analysis Descriptive Methods and Index Numbers
Chapter 12 Data Analysis Descriptive Methods and Index NumbersChapter 12 Data Analysis Descriptive Methods and Index Numbers
Chapter 12 Data Analysis Descriptive Methods and Index NumbersInternational advisers
 

Similar to Slideshare notes about measures of central tendancy(mean,median and mode) (20)

Measure of Central Tendency
Measure of Central Tendency Measure of Central Tendency
Measure of Central Tendency
 
Measure of central tendency grouped data.pptx
Measure of central tendency grouped data.pptxMeasure of central tendency grouped data.pptx
Measure of central tendency grouped data.pptx
 
Upload 140103034715-phpapp01 (1)
Upload 140103034715-phpapp01 (1)Upload 140103034715-phpapp01 (1)
Upload 140103034715-phpapp01 (1)
 
measuresofcentraltendency-141113111140-conversion-gate02.pptx
measuresofcentraltendency-141113111140-conversion-gate02.pptxmeasuresofcentraltendency-141113111140-conversion-gate02.pptx
measuresofcentraltendency-141113111140-conversion-gate02.pptx
 
measures of central tendency in statistics which is essential for business ma...
measures of central tendency in statistics which is essential for business ma...measures of central tendency in statistics which is essential for business ma...
measures of central tendency in statistics which is essential for business ma...
 
Unit 3_1.pptx
Unit 3_1.pptxUnit 3_1.pptx
Unit 3_1.pptx
 
measures of central tendency.pptx
measures of central tendency.pptxmeasures of central tendency.pptx
measures of central tendency.pptx
 
Business statistics
Business statisticsBusiness statistics
Business statistics
 
Measure of Central Tendency
Measure of Central TendencyMeasure of Central Tendency
Measure of Central Tendency
 
UNIT III -Central Tendency.ppt
UNIT III -Central Tendency.pptUNIT III -Central Tendency.ppt
UNIT III -Central Tendency.ppt
 
3 measures of central dendency
3  measures of central dendency3  measures of central dendency
3 measures of central dendency
 
Statistics digital text book
Statistics digital text bookStatistics digital text book
Statistics digital text book
 
chapter3.ppt
chapter3.pptchapter3.ppt
chapter3.ppt
 
3. Statistical Analysis.pptx
3. Statistical Analysis.pptx3. Statistical Analysis.pptx
3. Statistical Analysis.pptx
 
Topic 2 Measures of Central Tendency.pptx
Topic 2   Measures of Central Tendency.pptxTopic 2   Measures of Central Tendency.pptx
Topic 2 Measures of Central Tendency.pptx
 
Descriptive statistics
Descriptive statisticsDescriptive statistics
Descriptive statistics
 
Central tendency
 Central tendency Central tendency
Central tendency
 
Measures of Central Tendency-Mean, Median , Mode- Dr. Vikramjit Singh
Measures of Central Tendency-Mean, Median , Mode- Dr. Vikramjit SinghMeasures of Central Tendency-Mean, Median , Mode- Dr. Vikramjit Singh
Measures of Central Tendency-Mean, Median , Mode- Dr. Vikramjit Singh
 
Chapter 12 Data Analysis Descriptive Methods and Index Numbers
Chapter 12 Data Analysis Descriptive Methods and Index NumbersChapter 12 Data Analysis Descriptive Methods and Index Numbers
Chapter 12 Data Analysis Descriptive Methods and Index Numbers
 
Statistics 315
Statistics 315Statistics 315
Statistics 315
 

Recently uploaded

Bun (KitWorks Team Study 노별마루 발표 2024.4.22)
Bun (KitWorks Team Study 노별마루 발표 2024.4.22)Bun (KitWorks Team Study 노별마루 발표 2024.4.22)
Bun (KitWorks Team Study 노별마루 발표 2024.4.22)Wonjun Hwang
 
Connect Wave/ connectwave Pitch Deck Presentation
Connect Wave/ connectwave Pitch Deck PresentationConnect Wave/ connectwave Pitch Deck Presentation
Connect Wave/ connectwave Pitch Deck PresentationSlibray Presentation
 
APIForce Zurich 5 April Automation LPDG
APIForce Zurich 5 April  Automation LPDGAPIForce Zurich 5 April  Automation LPDG
APIForce Zurich 5 April Automation LPDGMarianaLemus7
 
"Subclassing and Composition – A Pythonic Tour of Trade-Offs", Hynek Schlawack
"Subclassing and Composition – A Pythonic Tour of Trade-Offs", Hynek Schlawack"Subclassing and Composition – A Pythonic Tour of Trade-Offs", Hynek Schlawack
"Subclassing and Composition – A Pythonic Tour of Trade-Offs", Hynek SchlawackFwdays
 
Integration and Automation in Practice: CI/CD in Mule Integration and Automat...
Integration and Automation in Practice: CI/CD in Mule Integration and Automat...Integration and Automation in Practice: CI/CD in Mule Integration and Automat...
Integration and Automation in Practice: CI/CD in Mule Integration and Automat...Patryk Bandurski
 
SQL Database Design For Developers at php[tek] 2024
SQL Database Design For Developers at php[tek] 2024SQL Database Design For Developers at php[tek] 2024
SQL Database Design For Developers at php[tek] 2024Scott Keck-Warren
 
"LLMs for Python Engineers: Advanced Data Analysis and Semantic Kernel",Oleks...
"LLMs for Python Engineers: Advanced Data Analysis and Semantic Kernel",Oleks..."LLMs for Python Engineers: Advanced Data Analysis and Semantic Kernel",Oleks...
"LLMs for Python Engineers: Advanced Data Analysis and Semantic Kernel",Oleks...Fwdays
 
Artificial intelligence in cctv survelliance.pptx
Artificial intelligence in cctv survelliance.pptxArtificial intelligence in cctv survelliance.pptx
Artificial intelligence in cctv survelliance.pptxhariprasad279825
 
Ensuring Technical Readiness For Copilot in Microsoft 365
Ensuring Technical Readiness For Copilot in Microsoft 365Ensuring Technical Readiness For Copilot in Microsoft 365
Ensuring Technical Readiness For Copilot in Microsoft 3652toLead Limited
 
AI as an Interface for Commercial Buildings
AI as an Interface for Commercial BuildingsAI as an Interface for Commercial Buildings
AI as an Interface for Commercial BuildingsMemoori
 
Understanding the Laravel MVC Architecture
Understanding the Laravel MVC ArchitectureUnderstanding the Laravel MVC Architecture
Understanding the Laravel MVC ArchitecturePixlogix Infotech
 
Scanning the Internet for External Cloud Exposures via SSL Certs
Scanning the Internet for External Cloud Exposures via SSL CertsScanning the Internet for External Cloud Exposures via SSL Certs
Scanning the Internet for External Cloud Exposures via SSL CertsRizwan Syed
 
My INSURER PTE LTD - Insurtech Innovation Award 2024
My INSURER PTE LTD - Insurtech Innovation Award 2024My INSURER PTE LTD - Insurtech Innovation Award 2024
My INSURER PTE LTD - Insurtech Innovation Award 2024The Digital Insurer
 
Transcript: New from BookNet Canada for 2024: BNC CataList - Tech Forum 2024
Transcript: New from BookNet Canada for 2024: BNC CataList - Tech Forum 2024Transcript: New from BookNet Canada for 2024: BNC CataList - Tech Forum 2024
Transcript: New from BookNet Canada for 2024: BNC CataList - Tech Forum 2024BookNet Canada
 
Automating Business Process via MuleSoft Composer | Bangalore MuleSoft Meetup...
Automating Business Process via MuleSoft Composer | Bangalore MuleSoft Meetup...Automating Business Process via MuleSoft Composer | Bangalore MuleSoft Meetup...
Automating Business Process via MuleSoft Composer | Bangalore MuleSoft Meetup...shyamraj55
 
Kotlin Multiplatform & Compose Multiplatform - Starter kit for pragmatics
Kotlin Multiplatform & Compose Multiplatform - Starter kit for pragmaticsKotlin Multiplatform & Compose Multiplatform - Starter kit for pragmatics
Kotlin Multiplatform & Compose Multiplatform - Starter kit for pragmaticscarlostorres15106
 
Streamlining Python Development: A Guide to a Modern Project Setup
Streamlining Python Development: A Guide to a Modern Project SetupStreamlining Python Development: A Guide to a Modern Project Setup
Streamlining Python Development: A Guide to a Modern Project SetupFlorian Wilhelm
 
Tech-Forward - Achieving Business Readiness For Copilot in Microsoft 365
Tech-Forward - Achieving Business Readiness For Copilot in Microsoft 365Tech-Forward - Achieving Business Readiness For Copilot in Microsoft 365
Tech-Forward - Achieving Business Readiness For Copilot in Microsoft 3652toLead Limited
 
Story boards and shot lists for my a level piece
Story boards and shot lists for my a level pieceStory boards and shot lists for my a level piece
Story boards and shot lists for my a level piececharlottematthew16
 
My Hashitalk Indonesia April 2024 Presentation
My Hashitalk Indonesia April 2024 PresentationMy Hashitalk Indonesia April 2024 Presentation
My Hashitalk Indonesia April 2024 PresentationRidwan Fadjar
 

Recently uploaded (20)

Bun (KitWorks Team Study 노별마루 발표 2024.4.22)
Bun (KitWorks Team Study 노별마루 발표 2024.4.22)Bun (KitWorks Team Study 노별마루 발표 2024.4.22)
Bun (KitWorks Team Study 노별마루 발표 2024.4.22)
 
Connect Wave/ connectwave Pitch Deck Presentation
Connect Wave/ connectwave Pitch Deck PresentationConnect Wave/ connectwave Pitch Deck Presentation
Connect Wave/ connectwave Pitch Deck Presentation
 
APIForce Zurich 5 April Automation LPDG
APIForce Zurich 5 April  Automation LPDGAPIForce Zurich 5 April  Automation LPDG
APIForce Zurich 5 April Automation LPDG
 
"Subclassing and Composition – A Pythonic Tour of Trade-Offs", Hynek Schlawack
"Subclassing and Composition – A Pythonic Tour of Trade-Offs", Hynek Schlawack"Subclassing and Composition – A Pythonic Tour of Trade-Offs", Hynek Schlawack
"Subclassing and Composition – A Pythonic Tour of Trade-Offs", Hynek Schlawack
 
Integration and Automation in Practice: CI/CD in Mule Integration and Automat...
Integration and Automation in Practice: CI/CD in Mule Integration and Automat...Integration and Automation in Practice: CI/CD in Mule Integration and Automat...
Integration and Automation in Practice: CI/CD in Mule Integration and Automat...
 
SQL Database Design For Developers at php[tek] 2024
SQL Database Design For Developers at php[tek] 2024SQL Database Design For Developers at php[tek] 2024
SQL Database Design For Developers at php[tek] 2024
 
"LLMs for Python Engineers: Advanced Data Analysis and Semantic Kernel",Oleks...
"LLMs for Python Engineers: Advanced Data Analysis and Semantic Kernel",Oleks..."LLMs for Python Engineers: Advanced Data Analysis and Semantic Kernel",Oleks...
"LLMs for Python Engineers: Advanced Data Analysis and Semantic Kernel",Oleks...
 
Artificial intelligence in cctv survelliance.pptx
Artificial intelligence in cctv survelliance.pptxArtificial intelligence in cctv survelliance.pptx
Artificial intelligence in cctv survelliance.pptx
 
Ensuring Technical Readiness For Copilot in Microsoft 365
Ensuring Technical Readiness For Copilot in Microsoft 365Ensuring Technical Readiness For Copilot in Microsoft 365
Ensuring Technical Readiness For Copilot in Microsoft 365
 
AI as an Interface for Commercial Buildings
AI as an Interface for Commercial BuildingsAI as an Interface for Commercial Buildings
AI as an Interface for Commercial Buildings
 
Understanding the Laravel MVC Architecture
Understanding the Laravel MVC ArchitectureUnderstanding the Laravel MVC Architecture
Understanding the Laravel MVC Architecture
 
Scanning the Internet for External Cloud Exposures via SSL Certs
Scanning the Internet for External Cloud Exposures via SSL CertsScanning the Internet for External Cloud Exposures via SSL Certs
Scanning the Internet for External Cloud Exposures via SSL Certs
 
My INSURER PTE LTD - Insurtech Innovation Award 2024
My INSURER PTE LTD - Insurtech Innovation Award 2024My INSURER PTE LTD - Insurtech Innovation Award 2024
My INSURER PTE LTD - Insurtech Innovation Award 2024
 
Transcript: New from BookNet Canada for 2024: BNC CataList - Tech Forum 2024
Transcript: New from BookNet Canada for 2024: BNC CataList - Tech Forum 2024Transcript: New from BookNet Canada for 2024: BNC CataList - Tech Forum 2024
Transcript: New from BookNet Canada for 2024: BNC CataList - Tech Forum 2024
 
Automating Business Process via MuleSoft Composer | Bangalore MuleSoft Meetup...
Automating Business Process via MuleSoft Composer | Bangalore MuleSoft Meetup...Automating Business Process via MuleSoft Composer | Bangalore MuleSoft Meetup...
Automating Business Process via MuleSoft Composer | Bangalore MuleSoft Meetup...
 
Kotlin Multiplatform & Compose Multiplatform - Starter kit for pragmatics
Kotlin Multiplatform & Compose Multiplatform - Starter kit for pragmaticsKotlin Multiplatform & Compose Multiplatform - Starter kit for pragmatics
Kotlin Multiplatform & Compose Multiplatform - Starter kit for pragmatics
 
Streamlining Python Development: A Guide to a Modern Project Setup
Streamlining Python Development: A Guide to a Modern Project SetupStreamlining Python Development: A Guide to a Modern Project Setup
Streamlining Python Development: A Guide to a Modern Project Setup
 
Tech-Forward - Achieving Business Readiness For Copilot in Microsoft 365
Tech-Forward - Achieving Business Readiness For Copilot in Microsoft 365Tech-Forward - Achieving Business Readiness For Copilot in Microsoft 365
Tech-Forward - Achieving Business Readiness For Copilot in Microsoft 365
 
Story boards and shot lists for my a level piece
Story boards and shot lists for my a level pieceStory boards and shot lists for my a level piece
Story boards and shot lists for my a level piece
 
My Hashitalk Indonesia April 2024 Presentation
My Hashitalk Indonesia April 2024 PresentationMy Hashitalk Indonesia April 2024 Presentation
My Hashitalk Indonesia April 2024 Presentation
 

Slideshare notes about measures of central tendancy(mean,median and mode)

  • 1. PRESENTATION OF SNM ► Fiston roll no. 25 ► MARWADI UNIVERSITY ► B.CHEMICAL ENG, 4TH SEM
  • 2. CONTENT: ► CENTRAL TENDENCIES ► MEAN ► MODE ► MEDIAN ► HORMONIC MEAN AND GEOMETRIC MEAN ► THEIR MERTS AND DIMERTS ► THEIR APPLICATIONS
  • 3. MEASURES OF CENTRAL TENDANCY: • Statisticians have developed four different methods for measuring central tendency; 1.The Mean 2.The Median 3.The Mode 4.HARMONIC MEAN AND
  • 4. Continue .. • A measure of central tendency is a single value that attempts to describe a set of data by identifying the central position within that set of data. As such, measures of central tendency are sometimes called measures of central location.
  • 5. Continue .. • They are also classed as summary statistics. • The mean called the likely the average) measure (often is most of centr al tendency that you are most familiar with, but there are others, such as the median and the mode.
  • 6. Continue .. • The mean, median and mode,harmonic and geometric mean are all valid measures of central tendency, but under different conditions, some measures of central tendency become more appropriate to use than others. • In the following sections, we will look at the mean, median and mode, and learn how to calculate them and under what conditions they are most appropriate to be used.
  • 7. 1. Mean The mean is the sum of the value of each observation in a dataset divided by the number of observations. This is also known as the arithmetic average. The mean, often called the average, of a numerical set of data, is simply the sum of the data values divided by the number of values. The mean is the balance point of a distribution. The calculations for the mean of a sample and the total population are done in the same way. However, the mean of a population is constant, while the mean of a sample varies from sample to sample
  • 8. Continued The mean of a sample or a population is computed by adding all of the observations and dividing by the number of observations. Population mean = μ = ΣX / N OR Sample mean = x = Σx / n where ΣX is the sum of all the population observations, N is the number of population observations, Σx is the sum of all the sample observations, and n is the number of sample observations.
  • 9. Continued When statisticians talk about the mean of a population, they use the Greek letter μ to refer to the mean score. When they talk about the mean of a sample, statisticians use the symbol x to refer to the mean score.
  • 10. Arihtmetic Mean (group-data) : Formula: A.M=ΣfX/Σf where X = Individual value f = Frequency The symbol of Σ is pronounced as sigma and is used to represent the sum of number.
  • 11. Ungrouped data Ungrouped data is the opposite of grouped data with only one possible answer. For example: The ages of 200 people entering a park on a Saturday afternoon. The ages are: 27, 8, 10, 49 etc.
  • 12. Arithmetic Mean (ungroup- data) Formula: Mean = sum of elements / number of elements = a1+a2+a3+.....+an/n Arithmetic Mean = ΣX/n where X = Individual value n = Total number of values
  • 13. Advantages of Mean: • • • It is easy to understand & simple calculate. It is based on all the values. It is easy to understand the arithmetic average even if some of the details of the data are lacking.
  • 14. Disadvantages of Mean: • • • • It is affected by extreme values. It cannot be calculated for open end classes. It cannot be located graphically It gives misleading conclusions.
  • 15. 2.The Median • The second measure of central tendencies • The goal of the median is to locate the midpoint of the distribution. • There are no specific symbols or notions to identify the median
  • 16. Conti. … • The median is simply identified by the word median. • In addition, the definition and the computations for the median are identical for a sample and for a population.
  • 17. The Definition • If the scores in a distribution are listed in order from smallest to largest • The median is the midpoint of the list • More specifically, the median is the point on the measurement scale below which 50% of the scores in the distribution are located.
  • 18. Finding the Median for most distribution • The scores are divided into equal-sized group. • We are not locating the midpoint from highest to lowest X values • To find the median, list the scores in order from smallest to largest
  • 19. Conti. … • Begin with the smallest score and count the score as you move up the list • The median is the first point you reach that is greater than of 50% of the score in the distribution • The median can be equal to a score in the list or it can be a point between two scores
  • 20. Conti. … • Notice that the median is not algebraically defined (there is no equation for computing the median) • Means that there is a degree of subjectivity in determining the exact value
  • 24. Merits 1. Simplicity – It is very simple measure of central tendency effect of 1. Free fromthe extreme values 2. Real value • Representative compared to value as arithmeticmean average, the value of which may not exist in the series at all.
  • 25. Demerits Unrealistic – When the median is located somewhere between the two middle values, it remains only an approximate measure, not a precise value.
  • 26. Cont. … Lack of representative character – limited representative character as it is not based on all the items in the series. Lack of algebraic treatment – Arithmetic mean is capable of further algebraic treatment, but median is not.
  • 27. 3.Mode Mode is the most frequent value or score in the distribution. It is defined as that value of the item in a series. It is denoted by the capital letter Z. Highest point of the frequencies distribution curve.
  • 28. Merits of Mode : • • • • • Mode is readily comprehensible and easily calculated It is the best representative of data It is not at all affected by extreme value. The valueof mode can also be determined graphically. It is usually an actual value of an
  • 29. Demerits of Mode • • It is not based on all observations. It is not capable of further mathematical manipulation. • Mode is extent affected to a great by sampling • fluctuations. Choice of grouping has great influence on the value of mode.
  • 30. Conclusion: A measure of central tendency is a measure that tells us where the middle of a bunch of data lies. Mean is the most common measure of central tendency. It is simply the sum of the numbers divided by the number of numbers in a set of data. This is also known as average.
  • 31. Continue… ► Median is the number present in the middle when the numbers in a set of data are arranged in ascending or descending order.. ► Mode is the value that occurs most frequently in a set of data.