1. Please refer to important disclosures at the end of this report 1
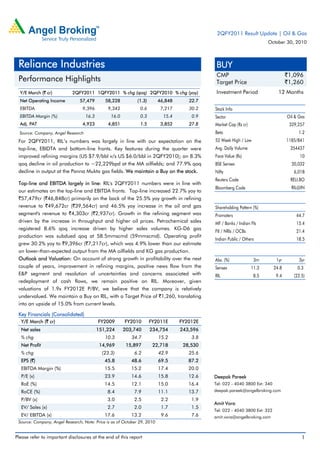
Y/E March (` cr) 2QFY2011 1QFY2011 % chg (qoq) 2QFY2010 % chg (yoy)
Net Operating Income 57,479 58,228 (1.3) 46,848 22.7
EBITDA 9,396 9,342 0.6 7,217 30.2
EBITDA Margin (%) 16.3 16.0 0.3 15.4 0.9
Adj. PAT 4,923 4,851 1.5 3,852 27.8
Source: Company, Angel Research
For 2QFY2011, RIL’s numbers was largely in line with our expectation on the
top-line, EBIDTA and bottom-line fronts. Key features during the quarter were
improved refining margins (US $7.9/bbl v/s US $6.0/bbl in 2QFY2010); an 8.3%
qoq decline in oil production to ~22,229bpd at the MA oilfields; and 77.9% qoq
decline in output at the Panna Mukta gas fields. We maintain a Buy on the stock.
Top-line and EBITDA largely in line: RIL's 2QFY2011 numbers were in line with
our estimates on the top-line and EBITDA fronts. Top-line increased 22.7% yoy to
`57,479cr (`46,848cr) primarily on the back of the 25.5% yoy growth in refining
revenue to `49,672cr (`39,564cr) and 46.5% yoy increase in the oil and gas
segment's revenue to `4,303cr (`2,937cr). Growth in the refining segment was
driven by the increase in throughput and higher oil prices. Petrochemical sales
registered 8.6% qoq increase driven by higher sales volumes. KG-D6 gas
production was subdued qoq at 58.5mmscmd (59mmscmd). Operating profit
grew 30.2% yoy to `9,396cr (`7,217cr), which was 4.9% lower than our estimate
on lower-than-expected output from the MA oilfields and KG gas production.
Outlook and Valuation: On account of strong growth in profitability over the next
couple of years, improvement in refining margins, positive news flow from the
E&P segment and resolution of uncertainties and concerns associated with
redeployment of cash flows, we remain positive on RIL. Moreover, given
valuations of 1.9x FY2012E P/BV, we believe that the company is relatively
undervalued. We maintain a Buy on RIL, with a Target Price of `1,260, translating
into an upside of 15.0% from current levels.
Key Financials (Consolidated)
Y/E March (` cr) FY2009 FY2010 FY2011E FY2012E
Net sales 151,224 203,740 234,754 243,596
% chg 10.3 34.7 15.2 3.8
Net Profit 14,969 15,897 22,718 28,530
% chg (23.3) 6.2 42.9 25.6
EPS (`) 45.8 48.6 69.5 87.2
EBITDA Margin (%) 15.5 15.2 17.4 20.0
P/E (x) 23.9 14.6 15.8 12.6
RoE (%) 14.5 12.1 15.0 16.4
RoCE (%) 8.4 7.9 11.1 13.7
P/BV (x) 3.0 2.5 2.2 1.9
EV/ Sales (x) 2.7 2.0 1.7 1.5
EV/ EBITDA (x) 17.6 13.2 9.6 7.6
Source: Company, Angel Research; Note: Price is as of October 29, 2010
BUY
CMP `1,096
Target Price `1,260
Investment Period 12 Months
Stock Info
Sector
Bloomberg Code
Shareholding Pattern (%)
Promoters 44.7
MF / Banks / Indian Fls 15.4
FII / NRIs / OCBs 21.4
Indian Public / Others 18.5
Abs. (%) 3m 1yr 3yr
Sensex 11.3 24.8 0.3
RIL 8.5 9.4 (22.5)
6,018
Reuters Code RELI.BO
RIL@IN
Avg. Daily Volume 354437
Face Value (Rs) 10
BSE Sensex 20,032
Oil & Gas
Market Cap (Rs cr) 329,257
Beta 1.2
52 Week High / Low 1185/841
Nifty
Deepak Pareek
Tel: 022 - 4040 3800 Ext: 340
deepak.pareek@angelbroking.com
Amit Vora
Tel: 022 - 4040 3800 Ext: 322
amit.vora@angelbroking.com
Reliance Industries
Performance Highlights
2QFY2011 Result Update | Oil & Gas
October 30, 2010
3. Reliance Industries | 2QFY2011 Result Update
October 30, 2010 3
Exhibit 3: 2QFY2011 Actual v/s Estimates
(` cr) Estimates Actual Variation (%)
Net Operating Income 59,654 57,479 (3.6)
EBITDA 9,884 9,396 (4.9)
EBITDA Margin %) 16.6 16.3 0.3
PBT 6,348 6,149 (3.1)
Adj. PAT 5,095 4,923 (3.4)
Source: Company, Angel Research
Top-line largely in line with estimates: RIL's 2QFY2011 numbers were in line with
our estimates on the top-line fronts. The company's top line increased by 22.7%
yoy to `57,479cr (`46,848cr) primarily on the back of 25.5% yoy growth in
refining revenue to `49,672cr (RS39,564cr) and 46.5% yoy increase in the oil and
gas segment's revenue to `4,303cr (`2,937cr). Growth in the refining segment was
driven by the increase in throughput coupled with increased crude oil prices. The
petrochemical segment registered an 8.6% qoq increase in top-line, driven by
higher sales volumes of ethylene, propylene and polypropylene. Crude oil
processed during the quarter was higher by 40.8% yoy to 16.9mn tonnes (12.0mn
tonnes). KG-D6 gas production was subdued qoq with average production at
58.5mmscmd (59mmscmd). Operating profit grew 30.2% yoy to `9,396cr
(`7,217cr), which was 4.9% lower than our estimate on account of lower-than-
expected output from MA oilfields and KG gas production.
Exhibit 4: Sales growth trend
Source: Company, Angel Research
Refining leads to improvement in margins qoq: During the quarter, RIL
reported GRMs of US $7.9/bbl (US $6.0/bbl), in line with our expectation of
US $8.0/bbl. Benchmark complex Singapore margins, during the quarter, stood at
around US $4.2/bbl. Thus, RIL managed to earn a spread of US $3.7/bbl.
Petrochemical deltas were stable on a sequential basis with PP deltas remaining
stable on the back of sustained demand. Growth in the petrochemical segment's
EBIT on a qoq basis was on account of higher production volumes. The oil and
gas segment's EBIT margin declined by 153bp qoq to 39.6% (41.2%) due to
production shutdown at PMT and lower output at the MA oilfields. Overall,
operating profit grew by 30.2% yoy to `9,396cr (`7,217cr), which was 4.9% lower
4.8
92.3
120.7
86.7
22.7
-
20.0
40.0
60.0
80.0
100.0
120.0
140.0
-
10,000
20,000
30,000
40,000
50,000
60,000
70,000
2QFY10 3QFY10 4QFY10 1QFY11 2QFY11
(%)
(`cr)
Operating Revenues Operating Revenues growth (RHS)
4. Reliance Industries | 2QFY2011 Result Update
October 30, 2010 4
than our estimate on account of lower-than-expected output from MA oilfields and
KG gas production.
Exhibit 5: EBIT break-up
Source: Company, Angel Research
Exhibit 6: Operating performance trend
Source: Company, Angel Research
Depreciation increases: Depreciation during the quarter exceeded our estimate,
spiking 38.9% yoy on account of the additional depreciation of the SEZ refinery
and KG-basin gas facility. Interest expenditure was largely flat qoq at `542cr.
Other income at `672cr declined 6.9% qoq and came in line with our estimate of
`675cr.
PAT grew 27.8%: PAT grew 27.8% yoy to `4,923cr (`3,852cr), which was in
line with our expectation of `5,095cr. The key rationale for the marginal
deviation in profitability from our estimate was the lower-than-anticipated
production at the MA oilfield and the KG basin.
Exhibit 7: PAT growth trend
Source: Company, Angel Research
0%
20%
40%
60%
80%
100%
1QFY09
2QFY09
3QFY09
4QFY09
1QFY10
2QFY10
3QFY10
4QFY10
1QFY11
2QFY11
Petrochemicals Refining Oil and gas Others
20.5
15.4
13.8
15.9
16.0 16.3
-
4.0
8.0
12.0
16.0
20.0
24.0
-
2,000
4,000
6,000
8,000
10,000
1QFY10 2QFY10 3QFY10 4QFY10 1QFY11 2QFY11
(%)
(`cr)
OperatingProfit OperatingMargins (RHS)
(6.4)
15.8
19.1
32.3
27.8
(10.0)
(5.0)
-
5.0
10.0
15.0
20.0
25.0
30.0
35.0
-
1,000
2,000
3,000
4,000
5,000
6,000
2QFY10 3QFY10 4QFY10 1QFY11 2QFY11
(%)
(`cr)
PAT PAT growth (RHS)
5. Reliance Industries | 2QFY2011 Result Update
October 30, 2010 5
Segment-wise Performance
Refining and Marketing (R&M): Crude processing stood at 16.91mn tonnes
(15.63mn tonnes), up 8.2% yoy, with the refinery reporting capacity utilisation of
109.1%. Crude processing was higher on account of ramp up in RIL’s SEZ refinery.
Increase in crude throughput and higher crude oil prices led to 25.5% yoy increase
in R&M revenues to `49,672cr (`39,564cr). On the margins front, RIL reported
GRMs of US $7.9/bbl (US $6.0/bbl) as against our expectation of US $8.0/bbl.
Thus, refining margins were in line with our expectations. Singapore margins
during the quarter averaged at US $4.2/bbl. Thus, RIL managed to earn a spread
of US $3.7/bbl over the same. Improvement in the refining margins could be
traced to improved product spread of gasoil, jet fuel and SKO in the Asian
markets. Moreover, the increase in heavy-light crude oil spread also increased
refining margins during the quarter. Export of refined products stood at 19.7MMT
(US $13.4bn) in 2QFY2011 as against 13.2MMT (US $7.5bn) in 2QFY2010 on
incremental export volumes from the SEZ refinery.
Exhibit 8: RIL v/s Benchmark Singapore GRMs
Source: Company, Angel Research
Exhibit 9: Capacity utilisation trend
Source: Company, Angel Research
-
2.0
4.0
6.0
8.0
10.0
12.0
14.0
16.0
18.0
1QFY08
2QFY08
3QFY08
4QFY08
1QFY09
2QFY09
3QFY09
4QFY09
1QFY10
2QFY10
3QFY10
4QFY10
1QFY11
2QFY11
(US$/bbl)
RIL GRMs Singapore GRMs
7.0
9.0
11.0
13.0
15.0
17.0
20.0
40.0
60.0
80.0
100.0
120.0
1QFY08
2QFY08
3QFY08
4QFY08
1QFY09
2QFY09
3QFY09
4QFY09
1QFY10
2QFY10
3QFY10
4QFY10
1QFY11
2QFY11
(mntonnes)
(%)
Capacity Utilisation Crude Processing (RHS)
6. Reliance Industries | 2QFY2011 Result Update
October 30, 2010 6
Petrochemicals: The petrochemical segment revenues grew 13.2% yoy to
`15,096cr (`13,340cr) due to higher crude and product prices yoy. However,
petrochemical volumes were lower on a yoy basis. The segment top-line growth of
8.6% qoq was driven by higher sales volumes of ethylene, propylene and
polypropylene. Petrochemical deltas were stable on a sequential basis with PP
deltas remaining stable on the back of sustained demand. EBIT margins of the
segment declined marginally by 21bp qoq to 14.6% (14.8%). PP delta, which
stood at US $100/MT during 1QFY2011, saw marginal softening to US $94/MT
during the quarter. However, margins were weak in the HDPE-naphtha segment at
US $485/MT v/s US $546/MT during 1QFY2011. However, some strength was
seen in the PVC-EDC segment with margins improving to US $410/MT from
US $399/MT due to lower feedstock cost. Margins in the chemical segment were
strong during the quarter.
Oil & Gas: Oil and gas EBIT registered yoy growth of 39.2% to `1,706cr
(`1,226cr) on account of increase in the KG basin gas and oil production.
However, EBIT of the segment declined 11.2% qoq on production shutdown at the
Panna Mukta gas fields during the quarter coupled with lower oil production at the
MA oilfields on qoq basis. Crude oil production from the KG basin decreased to
22,229bpd from around 24,249bpd in 1QFY2011. RIL’s KG-D6 gas production
during the quarter averaged at 58.5mmscmd (59mmscmd in 1QFY2011) and was
largely flat on qoq basis. Production from the Panna Mukta gas fields was lower by
77.9% qoq to 111mmscm from 502mmscm in 1QFY2011. The decline was on
account of production shutdown due to technical issues, which has been resolved
now, thus production is likely to be normal during 3QFY2011. EBIT margins of the
segment registered a 153bp qoq decline on account of production shutdown at the
Panna Mukta gas fields along with lower oil production at the MA oilfields.
Investment Arguments
Refining margins to improve going ahead: Refining margins have been under
pressure over the last eight quarters due to decline in demand and addition of the
new refining capacity. However, we believe that the lower margins scenario is
unsustainable as the average operating cost of refineries stands close to
US $3.5-4.0/bbl. We expect the benchmark Singapore margins to average around
US $4.5-5.0/bbl during the next fiscal driven by increase in product demand. This,
coupled with the improvement in light-heavy crude differential would improve the
spreads for complex refiners such as RIL. Thus, the worst in terms of refining
margins is behind us. Moreover, improvement in demand in transportation fuels in
North America and Europe is likely to further aid margin expansion of complex
refineries such as RIL.
Cash redeployment concerns easing: Certain section of the market voiced its
concerns about sustenance of RIL’s profitability growth beyond FY2012 on account
of limited growth opportunities and significant cash likely to be generated by the
company. However, we believe that RIL has already made significant investments
in new businesses like shale gas and telecom, and is likely to crystallise its plan to
foray into the power segment. Thus, on account of the same, the cash
redeployment concerns have been addressed to a large extent. Moreover, the
proposed plans to increase capacity of the petrochemical segment and addition of
7. Reliance Industries | 2QFY2011 Result Update
October 30, 2010 7
the coker in the refining segment are likely to further consolidate the company’s
position in its existing businesses.
Outlook and Valuation
RIL reported good performance for 2QFY2011 on account of improvement in
refining margins. On account of the ongoing recovery in the global economy,
demand for petroleum and petrochemical products is set to improve. Thus, we
expect the GRM’s to improve from current levels, in turn leading to an
improvement in RIL’s profitability.
On the petrochemical front, margins are likely to be maintained despite the
addition of new capacities in the Middle East and China due to the integrated
nature of RIL’s business. Moreover, the strength in the polyester margins is likely to
cushion the segmental margins to a large extent for RIL. We expect increase in gas
production to be driven by bottom-line growth over the next couple of years. This,
coupled with the company’s foray into newer businesses is likely to keep it in strong
growth trajectory.
Petrochemical segment
In spite of the slowdown in the global petrochemical market, the Indian market has
been fairly resistant to the slowdown as is evident from the 10% yoy demand
growth during 1HFY2011. On account of the same, capacity utilisation for the
domestic players continued to be on the higher end. This is despite the significant
capacity additions globally during the last 1-1.5 years, resulting in slipping of
global ethylene capacity utilisation rate to 80%.
On account of reduction in the utilisation rates, the petrochemical industry has
witnessed significant margin pressure, resulting in compression of product deltas of
the ethylene, HDPE and polypropylene segments. However, we expect the margin
pressure to ease significantly during the next fiscal as a large part of capacity
expansion is behind us. With robust demand expectation from India and China
likely to continue going ahead, we expect the global demand supply equation to
narrow to a large extent. On account of the same, we expect RIL to improve its
margins due to the integrated nature of its operations and strong domestic
demand. This coupled with its fully-integrated business model, high operating rates
and focus on specialty products are likely to ensure that RIL earns better margins
over peers.
Over the last couple of quarters, strength in the polyester margins has helped
maintain margins of the petrochemical and polyester segments leading to better
segmental performance. We expect the trend to continue as we foresee the
polyester margins to stay strong over the next 3-4 quarters on account of high
cotton prices (due to low inventory levels) and tight PTA markets.
Refining segment
We expect refining margins to improve driven by improving demand outlook
(particularly of refiners with focus on middle distillates). Thus, RIL with a significant
part of its product slates titled towards middle distillates is likely to be a key
beneficiary of this trend. We had earlier highlighted that a lower margins scenario
was largely an unsustainable phenomenon as the average operating cost of
8. Reliance Industries | 2QFY2011 Result Update
October 30, 2010 8
refinery stands close to US $3.5-4.0/bbl. We expect the benchmark Singapore
margins to average around US $4.5-5.0/bbl during the next fiscal driven by
increase in product demand. This, coupled with the improvement in light-heavy
crude differential is likely to improve the spreads for complex refiners such as RIL.
E&P segment
We expect the E&P segment to be the key driver of RILs’ profitability growth over
the coming few years. RIL’s stock performance has been affected by the stagnant
gas production at the KG basin and we expect the gas production to remain at the
current levels till end of 1QFY2012 and foresee full ramp up of the same in
FY2012. RIL has also started pre-development plans for the D6 satellite fields,
which is likely to be submitted over the next couple of quarters. Moreover, we
expect RIL’s oil production to further increase to 40,000bpd during 2HFY2012.
We expect news flow associated with the E&P segment to be positive catalysts for
the stock. RIL has planned E&P activities in the prospective Cauvery, Mahanadi and
Kerala Konkan basins. Any new discoveries from these blocks (particularly D9, D3
and D4) will lend a fillip to RIL’s valuations. Overall, the E&P segment is likely to be
one of the key growth areas for RIL going ahead.
Conclusion
On account of strong growth in profitability over the next couple of years,
improvement in refining and petrochemical margins, positive news flow from the
E&P segment and resolution of uncertainties and concerns associated with
redeployment of cash flows, we remain positive on RIL. Given its valuation of 1.9x
FY2012E P/BV, we believe that the company is relatively undervalued. We
maintain a Buy on RIL, with a Target Price of `1,260, translating into an upside of
15.0% from current levels.
Exhibit 10: Key Assumptions
Particulars FY2011E FY2012E
Exchange rate (`/USD) 46.5 45.5
Refining capacity (MMT) 62.0 62.0
Production (MMT) 66.5 67.0
Capacity Utilisation 107.3% 108.1%
Blended GRMs (US $/bbl) 8.6 10.5
KG -D6 Gas production (mmscmd) 60.0 76.0
KG -D6 Gas realisations (US$/mmbtu) 4.2 4.2
Oil production (kbpd) 35.0 40.0
Source: Company, Angel Research
14. Reliance Industries | 2QFY2011 Result Update
October 30, 2010 14
Research Team Tel: 022 - 4040 3800 E-mail: research@angeltrade.com Website: www.angeltrade.com
DISCLAIMER
This document is solely for the personal information of the recipient, and must not be singularly used as the basis of any investment
decision. Nothing in this document should be construed as investment or financial advice. Each recipient of this document should make
such investigations as they deem necessary to arrive at an independent evaluation of an investment in the securities of the companies
referred to in this document (including the merits and risks involved), and should consult their own advisors to determine the merits and
risks of such an investment.
Angel Broking Limited, its affiliates, directors, its proprietary trading and investment businesses may, from time to time, make
investment decisions that are inconsistent with or contradictory to the recommendations expressed herein. The views contained in this
document are those of the analyst, and the company may or may not subscribe to all the views expressed within.
Reports based on technical and derivative analysis center on studying charts of a stock's price movement, outstanding positions and
trading volume, as opposed to focusing on a company's fundamentals and, as such, may not match with a report on a company's
fundamentals.
The information in this document has been printed on the basis of publicly available information, internal data and other reliable
sources believed to be true, but we do not represent that it is accurate or complete and it should not be relied on as such, as this
document is for general guidance only. Angel Broking Limited or any of its affiliates/ group companies shall not be in any way
responsible for any loss or damage that may arise to any person from any inadvertent error in the information contained in this report.
Angel Broking Limited has not independently verified all the information contained within this document. Accordingly, we cannot testify,
nor make any representation or warranty, express or implied, to the accuracy, contents or data contained within this document. While
Angel Broking Limited endeavours to update on a reasonable basis the information discussed in this material, there may be regulatory,
compliance, or other reasons that prevent us from doing so.
This document is being supplied to you solely for your information, and its contents, information or data may not be reproduced,
redistributed or passed on, directly or indirectly.
Angel Broking Limited and its affiliates may seek to provide or have engaged in providing corporate finance, investment banking or
other advisory services in a merger or specific transaction to the companies referred to in this report, as on the date of this report or in
the past.
Neither Angel Broking Limited, nor its directors, employees or affiliates shall be liable for any loss or damage that may arise from or in
connection with the use of this information.
Note: Please refer to the important `Stock Holding Disclosure' report on the Angel website (Research Section). Also, please
refer to the latest update on respective stocks for the disclosure status in respect of those stocks. Angel Broking Limited and
its affiliates may have investment positions in the stocks recommended in this report.
Disclosure of Interest Statement RIL
1. Analyst ownership of the stock No
2. Angel and its Group companies ownership of the stock Yes
3. Angel and its Group companies' Directors ownership of the stock No
4. Broking relationship with company covered No
Note: We have not considered any Exposure below ` 1 lakh for Angel, its Group companies and Directors.
Ratings (Returns): Buy (> 15%) Accumulate (5% to 15%) Neutral (-5 to 5%)
Reduce (-5% to 15%) Sell (< -15%)