call girls in Nand Nagri (DELHI) 🔝 >༒9953330565🔝 genuine Escort Service 🔝✔️✔️
Tcs 2 qfy2011-221010
1. Please refer to important disclosures at the end of this report 1
(` cr) 2QFY11 1QFY11 % chg (qoq) 2QFY10 % chg (yoy)
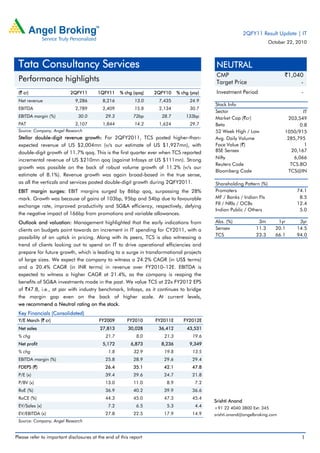
Net revenue 9,286 8,216 13.0 7,435 24.9
EBITDA 2,789 2,409 15.8 2,134 30.7
EBITDA margin (%) 30.0 29.3 72bp 28.7 133bp
PAT 2,107 1,844 14.2 1,624 29.7
Source: Company, Angel Research
Stellar double-digit revenue growth: For 2QFY2011, TCS posted higher-than-
expected revenue of US $2,004mn (v/s our estimate of US $1,927mn), with
double-digit growth of 11.7% qoq. This is the first quarter ever when TCS reported
incremental revenue of US $210mn qoq (against Infosys at US $111mn). Strong
growth was possible on the back of robust volume growth of 11.2% (v/s our
estimate of 8.1%). Revenue growth was again broad-based in the true sense,
as all the verticals and services posted double-digit growth during 2QFY2011.
EBIT margin surges: EBIT margins surged by 86bp qoq, surpassing the 28%
mark. Growth was because of gains of 103bp, 95bp and 54bp due to favourable
exchange rate, improved productivity and SG&A efficiency, respectively, defying
the negative impact of 166bp from promotions and variable allowances.
Outlook and valuation: Management highlighted that the early indications from
clients on budgets point towards an increment in IT spending for CY2011, with a
possibility of an uptick in pricing. Along with its peers, TCS is also witnessing a
trend of clients looking out to spend on IT to drive operational efficiencies and
prepare for future growth, which is leading to a surge in transformational projects
of large sizes. We expect the company to witness a 24.2% CAGR (in US$ terms)
and a 20.4% CAGR (in INR terms) in revenue over FY2010–12E. EBITDA is
expected to witness a higher CAGR at 21.4%, as the company is reaping the
benefits of SG&A investments made in the past. We value TCS at 22x FY2012 EPS
of `47.8, i.e., at par with industry benchmark, Infosys, as it continues to bridge
the margin gap even on the back of higher scale. At current levels,
we recommend a Neutral rating on the stock.
Key Financials (Consolidated)
Y/E March (` cr) FY2009 FY2010 FY2011E FY2012E
Net sales 27,813 30,028 36,412 43,531
% chg 21.7 8.0 21.3 19.6
Net profit 5,172 6,873 8,236 9,349
% chg 1.8 32.9 19.8 13.5
EBITDA margin (%) 25.8 28.9 29.6 29.4
FDEPS (`) 26.4 35.1 42.1 47.8
P/E (x) 39.4 29.6 24.7 21.8
P/BV (x) 13.0 11.0 8.9 7.2
RoE (%) 36.9 40.2 39.9 36.6
RoCE (%) 44.3 45.0 47.3 45.4
EV/Sales (x) 7.2 6.5 5.3 4.4
EV/EBITDA (x) 27.8 22.5 17.9 14.9
Source: Company, Angel Research
NEUTRAL
CMP `1,040
Target Price -
Investment Period -
Stock Info
Shareholding Pattern (%)
Promoters 74.1
MF / Banks / Indian Fls 8.5
FII / NRIs / OCBs 12.4
Indian Public / Others 5.0
Abs. (%) 3m 1yr 3yr
Sensex 11.3 20.1 14.5
TCS 23.3 66.1 94.0
Sector IT
Market Cap (`cr) 203,549
Beta 0.8
52 Week High / Low 1050/915
Avg. Daily Volume 285,795
Face Value (`) 1
Bloomberg Code TCS@IN
BSE Sensex 20,167
Nifty 6,066
Reuters Code TCS.BO
Srishti Anand
+91 22 4040 3800 Ext: 345
srishti.anand@angelbroking.com
Tata Consultancy Services
Performance highlights
2QFY11 Result Update | IT
October 22, 2010
2. TCS | 2QFY11 Result Update
October 22, 2010 2
Exhibit 1: 2QFY2011 performance (Consolidated, US GAAP)
(` cr) 2QFY2011 1QFY2011 % chg(qoq) 2QFY2010 % chg(yoy) 1HFY2011 1HFY2010 % chg(yoy)
Net revenue 9,286 8,216 13.0 7,435 24.9 17,503 14,641 19.5
Cost of revenue 4,945 4,398 12.4 3,922 26.1 9,343 7,742 20.7
Gross profit 4,342 3,819 13.7 3,514 23.6 8,160 6,899 18.3
SG&A expense 1,552 1,411 10.0 1,379 12.5 2,963 2,804 5.7
EBITDA 2,789 2,408 15.8 2,134 30.7 5,197 4,095 26.9
Depreciation and amortisation 189 178 5.9 181 4.1 367 354 3.6
EBIT 2,601 2,230 16.6 1,953 33.2 4,831 3,742 29.1
Other income 34 83 (59) (14) 117 5
PBT 2,635 2,313 13.9 1,939 35.9 4,948 3,747 32.1
Income taxes 499 442 12.9 291 71.6 942 556 69.2
PAT 2,135 1,871 14.1 1,648 29.6 4,006 3,190 25.6
Minority interest 29 27 5.9 24 20.5 56 47 20.4
PAT 2,107 1,843 14.3 1,624 29.7 3,950 3,144 25.6
Diluted EPS 11 9 14.2 8 29.7 20 16 25.7
Gross margin (%) 46.8 46.5 28 bp 47.3 (50)bp 46.6 47.1 (50)bp
EBITDA margin (%) 30.0 29.3 73 bp 28.7 133 bp 29.7 28.0 172bp
EBIT margin (%) 28.0 27.1 86 bp 26.3 174 bp 27.6 25.6 204 bp
PAT margin (%) 22.9 22.5 37 bp 22.2 71 bp 22.7 21.8 95 bp
Source: Company, Angel Research
Exhibit 2: 2QFY11– Angel v/s actual estimates
(` cr) Angel estimates Actual Variation (%)
Net revenue 8,958.5 9,285.3 3.6
EBIT margin (%) 27.1 28.0 86bp
PAT 1,990.1 2,106 5.8
Source: Company, Angel Research
Robust broad-based double-digit growth
TCS continues to lead the Tier-I IT pack in terms of volume growth, in spite of
having the highest manpower base. In 2QFY2011, TCS posted volume growth of
11.2% qoq, way ahead of its peers who recorded 6.6–7.4% qoq volume growth.
Exhibit 3: Volume performance v/s Tier-I IT companies
Source: Company, Angel Research
(4.0)
(2.0)
0.0
2.0
4.0
6.0
8.0
10.0
12.0
2QFY10 3QFY10 4QFY10 1QFY11 2QFY11
%QoQ
Infosys TCS HCL Tech Wipro
3. TCS | 2QFY11 Result Update
October 22, 2010 3
The strong double-digit volume growth of 11.2% was last witnessed in 2QFY2007,
which resulted in revenue growing to US $2bn. In fact, this is the first-ever quarter
when the company added incremental revenue of US $200mn in just one quarter,
almost double of US $108mn added in 1QFY2011. This stellar performance was
backed by strong growth across the company’s business service segments.
Discretionary services like business intelligence, enterprise solutions, assurance
services and engineering and industrial services reported double-digit growth of
15.8%, 17.4%, 15.2% and 14%, respectively, increasing their combined revenue
share by 100bp qoq to 27.4%. Infrastructure management services emerged as a
strong growth driver, growing by whopping 20.7% qoq and increasing its revenue
contribution by 70bp qoq to 9.4%.
Exhibit 4: Revenue growth (Service wise)
% to revenue % chg (qoq) % chg (yoy)
IT solutions and services
ADM 46.8 9.1 16.9
Business intelligence 5.6 15.8 23.3
Enterprise solutions 10.3 17.4 21.2
Assurance services 6.6 15.2 35.3
Engineering and industrial services 4.9 14.0 21.3
Infrastructure services 9.4 20.7 34.6
Global consulting 2.1 11.7 (0.2)
Asset leveraged solutions 3.4 2.6 1.0
BPO 10.9 8.7 12.7
Source: Company, Angel Research
Again, industry wise, growth was broad-based with all the segments, i.e. even the
troubled telecom sector, posting double-digit growth during 2QFY2011.
TCS’s anchor sector, BFSI, which led the recovery in 3QFY2010, continued to be
strong with 10% qoq growth. The telecom sector surprised positively, growing by
whopping 12.6% qoq. The retail and distribution sector surged by 10.7% qoq and
the manufacturing sector reported strong 11.7% qoq growth.
Exhibit 5: Revenue growth (Industry wise)
% to revenue % qoq % yoy
Banking, financial service and insurance (BFSI) 44.0 10.0 17.8
Manufacturing 7.4 11.7 6.0
Telecom 12.8 12.6 25.7
Life sciences and healthcare 5.1 9.6 (0.6)
Retail and distribution 10.9 10.7 5.3
Transportation 3.2 15.3 8.7
Energy and utilities 4.3 45.6 54.9
Media and entertainment 2.0 17.6 13.2
Hi Tech 4.6 11.7 7.2
Source: Company, Angel Research
Geography wise, in line with its peers, TCS witnessed double-digit growth in
Europe. Continental Europe outpaced the UK’s growth, growing at 14.2% qoq,
whereas UK grew at 13.2% qoq. India outperformed by growing at 25.7% qoq,
increasing its revenue share by 110bp qoq to 9.9%.
4. TCS | 2QFY11 Result Update
October 22, 2010 4
Exhibit 6: Revenue growth (Geography wise)
% to revenues % qoq %yoy
US 53.7 9.1 18.2
Ibero America 3.9 1.3 5.4
UK 15.3 13.2 19.6
Continental Europe 9.1 14.2 8.2
India 9.9 25.7 32.2
Asia Pacific 6.2 17.4 31.6
MEA 1.9 6.1 18.9
Source: Company, Angel Research
In rupee terms, growth was much higher at 13% qoq on the back of cross-currency
movement proving favourable, aiding revenue by 2% qoq.
Exhibit 7: Revenue drivers
Source: Company, Angel Research
Margin outperformance continues
EBIT margin surged 86bp qoq, surpassing the 28% mark. Growth was because of
gains of 103bp, 95bp and 54bp due to favourable exchange rate, improved
productivity and SG&A efficiency, respectively, defying the negative impact of
166bp from promotions and variable allowances.
Exhibit 8: Factors leading to higher EBIT margin
Source: Company, Angel Research
(2.0)
-
2.0
4.0
6.0
8.0
10.0
12.0
14.0
-
%
Volume Forex movement Pricing Total revenue growth
(2.0)
(1.5)
(1.0)
(0.5)
-
0.5
1.0
1.5
-
%
Rupee dep/(app) Pricing & Productivity Promotions & allowances
SGA efficiencies Total impact
5. TCS | 2QFY11 Result Update
October 22, 2010 5
Hiring spree continues, utilisations remain unhampered
TCS has been on the hiring spree since 3QFY2010. In 2QFY2011 itself, 10,229
employees were added in TCS Ltd. Net employee addition in subsidiaries, including
CMC, WTI, TCS e-Serve and Diligenta, also stood decent at 488. During the
quarter, attrition rate inched up by 80bp qoq to 13.1% in TCS Ltd.; whereas, it
spiked up by whopping 250bp to 22.5% in the BPO segment.
Exhibit 9: Hiring and attrition trend
2QFY10 3QFY10 4QFY10 1QFY11 2QFY11
TCS Ltd.
Attrition – IT services (%) 10.8 10.8 11.0 12.3 13.1
Gross addition 3,836 11,377 14,640 8,464 17,121
Net addition (312) 7,417 10,110 2,320 10,229
Subsidiaries
Attrition – BPO (%) 18.0 18.3 18.8 20.0 22.5
Net addition 632 275 665 951 488
Source: Company, Angel Research
Though hiring remained robust, utilisation including trainees as well as excluding
trainees peaked at 77.8% and 83.8%, respectively, during the quarter. This was
primarily because of higher lateral hiring to map the surge in demand across
various verticals.
Exhibit 10: Trend in utilisation
2QFY10 3QFY10 4QFY10 1QFY11 2QFY11
Including trainees (%) 73.6 77.2 74.3 74.8 77.8
Excluding trainees (%) 79.5 81.1 81.8 82.6 83.8
Source: Company, Angel Research
Significant improvement in client pyramid
During the quarter, the client pyramid witnessed significant improvement.
The US $100mn plus bracket witnessed addition of one client qoq. While, eight
clients migrated from US $5mn–10mn to the US $10mn–20mn bracket. Further,
10 out of 30 new clients were added directly to the US $1mn–10mn bracket.
Exhibit 11: Client pyramid
1QFY11 2QFY11
US $1mn–5mn 218 228
US $5mn–10mn 69 61
US $10mn–20mn 57 65
US $20mn–50mn 41 41
US $50mn–100mn 17 17
US $100mn plus 7 8
Number of active clients 930 936
Clients added 36 30
Source: Company, Angel Research
6. TCS | 2QFY11 Result Update
October 22, 2010 6
Outlook and valuation
Management highlighted that the early indications from clients on budgets point
towards an increment in IT spending for CY2011, with a possibility of an uptick in
pricing. Along with its peers, TCS is also witnessing a trend of clients looking out to
spend on IT to drive operational efficiencies and prepare for future growth, which is
leading to a surge in transformational projects of large sizes. Clients are
outsourcing projects, like 1) consolidation of ERP as well as core banking systems
and 2) virtualisation and rationalisation of infrastructure and applications, to drive
cost efficiencies. The retail vertical is emerging as a strong growth driver,
outsourcing projects related to inventory optimisation, pricing determination and
encashing the digital consumer behaviour. Healthcare is spending on IT to comply
with ICD10, whereas banking is spending to address the BASEL III norm.
TCS bagged eight large deals in 2QFY2011 itself, with two each in the banking
and retail segments and one each in insurance, lifesciences, media and
government. On the back of a strong deal pipeline, TCS has raised its hiring target
for FY2011 yet again from 36,000 at the start of the year to 40,000 at the end of
1QFY2011 and 50,000 plus currently.
We expect TCS to witness a 24.2% CAGR (in US$ terms) and a 20.4% CAGR (in
INR terms) in revenue over FY2010–12E. EBITDA is expected to witness a higher
CAGR at 21.4%, as the company is reaping the benefits of SG&A investments
made in the past. We value TCS at 22x FY2012 EPS of `47.8, i.e., at par with
industry benchmark, Infosys, as it continues to bridge the margin gap even on the
back of higher scale. At current levels, we recommend a Neutral rating
on the stock.
Exhibit 12: Key assumptions
FY2011E FY2012E
Volume growth 26.2 22.2
Pricing growth 0 0
Revenue growth (US $) 26.2 22.2
USD-INR rate (realised) 45.5 44.5
Revenue growth (`) 21.3 19.6
EBITDA margin (%) 29.6 29.4
Tax rate (%) 19.0 24.0
EPS growth (%) 19.8 13.5
Source: Company, Angel Research
Exhibit 13: Change in estimates
FY2011E FY2012E
Parameter Earlier Revised Variation Earlier Revised Variation
(` cr) Estimates Estimates (%) Estimates Estimates (%)
Net Revenues 35,979 36,412 1.2 43,470 43,531 0.1
EBITDA 10,526 10,793 2.5 12,498 12,789 2.3
Other Income 488 316 (35.2) 855 650 (24.0)
PBT 10,204 10,317 1.1 12,353 12,481 1.0
Tax 2,060 1,962 (4.8) 3,027 2,995 (1.0)
PAT 8,017 8,236 2.7 9,177 9,349 1.9
Source: Company, Angel Research
7. TCS | 2QFY11 Result Update
October 22, 2010 7
We have revised our dollar revenue growth from 23% CAGR to 24% CAGR over
FY2010–12E. This, in rupee terms, is leading to marginal revision as we have
revised our USD/INR estimate for FY2011 and FY2012 to 45.5 and 44.5 from 46
and 45, respectively. EBITDA has been revised upwards as the company continues
to demonstrate operational exuberance and will be benefited from SG&A
investments made earlier. Also, tax rates have been revised downwards from 20%
to 19% for FY2011 and from 25% to 24% for FY2012 on the back of improving
SEZ-STPI ratio due to commissioning of new projects. Thus, PAT has been revised
upwards on the back of better profitability and lower tax rates.
Exhibit 14: One-year forward PE(x) band
Source: Company, Angel Research
Exhibit 15: Recommendation summary
Company Reco. CMP Tgt. price Upside FY2012E P/BV FY2012E P/E FY2010-12E FY2012E RoCE FY2012E RoE
(`) (`) (%) (x) (x) EPS CAGR (%) (%) (%)
3iInfotech Buy 67 100 50.2 0.7 4.1 204.0 15.7 19.5
Educomp Buy 614 734 19.5 2.8 13.4 26.9 21.0 22.9
HCL Tech Accumulate 418 462 10.7 3.2 13.1 34.4 17.3 26.6
Infosys Neutral 3,053 - - 5.3 21.6 13.7 28.3 27.0
Infotech Enterprises Buy 163 184 12.7 1.5 9.7 (26.1) 17.3 16.4
Mphasis Buy 626 872 39.3 2.3 10.3 8.4 43.6 24.1
NIIT Buy 69 83 20.6 1.8 11.9 16.6 12.1 15.8
TCS Neutral 1,040 - - 7.2 21.8 16.6 45.4 36.6
Tech Mahindra Buy 760 942 24.0 2.4 14.3 (0.5) 56.9 18.5
Wipro Accumulate 448 489 9.0 4.0 17.4 16.7 17.6 24.4
Source: Company, Angel Research
0
200
400
600
800
1,000
1,200 Apr-07
Jul-07
Oct-07
Jan-08
Apr-08
Jul-08
Oct-08
Jan-09
Apr-09
Jul-09
Oct-09
Jan-10
Apr-10
Jul-10
Oct-10
(`)
Price 25x 21x 16x 11x 6x
8. TCS | 2QFY11 Result Update
October 22, 2010 8
Profit & Loss statement (Consolidated, US GAAP)
Y/E March (` cr) FY2009* FY2010 FY2011E FY2012E
Net sales 27,813 30,028 36,412 43,531
Cost of revenues 15,078 15,724 19,441 23,681
Gross profit 12,735 14,303 16,971 19,850
% of net sales 45.8 47.6 46.6 45.6
SG& A expense 5,557 5,625 6,177 7,062
% of net sales 20.0 18.7 17.0 16.2
EBITDA 7,178 8,679 10,793 12,789
% of net sales 25.8 28.9 29.6 29.4
Depreciation & Amortisation 577 661 792 958
% of net sales 2.1 2.2 4.0 4.2
EBIT 6,601 8,018 10,001 11,831
% of net sales 23.7 26.7 27.5 27.2
Other Income,net (467) 272 316 650
Profit Before Tax 6,134 8,184 10,317 12,481
Provision for Tax 901 1,209 1,962 2,995
% of PBT 14.7 14.8 19.0 24.0
PAT 5,233 6,975 8,356 9,485
Minority interest 61 102 119 137
Profit after minority interest 5,172 6,873 8,236 9,349
Fully diluted EPS(`) 26.4 35.1 42.1 47.8
Note:* indicates adjusted for 1:1 bonus
9. TCS | 2QFY11 Result Update
October 22, 2010 9
Balance sheet (Consolidated, US GAAP)
Y/E March (` cr) FY2009* FY2010 FY2011E FY2012E
Equity capital 98 196 196 196
Preference capital 100 100 100 100
Capital reserve 5 5 5 5
Capital redemption reserve 0 0 0 0
Securities premium account 2,016 1,918 1,918 1,918
general reserve 1,903 2,540 3,302 4,167
Profit and loss reserve 11,835 13,605 17,164 21,733
Foreign currency translation reserve 472 109 109 109
Hedging reserve account (730) (6) - -
Net worth 15,700 18,467 22,795 28,229
Short Term Loan 525 72 72 72
Long Term Loan 38 31 31 31
Total debt 564 103 103 103
Minority interest 277 362 362 362
Deferred Tax liability 129 69 69 69
Capital employed 16,670 19,000 23,328 28,763
Gross block 5,844 6,420 8,620 10,820
Accumulated depreciation (2,360) (2,898) (3,690) (4,647)
Net Property & Equipment 3,484 3,522 4,930 6,172
Goodwill & Intangibles 3,263 3,216 3,216 3,216
Capital WIP 705 1,017 1,234 1,475
Total fixed assets 7,452 7,755 9,379 10,863
Investments 1,614 3,682 3,794 4,137
Deferred Tax Asset 60 168 168 168
Inventories 37 18 8 7
Sundry debtors 6,023 5,855 7,083 8,468
Cash & bank 2,698 4,719 6,523 8,946
Unbilled Revenues 1,481 1,201 1,446 1,729
Loans & advances 1 26 37 39
Sundry creditors 3,284 3,970 4,734 5,659
Other liabilities (2,114) (2,978) (3,573) (4,288)
Provision (2,139) (1,116) (1,116) (1,116)
Working capital (1,727) (4,300) (5,153) (5,849)
Capital deployed 16,670 19,000 23,328 28,763
Note: *Indicates adjusted for 1:1 bonus
10. TCS | 2QFY11 Result Update
October 22, 2010 10
Cash flow (Consolidated, US GAAP)
Y/E March (` cr) FY2009* FY2010 FY2011E FY2012E
Pretax profit from operations 6,601 7,911 10,001 11,831
Depreciation 577 661 792 958
Expenses (deferred)/written off/others (61) (103) (119) (137)
Pre tax cash from operations 7,117 8,470 10,674 12,652
Other income/prior period ad (467) 272 316 650
Net cash from operations 6,650 8,742 10,990 13,302
Tax (901) (1,209) (1,962) (2,995)
Cash profits 5,749 7,533 9,029 10,306
(Inc)/Dec in
Current assets (2,019) (219) (2,227) (2,593)
Current liabilities 1,503 2,414 1,449 1,411
Net trade working capital (516) 2,194 (778) (1,182)
Cash flow from operating activities 5,233 9,727 8,251 9,124
(Inc)/Dec in fixed assets (3,187) (964) (2,416) (2,441)
(Inc)/Dec in investments 992 (2,093) (122) (346)
(Inc)/Dec in net Deferred Tax asset 35 (168) - -
Cash flow from investing activities (2,160) (3,225) (2,539) (2,787)
Inc/(Dec) in debt 108 (460) - -
Inc/(Dec) in equity/premium (159) (1,929) 6 -
Inc in minority interest 64 85 - -
Dividends (1,613) (2,177) (3,914) (3,914)
Cash flow from financing activities (1,599) (4,481) (3,908) (3,914)
Cash generated/(utilised) 1,475 2,020 1,804 2,423
Cash at start of the year 1,223 2,698 4,719 6,523
Cash at end of the year 2,698 4,719 6,523 8,946
Note:* indicates adjusted for 1:1 bonus
12. TCS | 2QFY11 Result Update
October 22, 2010 12
Research Team Tel: 022 - 4040 3800 E-mail: research@angeltrade.com Website: www.angeltrade.com
DISCLAIMER
This document is solely for the personal information of the recipient, and must not be singularly used as the basis of any investment
decision. Nothing in this document should be construed as investment or financial advice. Each recipient of this document should make
such investigations as they deem necessary to arrive at an independent evaluation of an investment in the securities of the companies
referred to in this document (including the merits and risks involved), and should consult their own advisors to determine the merits and
risks of such an investment.
Angel Broking Limited, its affiliates, directors, its proprietary trading and investment businesses may, from time to time, make
investment decisions that are inconsistent with or contradictory to the recommendations expressed herein. The views contained in this
document are those of the analyst, and the company may or may not subscribe to all the views expressed within.
Reports based on technical and derivative analysis center on studying charts of a stock's price movement, outstanding positions and
trading volume, as opposed to focusing on a company's fundamentals and, as such, may not match with a report on a company's
fundamentals.
The information in this document has been printed on the basis of publicly available information, internal data and other reliable
sources believed to be true, but we do not represent that it is accurate or complete and it should not be relied on as such, as this
document is for general guidance only. Angel Broking Limited or any of its affiliates/ group companies shall not be in any way
responsible for any loss or damage that may arise to any person from any inadvertent error in the information contained in this report.
Angel Broking Limited has not independently verified all the information contained within this document. Accordingly, we cannot testify,
nor make any representation or warranty, express or implied, to the accuracy, contents or data contained within this document. While
Angel Broking Limited endeavours to update on a reasonable basis the information discussed in this material, there may be regulatory,
compliance, or other reasons that prevent us from doing so.
This document is being supplied to you solely for your information, and its contents, information or data may not be reproduced,
redistributed or passed on, directly or indirectly.
Angel Broking Limited and its affiliates may seek to provide or have engaged in providing corporate finance, investment banking or
other advisory services in a merger or specific transaction to the companies referred to in this report, as on the date of this report or in
the past.
Neither Angel Broking Limited, nor its directors, employees or affiliates shall be liable for any loss or damage that may arise from or in
connection with the use of this information.
Note: Please refer to the important `Stock Holding Disclosure' report on the Angel website (Research Section). Also, please
refer to the latest update on respective stocks for the disclosure status in respect of those stocks. Angel Broking Limited and
its affiliates may have investment positions in the stocks recommended in this report.
Disclosure of Interest Statement TCS
1. Analyst ownership of the stock No
2. Angel and its Group companies ownership of the stock No
3. Angel and its Group companies' Directors ownership of the stock No
4. Broking relationship with company covered No
Ratings (Returns): Buy (> 15%) Accumulate (5% to 15%) Neutral (-5 to 5%)
Reduce (-5% to 15%) Sell (< -15%)
Note: We have not considered any Exposure below ` 1 lakh for Angel, its Group companies and Directors