How Automation is Driving Efficiency Through the Last Mile of Reporting
Irb ru2 qfy2011-281010
1. Please refer to important disclosures at the end of this report 1
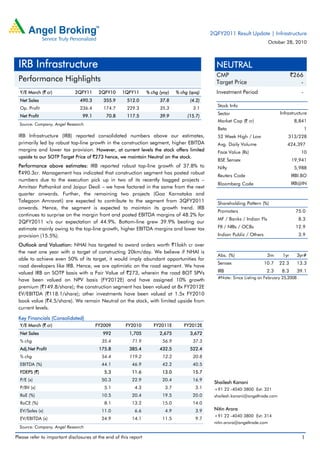
Y/E March (` cr) 2QFY11 2QFY10 1QFY11 % chg (yoy) % chg (qoq)
Net Sales 490.3 355.9 512.0 37.8 (4.2)
Op. Profit 236.4 174.7 229.3 35.3 3.1
Net Profit 99.1 70.8 117.5 39.9 (15.7)
Source: Company, Angel Research
IRB Infrastructure (IRB) reported consolidated numbers above our estimates,
primarily led by robust top-line growth in the construction segment, higher EBITDA
margins and lower tax provision. However, at current levels the stock offers limited
upside to our SOTP Target Price of `273 hence, we maintain Neutral on the stock.
Performance above estimates: IRB reported robust top-line growth of 37.8% to
`490.3cr. Management has indicated that construction segment has posted robust
numbers due to the execution pick up in two of its recently bagged projects –
Amritsar Pathankot and Jaipur Deoli – we have factored in the same from the next
quarter onwards. Further, the remaining two projects (Goa Karnataka and
Talegaon Amravati) are expected to contribute to the segment from 3QFY2011
onwards. Hence, the segment is expected to maintain its growth trend. IRB
continues to surprise on the margin front and posted EBITDA margins of 48.2% for
2QFY2011 v/s our expectation of 44.9%. Bottom-line grew 39.9% beating our
estimate mainly owing to the top-line growth, higher EBITDA margins and lower tax
provision (15.5%).
Outlook and Valuation: NHAI has targeted to award orders worth `1lakh cr over
the next one year with a target of constructing 20km/day. We believe if NHAI is
able to achieve even 50% of its target, it would imply abundant opportunities for
road developers like IRB. Hence, we are optimistic on the road segment. We have
valued IRB on SOTP basis with a Fair Value of `273, wherein the road BOT SPVs
have been valued on NPV basis (FY2012E) and have assigned 10% growth
premium (`149.8/share); the construction segment has been valued at 8x FY2012E
EV/EBITDA (`118.1/share); other investments have been valued at 1.5x FY2010
book value (`4.5/share). We remain Neutral on the stock, with limited upside from
current levels.
Key Financials (Consolidated)
Y/E March (` cr) FY2009 FY2010 FY2011E FY2012E
Net Sales 992 1,705 2,675 3,672
% chg 35.4 71.9 56.9 37.3
Adj.Net Profit 175.8 385.4 432.5 522.4
% chg 54.4 119.2 12.2 20.8
EBITDA (%) 44.1 46.9 42.2 40.5
FDEPS (`) 5.3 11.6 13.0 15.7
P/E (x) 50.3 22.9 20.4 16.9
P/BV (x) 5.1 4.3 3.7 3.1
RoE (%) 10.5 20.4 19.5 20.0
RoCE (%) 8.1 13.2 15.0 14.0
EV/Sales (x) 11.0 6.6 4.9 3.9
EV/EBITDA (x) 24.9 14.1 11.5 9.7
Source: Company, Angel Research
NEUTRAL
CMP `266
Target Price -
Investment Period -
Stock Info
Sector
Bloomberg Code
Shareholding Pattern (%)
Promoters 75.0
MF / Banks / Indian Fls 8.3
FII / NRIs / OCBs 12.9
Indian Public / Others 3.9
Abs. (%) 3m 1yr 3yr#
Sensex 10.7 22.3 13.3
IRB 2.3 8.3 39.1
#Note: Since Listing on February 25,2008
Face Value (Rs)
BSE Sensex
Nifty
Reuters Code
8,841
1
313/228
424,397
Infrastructure
Avg. Daily Volume
Market Cap (` cr)
Beta
52 Week High / Low
10
19,941
5,988
IRBI.BO
IRB@IN
Shailesh Kanani
+91 22 -4040 3800 Ext: 321
shailesh.kanani@angeltrade.com
Nitin Arora
+91 22 -4040 3800 Ext: 314
nitin.arora@angeltrade.com
IRB Infrastructure
Performance Highlights
2QFY2011 Result Update | Infrastructure
October 28, 2010
3. IRB Infrastructure | 2QFY2011 Result Update
October 28, 2010 3
Exhibit 3: 2QFY2011 Actual v/s Angel estimates
Parameter Estimates Actual Variation
Revenues 465.4 490.3 5.3
EBITDA Margin (%) 44.9 48.2 330bp
PAT 66.9 99.1 48.1
Source: Company, Angel Research
Exhibit 4: Road BOT - Project-wise growth in toll revenue
Project 2QFY11 2QFY10 % chg 1QFY11 % chg (qoq) 1HFY11 1HFY10 % chg (yoy)
Surat Dahisar BOT Project^ 82.8 78.0 6.2 88.2 (6.1) 171.0 155.8 9.8
Mumbai - Pune BOT Project 80.3 76.7 4.7 80.2 0.1 160.5 153.1 4.8
Thane Bhiwandi Bypass 4 Lane BOT Project 12.2 11.2 9.4 13.3 (8.3) 25.5 22.4 14.1
Thane Ghodbunder BOT Project 6.5 6.7 (2.8) 7.2 (9.7) 13.7 13.6 0.8
Pune - Nashik BOT Project 5.3 4.3 22.2 4.8 10.4 10.1 8.5 18.3
Pune - Sholapur BOT Project 3.1 3.1 1.3 3.6 (13.9) 6.7 6.7 0.6
Nagar - Karmala - Tembhurni BOT Project 3.5 3.4 1.7 3.8 (7.9) 7.3 6.3 15.1
Mohol - Mandrup - Kamtee BOT Project 2.0 1.8 12.0 1.7 17.6 3.7 3.5 6.1
Kharpada Bridge BOT Project 1.5 1.5 (2.9) 1.9 (21.1) 3.4 3.3 1.7
Bharuch - Surat BOT Project $ 30.5 2.1 - 29.8 2.3 60.3 2.1 2,754.2
Kaman - Paygaon BOT Project ** - 0.8 - - - - 1.7 -
Khambatki Ghat BOT Project * - - - - - - 1.2 -
Total 227.7 189.6 20.1 234.5 (2.9) 462.2 378.2 22.2
Source: Company, Angel Research; Note: * Concession period of Khambatki Ghat BOT project ended on May 3, 2009, ^
Surat-Dahisar commissioned on
February 20, 2009, ^^
Bharuch Surat BOT project commissioned on September 25, 2009, ** Kaman-Paygaon BOT project concession period stopped from
November 22, 2009
Top-line tad above our estimates
IRB reported robust top-line growth of 37.8% to `490.3cr above our expectations
of `465.4cr. This was primarily due to growth of 46.4% in the construction vertical
as against our estimate of 33% growth for the quarter. Management has indicated
that the construction segment has posted robust numbers due to execution pick up
in two of its recently bagged projects namely – Amritsar Pathankot and Jaipur
Deoli – we have factored in the same from next quarter onwards. Further, the
remaining two projects (Goa Karnataka and Talegaon Amravati) are also expected
to contribute to the construction segment from 3QFY2011 onwards. Hence, the
segment is expected to maintain its growth trend. It should be noted that
management has guided for top-line of `1,800-1,900cr for the construction
segment for the fiscal, implying a growth of ~80% over FY2010 and a run rate of
~115-125% for 2HFY2011. We believe this is achievable considering projects
worth `5,500cr will be under the construction phase in 2HFY2011 and
performance is seasonally weak during the second quarter.
4. IRB Infrastructure | 2QFY2011 Result Update
October 28, 2010 4
Exhibit 5: Higher top-line growth expected in 2HFY2011
Source: Company, Angel Research
IRB continues to post above industry average EBITDA margins
IRB continues to surprise on the margin front and posted EBITDA margins of 48.2%
for 2QFY2011 as against our expectation of 44.9%. We were expecting margins to
be under pressure for the quarter on account of higher revenues from the
construction segment. However, the company surprised with the construction
segment posting EBITDA margins of 24.0% for the quarter, a yoy jump of 330bp.
Bottom-line grew 39.9% beating our estimate mainly owing to the top-line growth,
higher EBITDA margins and lower tax provision at 15.5%.
Exhibit 6: Healthy EBITDA margins
Source: Company, Angel Research
Exhibit 7: PATM impacted by higher interest cost
Source: Company, Angel Research
Outlook and Valuation
NHAI has targeted to award orders worth `1lakh cr over the next one year in line
with the long-term target of constructing 20km/day. We believe if NHAI is able to
achieve even 50% of its target, it would imply abundant opportunities for road
developers like IRB. Further, the recent structural changes have also lessened the
vagaries in road development. Hence, we are optimistic on the road segment. IRB
has one of the largest domestic BOT project portfolios in the road and highway
sector comprising 16 projects. In light of the immense opportunities that exist in the
road sector in the near future along with IRB’s vast experience and integrated
business model, we maintain our bullish stance on the company. Moreover, IRB’s
construction arm has a robust order book of `7,191cr (excluding O&M orders)
(4.1x FY201E construction revenues), which lends high revenue visibility.
80.0
76.5
81.1
56.3
23.6
37.8
-
10.0
20.0
30.0
40.0
50.0
60.0
70.0
80.0
90.0
0.0
100.0
200.0
300.0
400.0
500.0
600.0
1QFY10 2QFY10 3QFY10 4QFY10 1QFY11 2QFY11
Net Sales (Rs cr, LHS) Growth (yoy %, RHS)
49.5
42.5
37.5
40.1
49.1
52.4
46.0
40.5
48.2
-
10.0
20.0
30.0
40.0
50.0
60.0
-
50.0
100.0
150.0
200.0
250.0
300.0
2QFY09
3QFY09
4QFY09
1QFY10
2QFY10
3QFY10
4QFY10
1QFY11
2QFY11
EBITDA (Rs cr) EBITDAM (%, RHS)
20.4
16.0
13.6
19.7 19.9
22.0
28.2
22.9
20.2
-
5.0
10.0
15.0
20.0
25.0
30.0
0.0
20.0
40.0
60.0
80.0
100.0
120.0
140.0
160.0
2QFY09
3QFY09
4QFY09
1QFY10
2QFY10
3QFY10
4QFY10
1QFY11
2QFY11
PAT (Rs cr, LHS) PATM (%, RHS)
5. IRB Infrastructure | 2QFY2011 Result Update
October 28, 2010 5
We have valued IRB on an SOTP basis with a Fair Value of `273 wherein the road
BOT SPVs have been valued on NPV basis (FY2012E) and have assigned 10%
growth premium (`149.8/share); the construction segment has been valued at 8x
FY2012E EV/EBITDA (`118.1/share); other investments have been valued at 1.5x
FY2010 book value (`4.5/share). We maintain our Neutral view on the stock on
account of limited upside from current levels.
Exhibit 8: SOTP break up
Business Segment Methodology ` cr IRB’s stake (%) `/share % to Target Price
4 BOT Projects FCFE 287 100 8.6 3.2
Kharpada Bridge BOT Project FCFE 35 100 1.0 0.4
Nagar-Karmala Tembhurni BOT Project FCFE 78 100 2.4 0.9
Mohol-Mandup-Kamtee BOT Project FCFE 45 100 1.3 0.5
Pune-Solapur BOT Project FCFE 104 100 3.1 1.1
Pune-Nashik BOT Project FCFE 176 100 5.3 1.9
Mumbai-Pune BOT Project FCFE 1,549 100 46.6 17.1
Thane Ghodbunder BOT Project FCFE 268 100 8.1 3.0
Surat Dahisat BOT Project FCFE 222 90 6.0 2.2
Bharuch-Surat BOT Project FCFE 616 100 18.5 6.8
IRDP Kolhapur FCFE 506 100 15.2 5.6
Goa Karnataka Border FCFE 184 100 5.5 2.0
Pathankot-Amritsar FCFE 103 100 3.1 1.1
Jaipur Deoli FCFE 48 100 1.4 0.5
Talegaon-Amravati FCFE 89 100 2.7 1.0
Tumkur-Chitradurga FCFE 242 100 7.3 2.7
Total Road BOT Asset Portfolio Valuation 136.2
Value post 10% growth premium 149.8 5.0
Modern Road Makers Pvt.Ltd EV/EBITDA 3,924 118.1 43.3
Land Parcel Valuation 1.5x Book Value 130 3.9 1.4
Sindhudurg Airport Project 1.5x Book Value 15 0.7 0.2
Total 272.5 100.0
Source: Company, Angel Research
6. IRB Infrastructure | 2QFY2011 Result Update
October 28, 2010 6
Exhibit 9: Key Assumptions
Project
4 BOT
Proj
Kharpada NKT MMK
Pune
Solapur
Pune
Nashik
Mumbai-
Pune
Thane
Ghod
Bharuch
-Surat
Surat
Dahisat
IRDP
Kolhapur
Goa
Karnataka
Pathankot
Amritsar
Jaipur
Deoli
Talegaon
Amravati
Tumkur-
Chitradurga
Status Oper Oper. Oper. Oper. Oper. Oper. Oper. Oper. Oper. Under Dev. Under Dev. Under Dev. Under Dev. Under Dev. Under Dev. Under Dev.
KM 24 1.4 60 33.4 26 30 206 15 65 240 50 69 102.4 146.3 66.7 114
Issuing Auth. PWD MORTH PWD PWD MORTH MORTH MSRDC MSRDC NHAI NHAI MSRDC NHAI NHAI NHAI NHAI NHAI
State Mah. Mah. Mah. Mah. Mah. Mah. Mah. Mah. Guj Guj./Mah Mah. Goa Punjab Raj Mah. Kar
Concession(Yrs) 18.5 17.8 15 16 16 18 15 15 15 12 30 30 20 25 22 26
Con. Start Jan-99 Sep-99 Dec-01 May-02 Mar-03 Sep-03 Aug-04 Dec-05 Dec-06 Feb-09 Jan-09 Apr-10 Nov-09 Apr-10 Apr-10 Apr-11
Con. End May-17 Aug-15 Dec-16 May-18 Mar-19 Sep-21 Aug-19 Dec-20 Dec-21 Feb-21 Jan-39 Apr-40 Nov-29 Mar-35 Apr-32 Apr-37
TPC (` cr) 104 32 37 18 63 73.7 1301 246 1470 2400 403 836 1445 1733 888 1200
Equity (` cr) 34 10 15 7 18 1 120 40 198 879 172 260 394 527 197 450
Debt (` cr) 70 22 22 11 45 72.7 1181 206 1272 1521 258 390 924 900 475 750
Grant (` cr) 0 0 0 0 0 0 0 0 (504) 0 (27) 186 127 306 216 0
Traffic inc (%) 7 8 7 7 7 7 18# 7 7 8 7 7 7 7 7 7
Toll inc (%) 6 6 6 6 6 6 6 6 6 6 6 6 6 6 6 6
Int Rate (%) - - - - - - 10.5 10.5 10.8 10.8 11.5 10.5 10.5 10.5 10.5 10.8
Source: Company, Angel Research, Note: # Every 3 years
Exhibit 10: Angel EPS forecast v/s consensus
Angel Forecast Bloomberg consensus Variation (%)
FY2011E 13.0 14.4 10.7
FY2012E 15.7 16.6 5.3
Source: Company, Angel Research
Investment Arguments
Vast opportunity in the road sector IRB the prime beneficiary: IRB has some of
the very high-density, strategically aligned road stretched in its gamut. These
high-density stretches reduce the average payback period for a typical road BOT
project. The Government of India is aggressively focusing on road development
and expects to award road BOT projects worth `1lakh cr in FY2011, after a dismal
award activity in FY2009. About 34% of this proposed investment is expected to
come through to the private sector, and we believe that IRB stands to benefit from
the same.
Integrated road play: IRB has an integrated business model wherein the internal
construction arm, MRMPL, undertakes EPC work relating to secured road BOT
projects. While the time-bound construction work of secured road BOT projects
lends revenue visibility for the construction arm, any prior completion of
construction work ushers in revenue upsides from the road BOT (toll) segment. We
believe that owing to this integrated business model the company is straddled
across the complete value chain in road development.
12. IRB Infrastructure | 2QFY2011 Result Update
October 28, 2010 12
Research Team Tel: 022 - 4040 3800 E-mail: research@angeltrade.com Website: www.angeltrade.com
DISCLAIMER
This document is solely for the personal information of the recipient, and must not be singularly used as the basis of any investment
decision. Nothing in this document should be construed as investment or financial advice. Each recipient of this document should make
such investigations as they deem necessary to arrive at an independent evaluation of an investment in the securities of the companies
referred to in this document (including the merits and risks involved), and should consult their own advisors to determine the merits and
risks of such an investment.
Angel Broking Limited, its affiliates, directors, its proprietary trading and investment businesses may, from time to time, make
investment decisions that are inconsistent with or contradictory to the recommendations expressed herein. The views contained in this
document are those of the analyst, and the company may or may not subscribe to all the views expressed within.
Reports based on technical and derivative analysis center on studying charts of a stock's price movement, outstanding positions and
trading volume, as opposed to focusing on a company's fundamentals and, as such, may not match with a report on a company's
fundamentals.
The information in this document has been printed on the basis of publicly available information, internal data and other reliable
sources believed to be true, but we do not represent that it is accurate or complete and it should not be relied on as such, as this
document is for general guidance only. Angel Broking Limited or any of its affiliates/ group companies shall not be in any way
responsible for any loss or damage that may arise to any person from any inadvertent error in the information contained in this report.
Angel Broking Limited has not independently verified all the information contained within this document. Accordingly, we cannot testify,
nor make any representation or warranty, express or implied, to the accuracy, contents or data contained within this document. While
Angel Broking Limited endeavours to update on a reasonable basis the information discussed in this material, there may be regulatory,
compliance, or other reasons that prevent us from doing so.
This document is being supplied to you solely for your information, and its contents, information or data may not be reproduced,
redistributed or passed on, directly or indirectly.
Angel Broking Limited and its affiliates may seek to provide or have engaged in providing corporate finance, investment banking or
other advisory services in a merger or specific transaction to the companies referred to in this report, as on the date of this report or in
the past.
Neither Angel Broking Limited, nor its directors, employees or affiliates shall be liable for any loss or damage that may arise from or in
connection with the use of this information.
Note: Please refer to the important `Stock Holding Disclosure' report on the Angel website (Research Section). Also, please
refer to the latest update on respective stocks for the disclosure status in respect of those stocks. Angel Broking Limited and
its affiliates may have investment positions in the stocks recommended in this report.
Disclosure of Interest Statement IRB Infra
1. Analyst ownership of the stock No
2. Angel and its Group companies ownership of the stock No
3. Angel and its Group companies' Directors ownership of the stock No
4. Broking relationship with company covered No
Note: We have not considered any Exposure below Rs 1 lakh for Angel, its Group companies and Directors.
Ratings (Returns) : Buy (> 15%) Accumulate (5% to 15%) Neutral (-5 to 5%)
Reduce (-5% to 15%) Sell (< -15%)