Log your LOA pain with Pension Lab's brilliant campaign
Itc ru2 qfy2011-291010
1. Please refer to important disclosures at the end of this report 1
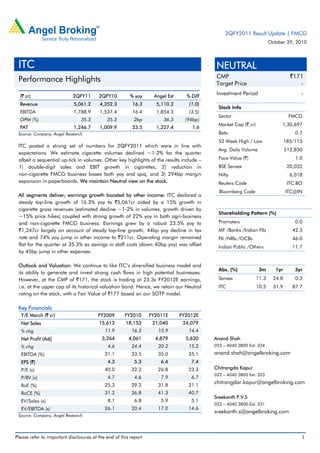
(` cr) 2QFY11 2QFY10 % yoy Angel Est % Diff
Revenue 5,061.2 4,352.3 16.3 5,110.2 (1.0)
EBITDA 1,788.9 1,537.4 16.4 1,854.3 (3.5)
OPM (%) 35.3 35.3 2bp 36.3 (94bp)
PAT 1,246.7 1,009.9 23.5 1,227.4 1.6
Source: Company, Angel Research
ITC posted a strong set of numbers for 2QFY2011 which were in line with
expectations. We estimate cigarette volumes declined ~1-2% for the quarter
albeit a sequential up-tick in volumes. Other key highlights of the results include –
1) double-digit sales and EBIT growth in cigarettes, 2) reduction in
non-cigarette FMCG business losses both yoy and qoq, and 3) 294bp margin
expansion in paperboards. We maintain Neutral view on the stock.
All segments deliver; earnings growth boosted by other income: ITC declared a
steady top-line growth of 16.3% yoy to `5,061cr aided by a 15% growth in
cigarette gross revenues (estimated decline ~1-2% in volumes, growth driven by
~15% price hikes) coupled with strong growth of 22% yoy in both agri-business
and non-cigarette FMCG business. Earnings grew by a robust 23.5% yoy to
`1,247cr largely on account of steady top-line growth, 44bp yoy decline in tax
rate and 74% yoy jump in other income to `211cr. Operating margin remained
flat for the quarter at 35.3% as savings in staff costs (down 40bp yoy) was offset
by 45bp jump in other expenses.
Outlook and Valuation: We continue to like ITC’s diversified business model and
its ability to generate and invest strong cash flows in high potential businesses.
However, at the CMP of `171, the stock is trading at 23.3x FY2012E earnings,
i.e. at the upper cap of its historical valuation band. Hence, we retain our Neutral
rating on the stock, with a Fair Value of `177 based on our SOTP model.
Key Financials
Y/E March (` cr) FY2009 FY2010 FY2011E FY2012E
Net Sales 15,612 18,153 21,040 24,079
% chg 11.9 16.3 15.9 14.4
Net Profit (Adj) 3,264 4,061 4,879 5,620
% chg 4.6 24.4 20.2 15.2
EBITDA (%) 31.1 33.5 35.0 35.1
EPS (`) 4.3 5.3 6.4 7.4
P/E (x) 40.0 32.2 26.8 23.3
P/BV (x) 4.7 4.6 7.9 6.7
RoE (%) 25.3 29.2 31.8 31.1
RoCE (%) 31.2 36.8 41.3 40.7
EV/Sales (x) 8.1 6.8 5.9 5.1
EV/EBITDA (x) 26.1 20.4 17.0 14.6
Source: Company, Angel Research
NEUTRAL
CMP `171
Target Price -
Investment Period -
Stock Info
Sector FMCG
Market Cap (` cr) 1,30,697
Beta 0.7
52 Week High / Low 185/115
Avg. Daily Volume 512,850
Face Value (`) 1.0
BSE Sensex 20,032
Nifty 6,018
Reuters Code ITC.BO
Bloomberg Code ITC@IN
Shareholding Pattern (%)
Promoters 0.0
MF /Banks /Indian FIls 42.3
FII /NRIs /OCBs 46.0
Indian Public /Others 11.7
Abs. (%) 3m 1yr 3yr
Sensex 11.3 24.8 0.3
ITC 10.5 31.9 87.7
Anand Shah
022 – 4040 3800 Ext: 334
anand.shah@angelbroking.com
Chitrangda Kapur
022 – 4040 3800 Ext: 323
chitrangdar.kapur@angelbroking.com
Sreekanth P.V.S
022 – 4040 3800 Ext: 331
sreekanth.s@angelbroking.com
ITC
Performance Highlights
2QFY2011 Result Update | FMCG
October 29, 2010
2. ITC| 2QFY2011 Result Update
October 29, 2010 2
Exhibit 1: Quarterly Performance
Y/E March (` cr) 2QFY11 2QFY10 % yoy 1HFY11 1HFY10 % chg
Net Sales 5,061.2 4,352.3 16.3 9,877.8 8,499.8 16.2
Consumption of RM 1,853.2 1,596.7 16.1 3,644.3 3,118.0 16.9
(% of Sales) 36.6 36.7 36.9 36.7
Staff Costs 261.2 242.0 7.9 603.1 524.1 15.1
(% of Sales) 5.2 5.6 6.1 6.2
Other Expenses 1,157.9 976.2 18.6 2,235.1 1,983.2 12.7
(% of Sales) 22.9 22.4 22.6 23.3
Total Expenditure 3,272.3 2,814.8 16.3 6,482.5 5,625.3 15.2
Operating Profit 1,788.9 1,537.4 16.4 3,395.3 2,874.5 18.1
OPM (%) 35.3 35.3 34.4 33.8
Interest 5.4 18.1 (70.5) 11.2 24.0 (53.5)
Depreciation 164.0 148.4 10.5 323.7 300.0 7.9
Other Income 210.5 121.1 73.8 339.7 258.9 31.2
PBT (excl. Extr. Items) 1,830.0 1,492.0 22.7 3,400.1 2,809.5 21.0
Extr. Income/(Expense) - - - -
PBT (incl. Extr. Items) 1,830.0 1,492.0 22.7 3,400.1 2,809.5 21.0
(% of Sales) 36.2 34.3 34.4 33.1
Provision for Taxation 583.3 482.1 21.0 1,083.1 920.9 17.6
(% of PBT) 31.9 32.3 31.9 32.8
Reported PAT 1,246.7 1,009.9 23.5 2,317.1 1,888.6 22.7
PATM (%) 24.6 23.2 23.5 22.2
Equity shares (cr) 767.7 756.0 767.7 756.0
Adjusted EPS (`) 1.6 1.3 21.6 3.0 2.5 20.8
Source: Company, Angel Research
Broad-based growth, all segments deliver high double-digit growth
ITC declared a steady top-line growth of 16.3% yoy to `5,061cr (`4,352cr). The
cigarette division registered 15% growth in gross revenues (12.9% yoy growth in net
revenues) on the back of better realisation (price hike of ~15%) and improved
product mix. In terms of volumes, we expect ITC registered a ~1-2% decline in
volume for the quarter indicating improvement in sequential terms.
Exhibit 2: Steady top-line growth, up 16%
Source: Company, Angel Research
Exhibit 3: Volumes declines ~1-2%, expect up-tick in 2H
Source: Company, Angel Research
-
5.0
10.0
15.0
20.0
25.0
30.0
-
1,000
2,000
3,000
4,000
5,000
1Q09
2Q09
3Q09
4Q09
1Q10
2Q10
3Q10
4Q10
1Q11
2Q11
(yoy%)
(`cr)
Top-line (LHS) YoY growth (RHS)
(2)
(3) (3)
6 6
7
8
(3)
(1)
(4)
(2)
-
2
4
6
8
10
2Q09
3Q09
4Q09
1Q10
2Q10
3Q10
4Q10
1Q11
2Q11
(%)
3. ITC| 2QFY2011 Result Update
October 29, 2010 3
Amongst other segments, the agri and non-cigarette FMCG business posted strong
growth of 21.5% and 22% yoy respectively, while hotels and paperboards registered
a modest 20.6% and 16.8% yoy growth, respectively.
Exhibit 4: Segmental growth trend (yoy)
Source: Company, Angel Research
Earnings grow strong 24% yoy partially aided by other income
Earnings grew by a robust 23.5% yoy to `1,247cr (`1,010cr) largely on account of
steady top-line growth, 44bp yoy decline in tax rate and 74% yoy jump in other
income to `211cr (`121cr). Operating margin remained flat for the quarter at 35.3%
as savings in staff costs (down 40bp yoy) was offset by the 45bp jump in other
expenses. In terms of segmental margins, cigarettes posted 40bp expansion (driven
by price hikes), non-cigarette FMCG business posted reduction in losses both yoy
and qoq in range of ~`18-22cr and paperboards margins expanded 294bp yoy.
However, higher contribution of agri-business to top-line coupled with 74bp margin
contraction in agri-business dragged overall margins.
Exhibit 5: 20%+ earnings growth rate maintained
Source: Company, Angel Research
Exhibit 6: OPM flat due to poor product mix
Source: Company, Angel Research
15 14
(25)
9
19
13
23
(2)
26
46
14
34
14 12
88
12
32
21
13
44
15
22 21 17 22
(40)
(20)
-
20
40
60
80
100
Cigarettes Non-Cig FMCG Hotels Paperboards Agri-Business
(%)
2QFY10 3QFY10 4QFY10 1QFY11 2QFY11
(10.0)
(5.0)
-
5.0
10.0
15.0
20.0
25.0
30.0
10
210
410
610
810
1,010
1,210
1,410
1Q09
2Q09
3Q09
4Q09
1Q10
2Q10
3Q10
4Q10
1Q11
2Q11
(yoy%)
(`cr)
PAT (LHS) YoY growth (RHS)
28.9 29.7
35.3
32.0 32.2
35.3 36.6
30.5
33.4 35.3
53.8
58.9 60.4 62.7 63.3 63.3
59.8
56.9
62.8 63.4
20.0
30.0
40.0
50.0
60.0
70.0
1Q09
2Q09
3Q09
4Q09
1Q10
2Q10
3Q10
4Q10
1Q11
2Q11
(%)
OPM Gross Margin
4. ITC| 2QFY2011 Result Update
October 29, 2010 4
Exhibit 7: Segment-wise Performance
Y/E March (` cr) 2QFY11 2QFY10 % chg 1HFY11 1HFY10 % chg
Cigarettes 4,810.4 4,183.1 15.0 9,480.2 8,343.7 13.6
Others 1,057.7 865.3 22.2 2,063.3 1,624.7 27.0
Hotels 224.7 186.3 20.6 449.8 372.0 20.9
Agri Business 1,249.6 1,028.3 21.5 2,599.4 1,968.9 32.0
Paperboards & Packg. 959.6 821.7 16.8 1,788.7 1,552.3 15.2
Less: Inter-Seg. Rev. 940.0 776.1 21.1 1,976.5 1,422.1 39.0
Total Gross Income 7,362.1 6,308.6 16.7 14,405.0 12,439.4 15.8
Cigarettes 1,458.2 1,251.7 16.5 2,763.2 2,377.1 16.2
Others (66.9) (85.0) (156.2) (184.8)
Hotels 39.9 31.6 26.3 78.4 62.2 26.1
Agri Business 202.4 174.1 16.2 325.5 274.0 18.8
Paperboards & Packg. 245.6 186.2 31.9 434.1 314.0 38.2
Total PBIT 1,879.2 1,558.5 20.6 3,445.0 2,842.4 21.2
PBIT Margin (%)
Cigarettes 30.3 29.9 29.1 28.5
Others (6.3) (9.8) (7.6) (11.4)
Hotels 17.7 16.9 17.4 16.7
Agri Business 16.2 16.9 12.5 13.9
Paperboards & Packg. 25.6 22.7 24.3 20.2
Source: Company, Angel Research
Cigarette segment registered double-digit sales and EBIT growth
ITC’s cigarette division, for the quarter, registered 15% growth in gross revenues
(12.9% yoy growth in net revenues) on the back of ~15% weighted average price
hikes taken across portfolio post the excise duty hike of ~17%. In terms of volume,
we expect ITC registered ~1-2% decline for the quarter albeit indicative of a
sequential pick up in volumes and in line with our expectations. EBIT margins
expanded 39bp to 30.3% aided by price hikes driving a steady 16.5% growth in
EBIT. We believe the cigarette business is well poised to post double-digit revenue
and EBIT growth in FY2011E. We have modeled in a 1.4% growth in cigarette
volumes for FY2011 (likely to be back-ended in 2HFY2011E).
Exhibit 8: Cigarette sales, EBIT grows by double digits
Source: Company, Angel Research
Exhibit 9: Volume declines ~1-2%, expect up-tick in 2H
Source: Company, Angel Research
-
10.0
20.0
30.0
40.0
-
1,000
2,000
3,000
4,000
5,000
6,000
2Q09
3Q09
4Q09
1Q10
2Q10
3Q10
4Q10
1Q11
2Q11
(%)
(`cr)
Gross Revenue (LHS) YoY growth (RHS)
EBIT Margin (RHS)
(2)
(3) (3)
6 6
7
8
(3)
(1)
(4)
(2)
-
2
4
6
8
10
2Q09
3Q09
4Q09
1Q10
2Q10
3Q10
4Q10
1Q11
2Q11
(%)
5. ITC| 2QFY2011 Result Update
October 29, 2010 5
Non-cigarette FMCG on steady growth path
ITC’s non-cigarette FMCG business registered a steady revenue growth to 22% yoy to
`1,057cr (`865cr) driven by impressive performance from its branded packaged
foods (up 26% yoy). Moreover, losses reduced both yoy and qoq by `18cr and `22cr
respectively boosted by better product mix and cost curtailment measures. During the
quarter, Sunfeast, Aashirvaad atta and confectioneries grew 32%, 29% and 18%
respectively. ITC made a foray into the fast growing instant noodles market with the
launch of Sunfeast Yippee! in two flavours. Going ahead, we expect revenue traction
in the segment to continue and losses to reduce, albeit at a slower pace than
FY2010 and break-even is likely to be achieved in FY2013.
Exhibit 10: Revenue growth steady at 20%+
Source: Company, Angel Research
Exhibit 11: Losses reduce both yoy and qoq
Source: Company, Angel Research
Hotel business on the road to recovery
ITC’s hotel business registered a robust growth of 20.6% yoy to `225cr (`186cr)
during the quarter. EBIT margins expanded by 80bp yoy to 17.7% driving strong
26.3% yoy growth in EBIT. Construction activity of the new super luxury properties at
Chennai and Kolkata are progressing satisfactorily. We believe that the hotel
business is well on track to post 20% CAGR in revenues during
FY2010-12E aided by a low base and up-tick in economic activity. Moreover,
margins are likely to register significant improvement as ARR’s recover.
Exhibit 12: Significant traction in revenue
Source: Company, Angel Research
Exhibit 13: Stable margins, expect up-tick in 2HFY2011
Source: Company, Angel Research
-
5.0
10.0
15.0
20.0
25.0
30.0
35.0
40.0
-
200
400
600
800
1,000
1,200
2Q09
3Q09
4Q09
1Q10
2Q10
3Q10
4Q10
1Q11
2Q11
(%)
(`cr)
Gross Revenue (LHS) YoY growth (RHS)
(117)
(127)
(117)
(100)
(85) (86)
(79)
(89)
(67)
(140)
(120)
(100)
(80)
(60)
(40)
(20)
-
2Q09
3Q09
4Q09
1Q10
2Q10
3Q10
4Q10
1Q11
2Q11
(`cr)
(40.0)
(30.0)
(20.0)
(10.0)
-
10.0
20.0
30.0
-
50
100
150
200
250
300
2Q09
3Q09
4Q09
1Q10
2Q10
3Q10
4Q10
1Q11
2Q11
(%)
(`cr)
Gross Revenue (LHS) YoY growth (RHS)
(40.0)
(30.0)
(20.0)
(10.0)
-
10.0
20.0
30.0
40.0
-
20
40
60
80
100
2Q09
3Q09
4Q09
1Q10
2Q10
3Q10
4Q10
1Q11
2Q11
(%)
(`cr)
EBIT (LHS) EBIT Margin (RHS)
6. ITC| 2QFY2011 Result Update
October 29, 2010 6
Paperboard and packaging surprise on margins front
The segment registered a modest growth in revenue of 16.8% yoy (16% at the net
level) to `960cr (`822cr). However, EBIT margins of the segment registered a
significant expansion of 294bp yoy to 25.6% driving a strong 32% yoy jump in EBIT
aided by a combination of product mix enrichment, higher realisations and
enhanced value capture through in-house pulp production. Going forward, we
expect the segment to post a modest 16% CAGR in revenues during FY2010-12
driven by commencement of new units and improvement in margins by ~100bp
aided largely by better product mix.
Exhibit 14: Steady double-digit growth in sales
Source: Company, Angel Research
Exhibit 15: Sharp up-tick in margins this quarter
Source: Company, Angel Research
Agri business registers another quarter of steady revenue growth
ITC’s agri business registered a steady 21.5% yoy growth in revenues to `1,250cr
(`1,028cr), partially aided by a low base and driven by increased sales of soya, leaf
tobacco and wheat. The business maintained its position as the foremost exporter of
leaf tobacco, leveraging the growing demand for Indian tobaccos. EBIT margin
however, contracted by 74bp yoy to 16.2%, resulting in 16% yoy growth in
segmental EBIT. Going ahead, we expect this segment to register 21% CAGR in
revenues over FY2010-12 and margins to remain stable at 11-12% levels owing to
management’s focus to shift to higher profitability products, and firm leaf tobacco
prices.
Exhibit 16: Revenue up 22% yoy, declines 7% qoq
Source: Company
Exhibit 17: Margins decline yoy, sharp up-tick qoq
Source: Company
(40.0)
(30.0)
(20.0)
(10.0)
-
10.0
20.0
30.0
-
200
400
600
800
1,000
1,200
2Q09
3Q09
4Q09
1Q10
2Q10
3Q10
4Q10
1Q11
2Q11
(%)
(`cr)
Gross Revenue (LHS) YoY growth (RHS)
(40.0)
(30.0)
(20.0)
(10.0)
-
10.0
20.0
30.0
-
50
100
150
200
250
300
2Q09
3Q09
4Q09
1Q10
2Q10
3Q10
4Q10
1Q11
2Q11
(%)
(`cr)
EBIT (LHS) EBIT Margin (RHS)
(60.0)
(40.0)
(20.0)
-
20.0
40.0
60.0
80.0
100.0
-
200
400
600
800
1,000
1,200
1,400
1,600
2Q09
3Q09
4Q09
1Q10
2Q10
3Q10
4Q10
1Q11
2Q11
(%)
(`cr)
Gross Revenue (LHS) YoY growth (RHS)
(40.0)
(30.0)
(20.0)
(10.0)
-
10.0
20.0
-
50
100
150
200
250
2Q09
3Q09
4Q09
1Q10
2Q10
3Q10
4Q10
1Q11
2Q11
(%)
(`cr)
EBIT (LHS) EBIT Margin (RHS)
7. ITC| 2QFY2011 Result Update
October 29, 2010 7
Investment Rationale
Model double-digit sales and EBIT growth in cigarettes: We have modeled in a
1.4% volume growth in cigarette volumes for FY2011 (likely to be back-ended in
2HFY2011E), despite ~15% weighted average price hikes which is likely to fully
offset – 1) ~17% excise hike in Budget and 2) rise in VAT announced in several
states. We believe the cigarette business is well poised to post double-digit sales
and EBIT growth in FY2011E. Moreover, we highlight that over the last 12
months, ITC has strengthened its brand portfolio significantly with brands such
as Flake Excel and Duke Filter, launched Lucky Strike at premium end and
test-marketed 59mm mid-size filter (micro-filters).
Non-cigarette EBIT to post 30% CAGR over FY2010-12E: While cigarettes
remain the main profit center, investments in non-cigarette businesses like
FMCG, hotels and paperboards have started yielding positive contribution.
During FY2010-12, we expect non-cigarette EBIT to register 30% CAGR aided by
– 1) reduction in non-cigarette FMCG losses, 2) improvement in hotel margins
aided by higher ARR, and 3) higher margins in paperboards.
Return ratios to improve across segments boosting cash flow generation: Over
FY2010-12, we expect return ratios to improve across segments driven by higher
margins (refer Exhibit 19). Moreover, going ahead, we expect capex to plateau
from the peak of FY2007-08 driving strong cash flow generation post dividend
payout at ~50%. Hence, we expect ITC to achieve strong net cash surplus of
`~5,800cr (US $125mn) in FY2012 equating to `15/share.
Outlook and Valuation
We remain positive on ITC’s diversified business model and expect the cigarette
business to witness a better 2HFY2011 in terms of volumes. Moreover, broad-based
growth across segments including potential recovery in hotels, strong growth in
agri-business and reducing losses in the non-cigarette FMCG business will help ITC
sustain strong earnings growth in the ensuing quarters. However, at the CMP of
`171, the stock is trading at 23.3x FY2012E earnings, which is at the upper cap of
its historical valuation band. Hence, we retain our Neutral rating on the stock, with a
Fair Value of `177 based on our SOTP model.
13. ITC| 2QFY2011 Result Update
October 29, 2010 13
Research Team Tel: 022 - 4040 3800 E-mail: research@angeltrade.com Website: www.angeltrade.com
Disclaimer
This document is solely for the personal information of the recipient, and must not be singularly used as the basis of any investment
decision. Nothing in this document should be construed as investment or financial advice. Each recipient of this document should make
such investigations as they deem necessary to arrive at an independent evaluation of an investment in the securities of the companies
referred to in this document (including the merits and risks involved), and should consult their own advisors to determine the merits and
risks of such an investment.
Angel Broking Limited, its affiliates, directors, its proprietary trading and investment businesses may, from time to time, make
investment decisions that are inconsistent with or contradictory to the recommendations expressed herein. The views contained in this
document are those of the analyst, and the company may or may not subscribe to all the views expressed within.
Reports based on technical and derivative analysis center on studying charts of a stock's price movement, outstanding positions and
trading volume, as opposed to focusing on a company's fundamentals and, as such, may not match with a report on a company's
fundamentals.
The information in this document has been printed on the basis of publicly available information, internal data and other reliable
sources believed to be true, but we do not represent that it is accurate or complete and it should not be relied on as such, as this
document is for general guidance only. Angel Broking Limited or any of its affiliates/ group companies shall not be in any way
responsible for any loss or damage that may arise to any person from any inadvertent error in the information contained in this report.
Angel Broking Limited has not independently verified all the information contained within this document. Accordingly, we cannot testify,
nor make any representation or warranty, express or implied, to the accuracy, contents or data contained within this document. While
Angel Broking Limited endeavours to update on a reasonable basis the information discussed in this material, there may be regulatory,
compliance, or other reasons that prevent us from doing so.
This document is being supplied to you solely for your information, and its contents, information or data may not be reproduced,
redistributed or passed on, directly or indirectly.
Angel Broking Limited and its affiliates may seek to provide or have engaged in providing corporate finance, investment banking or
other advisory services in a merger or specific transaction to the companies referred to in this report, as on the date of this report or in
the past.
Neither Angel Broking Limited, nor its directors, employees or affiliates shall be liable for any loss or damage that may arise from or in
connection with the use of this information.
Note: Please refer to the important `Stock Holding Disclosure' report on the Angel website (Research Section). Also, please refer to the
latest update on respective stocks for the disclosure status in respect of those stocks. Angel Broking Limited and its affiliates may have
investment positions in the stocks recommended in this report.
Disclosure of Interest Statement ITC
1. Analyst ownership of the stock No
2. Angel and its Group companies ownership of the stock No
3. Angel and its Group companies' Directors ownership of the stock No
4. Broking relationship with company covered No
Note: We have not considered any Exposure below Rs 1 lakh for Angel, its Group companies and Directors.
Ratings (Returns) : Buy (> 15%) Accumulate (5% to 15%) Neutral (-5 to 5%)
Reduce (-5% to 15%) Sell (< -15%)