SlideShare a Scribd company logo
Please refer to important disclosures at the end of this report 1
Y/E March (` cr) 2QFY11 1QFY11 % chg (qoq) 2QFY10 % chg (yoy)
Net revenue 650 700 (7.2) 817 (20.4)
Operating profit 115 196 (41.3) 340 (66.2)
OPM (%) 17.7 27.9 (1,026bp) 41.6 (2,390bp)
Net profit 31 73 (57.1) 169 (81.6)
Source: Company, Angel Research
For 2QFY2011, Madras Cements (MAC) posted a 20.4% yoy decline in its top
line to `650cr, which was below our estimates of `692cr. The lacklustre
performance was primarily because of a 22.7% yoy decline in the cement
segment’s revenue to `576cr. Going ahead, we expect the offtake to improve in
the southern region, with cessation of monsoon and improvement in demand
from the housing and infrastructure segments in the southern region. Realisation
is also set to improve post the recent price hikes carried out in the region. We
maintain a Buy rating on the stock.
OPM at 17.7%, down 2,390bp yoy: The company’s top-line declined by 20.4%
yoy as the cement segment, which derives bulk of its revenue from the southern
region, suffered due to low offtake and poor realisation in the region. While the
company’s cement despatches were down by 6% yoy to 1.95mn tonnes,
realisation fell by a steep 16.8% yoy to `2,952/tonne. OPM plunged by a huge
2,390bp yoy to 17.7%, primarily due to fall in cement realisations and a 12.4%
yoy increase in power and fuel costs to `172cr. The bottom line fell by 81.6% yoy
to `31cr, in line with our estimates.
Outlook and valuation: At the CMP, the stock is trading at 6.7x EV/EBITDA based
on FY2012E numbers. We have valued the company’s cement assets at
US $75/tonne and have assigned a value of `4cr/MW to the captive power
plants. We maintain a Buy rating on the stock with a Target Price of `141.
Key financials
Y/E March (` cr) FY2009 FY2010 FY2011E FY2012E
Net sales 2,530 2,801 2,769 3,060
% chg 25.8 10.7 (1.1) 10.5
Net profit 364 354 180 202
% chg (11.0) (2.7) (49.0) 12.2
FDEPS (`) 15.3 14.9 7.6 8.5
OPM (%) 30.8 30.6 21.0 21.7
P/E (x) 7.4 7.6 14.9 13.3
P/BV (x) 2.1 1.7 1.6 1.4
RoE (%) 32.9 25.1 11.1 11.4
RoCE (%) 17.9 14.8 7.9 8.9
EV/Sales (x) 2.0 1.8 1.7 1.5
EV/tonne 110 102 85 79
EV/EBITDA 6.4 5.9 8.3 6.7
Source: Company, Angel Research
BUY
CMP `113
Target Price `141
Investment Period 12 Months
Stock Info
Sector
Bloomberg Code
Shareholding Pattern (%)
Promoters 42.0
MF / Banks / Indian Fls 28.3
FII / NRIs / OCBs 8.2
Indian Public / Others 21.5
Abs. (%) 3m 1yr 3yr
Sensex 12.0 20.8 29.3
MAC 9.7 1.0 (34.1)
1
20,303
6,106
MSCM.BO
MC@IN
Face Value (`)
BSE Sensex
Nifty
Reuters Code
2,691
0.6
140/91
125910
Cement
Avg. Daily Volume
Market Cap (` cr)
Beta
52 Week High / Low
Rupesh Sankhe
022-40403800 Ext 319
rupeshd.sankhe@angelbroking.com
V Srinivasan
022-40403800 Ext 330
v.srinivasan@angelbroking.com
Madras Cements
Performance Highlights
2QFY2011 Result Update | Cement
October 25, 2010
Madras Cements | 2QFY2011 Result Update
October 25, 2010 2
Exhibit 1: 2QFY2011 performance
Y/E March (` cr) 2QFY2011 1QFY2011 % chg (qoq) 2QFY2010 % chg (yoy) 1HFY2011 1HFY2010 % chg
Net sales 650 700 (7.2) 817 (20.4) 1,350 1,621 (16.7)
Net raw-material costs 120 84 42.8 86 38.4 203 226 (9.9)
(% of sales) 18.4 12.0 10.6 15.1 13.9
Power & fuel 172 174 (1.5) 153 12.4 346 293 17.8
(% of sales) 26.4 24.9 18.7 25.6 18.1
Staff costs 37 39 (5.7) 31 20.2 77 64 20.6
(% of sales) 5.7 5.6 3.8 5.7 3.9
Freight & forwarding 122 123 (0.1) 119 2.5 245 246 (0.3)
(% of sales) 18.8 17.5 14.6 18.1 15.2
Other expenses 85 85 (0.4) 87.9 (4) 169.5 163 4.3
(% of sales) 13.0 12.1 10.8 12.6 10.0
Total expenditure 535.1 504.8 6.0 477.2 12.2 1,040 991 5.0
Operating profit 115 196 (41.3) 340 (66.2) 310 630 (50.8)
OPM (%) 17.7 27.9 41.6 23.0 38.9
Interest 35 35 - 38 (6.7) 70 75 (6.7)
Depreciation 55 54 2.1 47 15.6 109 93 17.5
Other income 3 2 44.1 2 63.3 5 4 21.4
Extr. income/(expense) - - - -
Provision for taxation (4) 36 (109.7) 87 (104.0) 32 158 (79.4)
(% of PBT) (12.7) 33.2 33.9 23.9 33.9
Reported PAT 31.1 72.6 (57.1) 169.4 (81.6) 103 308 (66.4)
PATM (%) 4.8 10.4 20.7 7.7 19.0
Equity capital 23.8 23.8 23.8 23.8 23.8
EPS (`) 1.3 3.1 7.1 4.3 13.0
Adjusted PAT 31 73 (57) 169.4 (81.6) 103 308 (66.4)
Source: Company, Angel Research
Exhibit 2: Financial performance
Source: Company, Angel Research
770 817
611 577
700
650
138 169
16 29 73 31
0
10
20
30
40
50
0
250
500
750
1,000
1QFY10 2QFY10 3QFY10 4QFY10 1QFY11 2QFY11
Net Sales (LHS) Net Profit (LHS) OPM (RHS)
(` cr) (%)
Madras Cements | 2QFY2011 Result Update
October 25, 2010 3
Exhibit 3: 2QFY2011 – Actual v/s Angel estimates
(` cr) Actual Estimates Variation (%)
Net sales 650 692 (6.1)
Operating profit 115 132 (13.2)
Net profit 31 32 (2.8)
Source: Company, Angel Research
Operational performance
During the quarter, MAC’s per tonne cement realisations declined by 16.8%
yoy to `2,952. The company’s operating profit per tonne of cement stood at
`291, down 78.4% yoy. MAC’s incurred net loss per tonne stood at `21.
Exhibit 4: Per tonne analysis
Particulars (`) 2QFY2011 1QFY2010 2QFY2010
% chg
(yoy)
% chg
(qoq)
Realisation/tonne 2,952 3,189 3,547 (16.8) (7.4)
Raw-material cost/tonne 570 406 525 8.5 40.5
Power & fuel cost /tonne 880 843 727 21.0 4.3
Freight cost/tonne 627 593 620 1.2 5.8
Operating profit/tonne 291 826 1,343 (78.4) (64.8)
Depreciation/tonne 215 197 167 28.8 8.9
Net profit/tonne (21) 231 567 (103.6) (108.9)
Source: Company, Angel Research
Exhibit 5: Despatches and realisation trend
Source: Company, Angel Research
0
1,000
2,000
3,000
4,000
1.60
1.80
2.00
2.20
1QFY10 2QFY10 3QFY10 4QFY10 1QFY11 2QFY11
Despatches Realisation (RHS)
(mtpa) `/ton
Madras Cements | 2QFY2011 Result Update
October 25, 2010 4
Investment arguments
Major player in the south, but limited presence in Andhra Pradesh: MAC is a
major cement player in the southern region, with total cement capacity of
10.5mtpa. The company’s despatches have grown at a 12% CAGR over
FY2007–10, aided by a 4.5mtpa increase in capacity over the same period.
Further, MAC, which is currently facing clinker shortage, is setting up a second
clinkerisation unit at its Ariyalur Plant, with capacity of 2mtpa. The total project
cost is estimated to be `600cr. Post this expansion, MAC’s cement capacity
would expand to 12.5mtpa by the end of FY2011. Thus, the company’s overall
capacity is set to more than double over FY2007–12E.
MAC derives ~50% of its cement revenue from Tamil Nadu and only 19%
from Andhra Pradesh, which is the worst affected region in terms of demand
slowdown and price correction. Thus, the company is better placed as
compared to players with major exposure to Andhra Pradesh.
Exhibit 6: Geography-wise revenue breakup (FY2010)
Source: Company, Angel Research
Exhibit 7: Installed capacity
Source: Company, Angel Research
Installation of new captive power capacities to improve margins: MAC has been
adding up its windmill capacity to reduce dependence on the state grid for power
requirement. The company’s windmill capacity currently stands at 163MW, which
is sufficient to handle close to 61% of its total power requirements. Going ahead,
MAC is planning to invest `310cr to establish 85MW of captive thermal power
plant capacity, which includes a 60MW unit at Ariyalur and a 25MW plant
at RR Nagar.
Outlook and valuation: At the CMP, the stock is trading at an EV/EBITDA of 6.7x
based on FY2012E numbers. We have valued the company’s cement assets at
US $75/tonne and have assigned a value of `4cr/MW to the captive power plants.
We maintain a Buy rating on the stock with a Target Price of `141.
47%
24%
19%
8%
2%
Tamil Nadu Kerala Andhra Karnataka Others
6.0
8.0
10.0 10.5
12.5 12.5
0.0
4.0
8.0
12.0
16.0
FY07 FY08 FY09 FY10 FY11E FY12E
(mtpa)
Madras Cements | 2QFY2011 Result Update
October 25, 2010 5
Exhibit 8: SOTP-based target price (FY2012E)
Particulars Parameter Value (` cr)
Target EV/tonne US $75 5,191
CPP* (244 MW) `4cr/MW 976
Market cap (` cr) 3,363
No. of shares (cr) 23.8
Target price (`) 141
Source: Angel Research; Note: * CPP refers to captive power plants
Exhibit 9: Change in estimates
(` cr) FY2011E FY2012E
Earlier Revised Var. (%) Earlier Revised Var. (%)
Net sales 2,746 2,769 0.8 3,117 3,060 (1.8)
Operating exp. 2,180 2,188 0.4 2,441 2,395 (1.9)
Operating profit 566 581 2.5 676 665 (1.6)
Depreciation 209 209 0.0 248 248 0.0
Interest 148 148 (0.0) 133 133 (0.0)
PBT 226 241 6.4 313 302 (3.5)
Tax 75 60 (19.4) 103 100 (3.6)
PAT 152 180 19.1 210 202 (3.5)
Source: Company, Angel Research
Exhibit 10: Key assumptions
Earlier estimates Revised estimates
Particulars FY11E FY12E FY11E FY12E
Installed capacity – Cement (mtpa) 12.5 12.5 12.5 12.5
YoY growth (%) 19.1 - 19.1 -
Utilisation (%) 69.0 76.0 67.0 73.0
Despatches growth (%) 9.1 10.4 5.1 9.0
Realisation growth (%) (14.0) 2.5 (15.0) 1.0
Source: Angel Research
Exhibit 11: One-year forward EV/tonne (US $)
Source: Company, Angel Research
0
3,000
6,000
9,000
12,000
Apr-05 Apr-06 Apr-07 Apr-08 Apr-09 Apr-10
EV(`cr)
EV $70 $90 $110 $130
Madras Cements | 2QFY2011 Result Update
October 25, 2010 6
Exhibit 12: Recommendation summary
Company Reco. CMP Tgt. Price Upside FY2012E FY2012E FY2010-12E FY2012E FY2012E
(`) (`) (%) P/BV (x) P/E (x) EPS CAGR (%) RoCE (%) RoE (%)
ACC* Neutral 984 - - 2.5 19.3 (22.5) 16.1 13.4
Ambuja Cements* Neutral 139 - - 2.7 21.4 (9.9) 16.7 13.3
Grasim Ind. Neutral 2,252 - - 1.1 9.0 (10.9) 14.1 12.4
India Cements Buy 113 139 23.0 1.0 26.9 (39.6) 4.5 3.0
JK Lakshmi Buy 62 92 48.3 0.6 5.3 (22.9) 10.0 11.3
Kesoram Ind. Buy 304 437 44.0 0.7 4.6 13.1 11.8 16.3
Madras Cements Buy 113 141 24.7 1.4 13.3 (24.4) 8.9 11.4
UltraTech Cement Neutral 1,111 - - 1.9 14.9 (7.9) 15.2 14.0
Source: Company, Angel Research; Note: *Year ending December.
Madras Cements | 2QFY2011 Result Update
October 25, 2010 7
Profit and loss statement (Standalone)
Y/E March (` cr) FY07 FY08 FY09 FY10 FY11E FY12E
Net Sales 1,574 2,012 2,530 2,801 2,769 3,060
Total operating income 1,574 2,012 2,530 2,801 2,769 3,060
% chg 56 28 26 11 (1.1) 10.5
Total Expenditure 1,018 1,260 1,752 1,943 2,188 2,395
Net Raw Materials 214 248 362 398 474 509
Other Mfg costs 310 408 602 598 663 714
Personnel 57 81 110 137 158 181
Other 438 523 678 810 893 992
EBITDA 556 752 778 858 581 665
% chg 163.7 35.3 3.5 10.2 (32.3) 14.5
(% of Net Sales) 35.3 37.4 30.8 30.6 21.0 21.7
Depreciation& Amortisation 72 93 138 196 209 248
EBIT 484 659 641 662 372 417
% chg 232.4 36.1 (2.8) 3.2 (43.8) 12.0
(% of Net Sales) 30.8 32.8 25.3 23.6 13.4 13.6
Interest & other Charges 23 52 110 152 148 133
Other Income 8 9 15 20 17 18
(% of PBT) 1.6 1.5 2.8 3.9 6.9 6.1
Recurring PBT 469 617 546 530 241 302
% chg 303.6 31.6 (11.5) (2.8) (54.6) 25.6
Extraordinary Expense/(Inc.) - - - - - -
PBT (reported) 469 617 545 530 241 302
Tax 161 209 182 177 60 100
(% of PBT) 34.3 33.8 33.4 33.3 25.0 33.0
PAT (reported) 308 408 364 354 180 202
ADJ. PAT 308 408 364 354 180 202
% chg 285.7 32.5 (10.9) (2.8) (49.0) 12.2
(% of Net Sales) 19.6 20.3 14.4 12.6 6.5 6.6
Basic EPS (`) 26 34 15 15 8 9
Fully Diluted EPS (`) 26 34 15 15 8 9
% chg 288.9 34.5 (55.5) (2.7) (49.0) 12.2
Madras Cements | 2QFY2011 Result Update
October 25, 2010 8
Balance Sheet (Standalone)
Y/E March (` cr) FY07 FY08 FY09 FY10 FY11E FY12E
SOURCES OF FUNDS
Equity Share Capital 12 12 24 24 24 24
Preference Capital - - - -
Reserves& Surplus 654 942 1,236 1,534 1,671 1,845
Shareholders’ Funds 666 954 1,260 1,558 1,694 1,868
Total Loans 677 1,636 2,463 2,567 2,467 2,217
Deferred Tax Liability 226 363 490 585 585 585
Total Liabilities 1,569 2,952 4,214 4,710 4,746 4,670
APPLICATION OF FUNDS
Gross Block 1,799 2,714 3,918 4,811 4,911 5,511
Less: Acc. Depreciation 718 808 918 1,119 1,327 1,575
Net Block 1,081 1,906 3,000 3,693 3,584 3,936
Capital Work-in-Progress 178 576 635 318 418 268
Goodwill - - - - - -
Investments 89 89 89 89 89 89
Current Assets 615 779 914 1,135 1,184 1,012
Cash 57 23 39 35 47 32
Loans & Advances 365 452 456 532 532 532
Other 194 304 419 568 605 448
Current liabilities 395 402 440 546 550 656
Net Current Assets 220 378 473 589 634 356
Mis. Exp. not written off 2 3 16 21 21 21
Total Assets 1,569 2,952 4,214 4,710 4,746 4,670
Madras Cements | 2QFY2011 Result Update
October 25, 2010 9
Cash flow statement (Standalone)
Y/E March (` cr) FY07 FY08 FY09 FY10 FY11E FY12E
Profit before tax 469 617 545 530 241 302
Depreciation 72 93 138 196 209 248
Change in Working Capital (64) (72) 114 121 (52) 262
Less: Other income 8 9 15 20 17 18
Direct taxes paid 161 209 182 177 60 100
Cash Flow from Operations 308 420 600 651 321 694
(Inc)/ Decin Fixed Assets (326) (1,314) (1,262) (576) (200) (450)
(Inc)/ Dec in Investments - - - - - -
Other income 8 9 15 20 17 18
Cash Flow from Investing (318) (1,304) (1,247) (556) (183) (432)
Issue of Equity - - - - - -
Inc./(Dec.) in loans 75 958 828 103 (100) (250)
Dividend Paid (Incl. Tax) 35 56 56 50 25 28
Others 23 52 110 152 - -
Cash Flow from Financing 17 850 662 (98) (125) (278)
Inc./(Dec.) in Cash 7 (34) 16 (3) 12 (16)
Opening Cash balances 49 57 23 39 35 47
Closing Cash balances 57 23 39 35 47 32
Madras Cements | 2QFY2011 Result Update
October 25, 2010 10
Key ratios
Y/E March FY07 FY08 FY09 FY10 FY11E FY12E
Valuation Ratio (x)
P/E (on FDEPS) 3.9 2.9 6.6 6.8 14.9 13.3
P/CEPS 3.2 2.4 4.8 4.4 6.9 6.0
P/BV 1.8 1.3 1.9 1.5 1.6 1.4
Dividend yield (%) 2.9 4.7 2.3 2.1 0.9 1.1
EV/Sales 1.1 1.3 1.8 1.7 1.7 1.5
EV/EBITDA 3.0 3.5 6.0 5.6 8.3 6.7
EV / Total Assets 1.1 0.9 1.1 1.0 1.0 1.0
Per Share Data (`)
EPS (Basic) 25.5 34.3 15.3 14.9 7.6 8.5
EPS (fully diluted) 25.5 34.3 15.3 14.9 7.6 8.5
Cash EPS 31.5 42.1 21.1 23.1 16.4 18.9
DPS 2.9 4.7 2.3 2.1 1.1 1.2
Book Value 55.2 80.1 53.0 65.5 71.2 78.5
DuPont Analysis
EBIT margin 30.8 32.8 25.3 23.6 13.4 13.6
Tax retention ratio 65.7 66.2 66.6 66.7 75.0 67.0
Asset turnover (x) 1.2 0.9 0.7 0.6 0.6 0.7
ROIC (Post-tax) 24.0 19.6 12.0 10.0 6.0 6.0
Cost of Debt (Post Tax) 2.3 3.0 3.6 4.0 4.4 3.8
Leverage (x) 1.1 1.2 1.7 1.7 1.5 1.3
Operating ROE 48.2 40.1 26.8 20.2 8.2 8.7
Returns (%)
ROCE (Pre-tax) 35.1 29.1 17.9 14.8 7.9 8.9
Angel ROIC (Pre-tax) 41.5 37.1 22.2 17.0 8.7 9.8
ROE 58.2 50.4 32.9 25.1 11.1 11.4
Turnover ratios (x)
Asset Turnover (Gross Block) 0.9 0.9 0.8 0.6 0.6 0.6
Inventory / Sales (days) 27 34 41 48 57.9 49.5
Receivables (days) 13 12 11 16 19.4 13.3
Payables (days) 112 115 88 93 91.4 91.9
WC cycle (ex-cash) (days) 25 47 57 64 75.2 54.3
Solvency ratios (x)
Net debt to equity 0.8 1.6 1.9 1.6 1.4 1.1
Net debt to EBITDA 1.0 2.1 3.0 2.9 4.1 3.2
Interest Coverage (EBIT / Int.) 21.2 12.7 5.8 4.4 2.5 3.1
Madras Cements | 2QFY2011 Result Update
October 25, 2010 11
Research Team Tel: 022 - 4040 3800 E-mail: research@angeltrade.com Website: www.angeltrade.com
DISCLAIMER
This document is solely for the personal information of the recipient, and must not be singularly used as the basis of any investment
decision. Nothing in this document should be construed as investment or financial advice. Each recipient of this document should make
such investigations as they deem necessary to arrive at an independent evaluation of an investment in the securities of the companies
referred to in this document (including the merits and risks involved), and should consult their own advisors to determine the merits and
risks of such an investment.
Angel Broking Limited, its affiliates, directors, its proprietary trading and investment businesses may, from time to time, make
investment decisions that are inconsistent with or contradictory to the recommendations expressed herein. The views contained in this
document are those of the analyst, and the company may or may not subscribe to all the views expressed within.
Reports based on technical and derivative analysis center on studying charts of a stock's price movement, outstanding positions and
trading volume, as opposed to focusing on a company's fundamentals and, as such, may not match with a report on a company's
fundamentals.
The information in this document has been printed on the basis of publicly available information, internal data and other reliable
sources believed to be true, but we do not represent that it is accurate or complete and it should not be relied on as such, as this
document is for general guidance only. Angel Broking Limited or any of its affiliates/ group companies shall not be in any way
responsible for any loss or damage that may arise to any person from any inadvertent error in the information contained in this report.
Angel Broking Limited has not independently verified all the information contained within this document. Accordingly, we cannot testify,
nor make any representation or warranty, express or implied, to the accuracy, contents or data contained within this document. While
Angel Broking Limited endeavours to update on a reasonable basis the information discussed in this material, there may be regulatory,
compliance, or other reasons that prevent us from doing so.
This document is being supplied to you solely for your information, and its contents, information or data may not be reproduced,
redistributed or passed on, directly or indirectly.
Angel Broking Limited and its affiliates may seek to provide or have engaged in providing corporate finance, investment banking or
other advisory services in a merger or specific transaction to the companies referred to in this report, as on the date of this report or in
the past.
Neither Angel Broking Limited, nor its directors, employees or affiliates shall be liable for any loss or damage that may arise from or in
connection with the use of this information.
Note: Please refer to the important `Stock Holding Disclosure' report on the Angel website (Research Section). Also, please
refer to the latest update on respective stocks for the disclosure status in respect of those stocks. Angel Broking Limited and
its affiliates may have investment positions in the stocks recommended in this report.
Disclosure of Interest Statement Madras Cements
1. Analyst ownership of the stock No
2. Angel and its Group companies ownership of the stock No
3. Angel and its Group companies' Directors ownership of the stock No
4. Broking relationship with company covered No
Note: We have not considered any Exposure below ` 1 lakh for Angel, its Group companies and Directors.
Ratings (Returns) : Buy (> 15%) Accumulate (5% to 15%) Neutral (-5 to 5%)
Reduce (-5% to 15%) Sell (< -15%)

More Related Content

What's hot

Sterlite 2 qfy2011 271010
Sterlite 2 qfy2011 271010Sterlite 2 qfy2011 271010
Sterlite 2 qfy2011 271010Angel Broking
 
Ril ru2 qfy2011-301010
Ril   ru2 qfy2011-301010Ril   ru2 qfy2011-301010
Ril ru2 qfy2011-301010Angel Broking
 
Fag bearing ru3 qcy2010-221010
Fag bearing ru3 qcy2010-221010Fag bearing ru3 qcy2010-221010
Fag bearing ru3 qcy2010-221010Angel Broking
 
• Financials
 • Financials • Financials
• Financialsfinance5
 
balance sheet of wipro
balance sheet of wiprobalance sheet of wipro
balance sheet of wiproNaresh Vetti
 
KENGEN_VALUATION_REPORT
KENGEN_VALUATION_REPORTKENGEN_VALUATION_REPORT
KENGEN_VALUATION_REPORTPaul Maina
 
Hera Group Analyst presentation 1H 2013 Results
Hera Group Analyst presentation 1H 2013 ResultsHera Group Analyst presentation 1H 2013 Results
Hera Group Analyst presentation 1H 2013 ResultsHera Group
 
Amara Raja Batteries Q2FY15: Buy for a target of Rs790
Amara Raja Batteries Q2FY15: Buy for a target of Rs790Amara Raja Batteries Q2FY15: Buy for a target of Rs790
Amara Raja Batteries Q2FY15: Buy for a target of Rs790
IndiaNotes.com
 
Webcast 2Q14 and 1H14
Webcast 2Q14 and 1H14Webcast 2Q14 and 1H14
Webcast 2Q14 and 1H14
Localiza
 
Scott-Macon Aerospace & Defense Monthly Update (November 2018)
Scott-Macon Aerospace & Defense Monthly Update (November 2018)Scott-Macon Aerospace & Defense Monthly Update (November 2018)
Scott-Macon Aerospace & Defense Monthly Update (November 2018)
Michael Papazis
 
Annual Report 2014
Annual Report 2014Annual Report 2014
Annual Report 2014Hasan Jaber
 
Colgate ru2 qfy2011-281010
Colgate  ru2 qfy2011-281010Colgate  ru2 qfy2011-281010
Colgate ru2 qfy2011-281010Angel Broking
 
Webcast 1 t14 ing
Webcast 1 t14 ingWebcast 1 t14 ing
Webcast 1 t14 ing
Localiza
 
Webcast 3 t14 ing
Webcast 3 t14 ingWebcast 3 t14 ing
Webcast 3 t14 ing
Localiza
 
EMAAR Properties - Company Profile
EMAAR Properties - Company ProfileEMAAR Properties - Company Profile
EMAAR Properties - Company Profile
Imran Almaleh
 
Epgp (one year) 2009-10_cf_ assignment_#2_6jan10
Epgp (one year) 2009-10_cf_ assignment_#2_6jan10Epgp (one year) 2009-10_cf_ assignment_#2_6jan10
Epgp (one year) 2009-10_cf_ assignment_#2_6jan10Rajendra Inani
 
Honolulu Police Department FY2013 Presentation
Honolulu Police Department FY2013 PresentationHonolulu Police Department FY2013 Presentation
Honolulu Police Department FY2013 Presentation
Honolulu Civil Beat
 

What's hot (18)

Sterlite 2 qfy2011 271010
Sterlite 2 qfy2011 271010Sterlite 2 qfy2011 271010
Sterlite 2 qfy2011 271010
 
Ril ru2 qfy2011-301010
Ril   ru2 qfy2011-301010Ril   ru2 qfy2011-301010
Ril ru2 qfy2011-301010
 
Fag bearing ru3 qcy2010-221010
Fag bearing ru3 qcy2010-221010Fag bearing ru3 qcy2010-221010
Fag bearing ru3 qcy2010-221010
 
• Financials
 • Financials • Financials
• Financials
 
balance sheet of wipro
balance sheet of wiprobalance sheet of wipro
balance sheet of wipro
 
KENGEN_VALUATION_REPORT
KENGEN_VALUATION_REPORTKENGEN_VALUATION_REPORT
KENGEN_VALUATION_REPORT
 
Hera Group Analyst presentation 1H 2013 Results
Hera Group Analyst presentation 1H 2013 ResultsHera Group Analyst presentation 1H 2013 Results
Hera Group Analyst presentation 1H 2013 Results
 
Amara Raja Batteries Q2FY15: Buy for a target of Rs790
Amara Raja Batteries Q2FY15: Buy for a target of Rs790Amara Raja Batteries Q2FY15: Buy for a target of Rs790
Amara Raja Batteries Q2FY15: Buy for a target of Rs790
 
Webcast 2Q14 and 1H14
Webcast 2Q14 and 1H14Webcast 2Q14 and 1H14
Webcast 2Q14 and 1H14
 
Scott-Macon Aerospace & Defense Monthly Update (November 2018)
Scott-Macon Aerospace & Defense Monthly Update (November 2018)Scott-Macon Aerospace & Defense Monthly Update (November 2018)
Scott-Macon Aerospace & Defense Monthly Update (November 2018)
 
Annual Report 2014
Annual Report 2014Annual Report 2014
Annual Report 2014
 
Colgate ru2 qfy2011-281010
Colgate  ru2 qfy2011-281010Colgate  ru2 qfy2011-281010
Colgate ru2 qfy2011-281010
 
Webcast 1 t14 ing
Webcast 1 t14 ingWebcast 1 t14 ing
Webcast 1 t14 ing
 
Webcast 3 t14 ing
Webcast 3 t14 ingWebcast 3 t14 ing
Webcast 3 t14 ing
 
EMAAR Properties - Company Profile
EMAAR Properties - Company ProfileEMAAR Properties - Company Profile
EMAAR Properties - Company Profile
 
SIP-NTPC-Neeraj
SIP-NTPC-NeerajSIP-NTPC-Neeraj
SIP-NTPC-Neeraj
 
Epgp (one year) 2009-10_cf_ assignment_#2_6jan10
Epgp (one year) 2009-10_cf_ assignment_#2_6jan10Epgp (one year) 2009-10_cf_ assignment_#2_6jan10
Epgp (one year) 2009-10_cf_ assignment_#2_6jan10
 
Honolulu Police Department FY2013 Presentation
Honolulu Police Department FY2013 PresentationHonolulu Police Department FY2013 Presentation
Honolulu Police Department FY2013 Presentation
 

Viewers also liked

Market outlook 28 10 10
Market outlook 28 10 10Market outlook 28 10 10
Market outlook 28 10 10Angel Broking
 
Market Strategy - September 7,2010
Market Strategy   - September 7,2010Market Strategy   - September 7,2010
Market Strategy - September 7,2010Angel Broking
 
Derivatives report 23 apr-2010
Derivatives report 23 apr-2010Derivatives report 23 apr-2010
Derivatives report 23 apr-2010Angel Broking
 
Tech Report 23.04.2010
Tech Report 23.04.2010Tech Report 23.04.2010
Tech Report 23.04.2010Angel Broking
 
Market outlook 13 10 10
Market outlook 13 10 10Market outlook 13 10 10
Market outlook 13 10 10Angel Broking
 
Finolex cables ru2 qfy2011-251010
Finolex cables ru2 qfy2011-251010Finolex cables ru2 qfy2011-251010
Finolex cables ru2 qfy2011-251010Angel Broking
 
Technical Report - September 15, 2010
Technical Report - September 15, 2010Technical Report - September 15, 2010
Technical Report - September 15, 2010Angel Broking
 
C:\documents and settings\poulomir\desktop\derivatives report 23 july-2010
C:\documents and settings\poulomir\desktop\derivatives report 23 july-2010C:\documents and settings\poulomir\desktop\derivatives report 23 july-2010
C:\documents and settings\poulomir\desktop\derivatives report 23 july-2010Angel Broking
 
Derivatives report 10 june-2010
Derivatives report 10 june-2010Derivatives report 10 june-2010
Derivatives report 10 june-2010Angel Broking
 
Market Outlook - July 2, 2010
Market Outlook - July 2, 2010Market Outlook - July 2, 2010
Market Outlook - July 2, 2010Angel Broking
 
Tech report 18 06 2010
Tech report 18 06 2010Tech report 18 06 2010
Tech report 18 06 2010Angel Broking
 
Oberoi realty ipo-061010
Oberoi realty   ipo-061010Oberoi realty   ipo-061010
Oberoi realty ipo-061010Angel Broking
 
Market outlook 27 10 10
Market outlook 27 10 10Market outlook 27 10 10
Market outlook 27 10 10Angel Broking
 
Derivatives Report - September 15, 2010
Derivatives Report - September 15, 2010Derivatives Report - September 15, 2010
Derivatives Report - September 15, 2010Angel Broking
 
Lakshmi Machine works quick take-130910
Lakshmi Machine works quick take-130910Lakshmi Machine works quick take-130910
Lakshmi Machine works quick take-130910Angel Broking
 

Viewers also liked (19)

Market outlook 28 10 10
Market outlook 28 10 10Market outlook 28 10 10
Market outlook 28 10 10
 
Market Strategy - September 7,2010
Market Strategy   - September 7,2010Market Strategy   - September 7,2010
Market Strategy - September 7,2010
 
Derivatives report 23 apr-2010
Derivatives report 23 apr-2010Derivatives report 23 apr-2010
Derivatives report 23 apr-2010
 
Tech Report 23.04.2010
Tech Report 23.04.2010Tech Report 23.04.2010
Tech Report 23.04.2010
 
Market outlook 13 10 10
Market outlook 13 10 10Market outlook 13 10 10
Market outlook 13 10 10
 
Finolex cables ru2 qfy2011-251010
Finolex cables ru2 qfy2011-251010Finolex cables ru2 qfy2011-251010
Finolex cables ru2 qfy2011-251010
 
Hotel Leela
Hotel LeelaHotel Leela
Hotel Leela
 
Technical Report - September 15, 2010
Technical Report - September 15, 2010Technical Report - September 15, 2010
Technical Report - September 15, 2010
 
IGL
IGLIGL
IGL
 
C:\documents and settings\poulomir\desktop\derivatives report 23 july-2010
C:\documents and settings\poulomir\desktop\derivatives report 23 july-2010C:\documents and settings\poulomir\desktop\derivatives report 23 july-2010
C:\documents and settings\poulomir\desktop\derivatives report 23 july-2010
 
Derivatives report 10 june-2010
Derivatives report 10 june-2010Derivatives report 10 june-2010
Derivatives report 10 june-2010
 
Market Outlook - July 2, 2010
Market Outlook - July 2, 2010Market Outlook - July 2, 2010
Market Outlook - July 2, 2010
 
Tech report 18 06 2010
Tech report 18 06 2010Tech report 18 06 2010
Tech report 18 06 2010
 
Oberoi realty ipo-061010
Oberoi realty   ipo-061010Oberoi realty   ipo-061010
Oberoi realty ipo-061010
 
Indosolar IPO Note
Indosolar IPO NoteIndosolar IPO Note
Indosolar IPO Note
 
Market outlook 27 10 10
Market outlook 27 10 10Market outlook 27 10 10
Market outlook 27 10 10
 
Bosch
BoschBosch
Bosch
 
Derivatives Report - September 15, 2010
Derivatives Report - September 15, 2010Derivatives Report - September 15, 2010
Derivatives Report - September 15, 2010
 
Lakshmi Machine works quick take-130910
Lakshmi Machine works quick take-130910Lakshmi Machine works quick take-130910
Lakshmi Machine works quick take-130910
 

Similar to Madras cements 2 qfy2011 251010

Ambuja ru3 qcy2010-221010
Ambuja ru3 qcy2010-221010Ambuja ru3 qcy2010-221010
Ambuja ru3 qcy2010-221010Angel Broking
 
JP Associates - Result Update
JP Associates - Result UpdateJP Associates - Result Update
JP Associates - Result UpdateAngel Broking
 
Cccl ru2 qfy2011-281010
Cccl ru2 qfy2011-281010Cccl ru2 qfy2011-281010
Cccl ru2 qfy2011-281010Angel Broking
 
Maruti suzuki ru2 qfy2011-291010
Maruti suzuki   ru2 qfy2011-291010Maruti suzuki   ru2 qfy2011-291010
Maruti suzuki ru2 qfy2011-291010Angel Broking
 
Ongc ru2 qfy2011-291010
Ongc ru2 qfy2011-291010Ongc ru2 qfy2011-291010
Ongc ru2 qfy2011-291010Angel Broking
 
Monnet ispat and energy 2 qfy2011-291010
Monnet ispat and energy   2 qfy2011-291010Monnet ispat and energy   2 qfy2011-291010
Monnet ispat and energy 2 qfy2011-291010Angel Broking
 
Petronet lng 2 qfy2011ru-261010
Petronet lng 2 qfy2011ru-261010Petronet lng 2 qfy2011ru-261010
Petronet lng 2 qfy2011ru-261010Angel Broking
 
Nmdc 2 qfy2011-291010
Nmdc 2 qfy2011-291010Nmdc 2 qfy2011-291010
Nmdc 2 qfy2011-291010Angel Broking
 
Sail ru2 qfy2011-291010
Sail ru2 qfy2011-291010Sail ru2 qfy2011-291010
Sail ru2 qfy2011-291010Angel Broking
 
Ntpc 2 qfy11 result update - 271010
Ntpc   2 qfy11 result update - 271010Ntpc   2 qfy11 result update - 271010
Ntpc 2 qfy11 result update - 271010Angel Broking
 
Bharat forge ru2 qfy2011-221010
Bharat forge ru2 qfy2011-221010Bharat forge ru2 qfy2011-221010
Bharat forge ru2 qfy2011-221010Angel Broking
 
Graphite india ru2 qfy2011-291010
Graphite india ru2 qfy2011-291010Graphite india ru2 qfy2011-291010
Graphite india ru2 qfy2011-291010Angel Broking
 
Irb ru2 qfy2011-281010
Irb ru2 qfy2011-281010Irb ru2 qfy2011-281010
Irb ru2 qfy2011-281010Angel Broking
 
IND_United Tractors_FY16 Guidance Confirms Our Contrarian Bearish View 6 Nove...
IND_United Tractors_FY16 Guidance Confirms Our Contrarian Bearish View 6 Nove...IND_United Tractors_FY16 Guidance Confirms Our Contrarian Bearish View 6 Nove...
IND_United Tractors_FY16 Guidance Confirms Our Contrarian Bearish View 6 Nove...Hariyanto Wijaya, CFA, CFP
 
Magna Electrocastings' PAT foreseen rising by CAGR of 8% over 2014 to 2017E, Buy
Magna Electrocastings' PAT foreseen rising by CAGR of 8% over 2014 to 2017E, BuyMagna Electrocastings' PAT foreseen rising by CAGR of 8% over 2014 to 2017E, Buy
Magna Electrocastings' PAT foreseen rising by CAGR of 8% over 2014 to 2017E, Buy
IndiaNotes.com
 
Bank of india ru2 qfy2011-221010
Bank of india ru2 qfy2011-221010Bank of india ru2 qfy2011-221010
Bank of india ru2 qfy2011-221010Angel Broking
 
Irb infrastructure developers ltd q3 fy12 result update
Irb infrastructure developers ltd   q3 fy12 result updateIrb infrastructure developers ltd   q3 fy12 result update
Irb infrastructure developers ltd q3 fy12 result updateKeynote Capitals Ltd.
 
M&m ru2 qfy2011-291010
M&m ru2 qfy2011-291010M&m ru2 qfy2011-291010
M&m ru2 qfy2011-291010Angel Broking
 
Kem presentation final
Kem presentation finalKem presentation final
Kem presentation final
Seamus Sullivan
 
Bajaj electricals ru2 qfy2011-271010
Bajaj electricals ru2 qfy2011-271010Bajaj electricals ru2 qfy2011-271010
Bajaj electricals ru2 qfy2011-271010Angel Broking
 

Similar to Madras cements 2 qfy2011 251010 (20)

Ambuja ru3 qcy2010-221010
Ambuja ru3 qcy2010-221010Ambuja ru3 qcy2010-221010
Ambuja ru3 qcy2010-221010
 
JP Associates - Result Update
JP Associates - Result UpdateJP Associates - Result Update
JP Associates - Result Update
 
Cccl ru2 qfy2011-281010
Cccl ru2 qfy2011-281010Cccl ru2 qfy2011-281010
Cccl ru2 qfy2011-281010
 
Maruti suzuki ru2 qfy2011-291010
Maruti suzuki   ru2 qfy2011-291010Maruti suzuki   ru2 qfy2011-291010
Maruti suzuki ru2 qfy2011-291010
 
Ongc ru2 qfy2011-291010
Ongc ru2 qfy2011-291010Ongc ru2 qfy2011-291010
Ongc ru2 qfy2011-291010
 
Monnet ispat and energy 2 qfy2011-291010
Monnet ispat and energy   2 qfy2011-291010Monnet ispat and energy   2 qfy2011-291010
Monnet ispat and energy 2 qfy2011-291010
 
Petronet lng 2 qfy2011ru-261010
Petronet lng 2 qfy2011ru-261010Petronet lng 2 qfy2011ru-261010
Petronet lng 2 qfy2011ru-261010
 
Nmdc 2 qfy2011-291010
Nmdc 2 qfy2011-291010Nmdc 2 qfy2011-291010
Nmdc 2 qfy2011-291010
 
Sail ru2 qfy2011-291010
Sail ru2 qfy2011-291010Sail ru2 qfy2011-291010
Sail ru2 qfy2011-291010
 
Ntpc 2 qfy11 result update - 271010
Ntpc   2 qfy11 result update - 271010Ntpc   2 qfy11 result update - 271010
Ntpc 2 qfy11 result update - 271010
 
Bharat forge ru2 qfy2011-221010
Bharat forge ru2 qfy2011-221010Bharat forge ru2 qfy2011-221010
Bharat forge ru2 qfy2011-221010
 
Graphite india ru2 qfy2011-291010
Graphite india ru2 qfy2011-291010Graphite india ru2 qfy2011-291010
Graphite india ru2 qfy2011-291010
 
Irb ru2 qfy2011-281010
Irb ru2 qfy2011-281010Irb ru2 qfy2011-281010
Irb ru2 qfy2011-281010
 
IND_United Tractors_FY16 Guidance Confirms Our Contrarian Bearish View 6 Nove...
IND_United Tractors_FY16 Guidance Confirms Our Contrarian Bearish View 6 Nove...IND_United Tractors_FY16 Guidance Confirms Our Contrarian Bearish View 6 Nove...
IND_United Tractors_FY16 Guidance Confirms Our Contrarian Bearish View 6 Nove...
 
Magna Electrocastings' PAT foreseen rising by CAGR of 8% over 2014 to 2017E, Buy
Magna Electrocastings' PAT foreseen rising by CAGR of 8% over 2014 to 2017E, BuyMagna Electrocastings' PAT foreseen rising by CAGR of 8% over 2014 to 2017E, Buy
Magna Electrocastings' PAT foreseen rising by CAGR of 8% over 2014 to 2017E, Buy
 
Bank of india ru2 qfy2011-221010
Bank of india ru2 qfy2011-221010Bank of india ru2 qfy2011-221010
Bank of india ru2 qfy2011-221010
 
Irb infrastructure developers ltd q3 fy12 result update
Irb infrastructure developers ltd   q3 fy12 result updateIrb infrastructure developers ltd   q3 fy12 result update
Irb infrastructure developers ltd q3 fy12 result update
 
M&m ru2 qfy2011-291010
M&m ru2 qfy2011-291010M&m ru2 qfy2011-291010
M&m ru2 qfy2011-291010
 
Kem presentation final
Kem presentation finalKem presentation final
Kem presentation final
 
Bajaj electricals ru2 qfy2011-271010
Bajaj electricals ru2 qfy2011-271010Bajaj electricals ru2 qfy2011-271010
Bajaj electricals ru2 qfy2011-271010
 

More from Angel Broking

Market outlook 110612
Market outlook 110612Market outlook 110612
Market outlook 110612Angel Broking
 
Axis%20 bank ru1qfy2012-220711
Axis%20 bank ru1qfy2012-220711Axis%20 bank ru1qfy2012-220711
Axis%20 bank ru1qfy2012-220711Angel Broking
 
Electrosteel castings
Electrosteel castingsElectrosteel castings
Electrosteel castingsAngel Broking
 
Derivative report 19th July 2011
Derivative report 19th July 2011Derivative report 19th July 2011
Derivative report 19th July 2011Angel Broking
 
Market outlook 19th July 2011
Market outlook 19th July 2011Market outlook 19th July 2011
Market outlook 19th July 2011Angel Broking
 
Weekly Report 18th July 2011
Weekly Report 18th July 2011Weekly Report 18th July 2011
Weekly Report 18th July 2011Angel Broking
 
Derivative Report 18th July 2011
Derivative Report 18th July 2011Derivative Report 18th July 2011
Derivative Report 18th July 2011Angel Broking
 
Technical Report 18th July 2011
Technical Report 18th July 2011Technical Report 18th July 2011
Technical Report 18th July 2011Angel Broking
 
Market Outlook 18th July 2011
Market Outlook 18th July 2011Market Outlook 18th July 2011
Market Outlook 18th July 2011Angel Broking
 
Bajaj auto Result Updated
Bajaj auto Result UpdatedBajaj auto Result Updated
Bajaj auto Result UpdatedAngel Broking
 
Tata consultancy services
Tata consultancy services Tata consultancy services
Tata consultancy services Angel Broking
 
Derivatives Report 15th July 2011
Derivatives Report 15th July 2011Derivatives Report 15th July 2011
Derivatives Report 15th July 2011Angel Broking
 
Technical Report 15th July 2011
Technical Report 15th July 2011Technical Report 15th July 2011
Technical Report 15th July 2011Angel Broking
 
Infosys Result Updated
Infosys Result UpdatedInfosys Result Updated
Infosys Result UpdatedAngel Broking
 
Derivative Report 13th July 2011
Derivative Report 13th July 2011Derivative Report 13th July 2011
Derivative Report 13th July 2011Angel Broking
 

More from Angel Broking (20)

Market outlook 110612
Market outlook 110612Market outlook 110612
Market outlook 110612
 
Axis%20 bank ru1qfy2012-220711
Axis%20 bank ru1qfy2012-220711Axis%20 bank ru1qfy2012-220711
Axis%20 bank ru1qfy2012-220711
 
Electrosteel castings
Electrosteel castingsElectrosteel castings
Electrosteel castings
 
Persistent systems
Persistent systemsPersistent systems
Persistent systems
 
Ht media
Ht mediaHt media
Ht media
 
Derivative report 19th July 2011
Derivative report 19th July 2011Derivative report 19th July 2011
Derivative report 19th July 2011
 
Market outlook 19th July 2011
Market outlook 19th July 2011Market outlook 19th July 2011
Market outlook 19th July 2011
 
Telecom sector
Telecom sectorTelecom sector
Telecom sector
 
Weekly Report 18th July 2011
Weekly Report 18th July 2011Weekly Report 18th July 2011
Weekly Report 18th July 2011
 
Derivative Report 18th July 2011
Derivative Report 18th July 2011Derivative Report 18th July 2011
Derivative Report 18th July 2011
 
Technical Report 18th July 2011
Technical Report 18th July 2011Technical Report 18th July 2011
Technical Report 18th July 2011
 
Market Outlook 18th July 2011
Market Outlook 18th July 2011Market Outlook 18th July 2011
Market Outlook 18th July 2011
 
South Indian Bank
 South Indian Bank South Indian Bank
South Indian Bank
 
Bajaj auto Result Updated
Bajaj auto Result UpdatedBajaj auto Result Updated
Bajaj auto Result Updated
 
Tata consultancy services
Tata consultancy services Tata consultancy services
Tata consultancy services
 
Fc4 e63c4d01
Fc4 e63c4d01Fc4 e63c4d01
Fc4 e63c4d01
 
Derivatives Report 15th July 2011
Derivatives Report 15th July 2011Derivatives Report 15th July 2011
Derivatives Report 15th July 2011
 
Technical Report 15th July 2011
Technical Report 15th July 2011Technical Report 15th July 2011
Technical Report 15th July 2011
 
Infosys Result Updated
Infosys Result UpdatedInfosys Result Updated
Infosys Result Updated
 
Derivative Report 13th July 2011
Derivative Report 13th July 2011Derivative Report 13th July 2011
Derivative Report 13th July 2011
 

Recently uploaded

BYD SWOT Analysis and In-Depth Insights 2024.pptx
BYD SWOT Analysis and In-Depth Insights 2024.pptxBYD SWOT Analysis and In-Depth Insights 2024.pptx
BYD SWOT Analysis and In-Depth Insights 2024.pptx
mikemetalprod
 
APP I Lecture Notes to students 0f 4the year
APP I  Lecture Notes  to students 0f 4the yearAPP I  Lecture Notes  to students 0f 4the year
APP I Lecture Notes to students 0f 4the year
telilaalilemlem
 
What website can I sell pi coins securely.
What website can I sell pi coins securely.What website can I sell pi coins securely.
What website can I sell pi coins securely.
DOT TECH
 
What price will pi network be listed on exchanges
What price will pi network be listed on exchangesWhat price will pi network be listed on exchanges
What price will pi network be listed on exchanges
DOT TECH
 
how to sell pi coins in all Africa Countries.
how to sell pi coins in all Africa Countries.how to sell pi coins in all Africa Countries.
how to sell pi coins in all Africa Countries.
DOT TECH
 
655264371-checkpoint-science-past-papers-april-2023.pdf
655264371-checkpoint-science-past-papers-april-2023.pdf655264371-checkpoint-science-past-papers-april-2023.pdf
655264371-checkpoint-science-past-papers-april-2023.pdf
morearsh02
 
Summary of financial results for 1Q2024
Summary of financial  results for 1Q2024Summary of financial  results for 1Q2024
Summary of financial results for 1Q2024
InterCars
 
managementaccountingunitiv-230422140105-dd17d80b.ppt
managementaccountingunitiv-230422140105-dd17d80b.pptmanagementaccountingunitiv-230422140105-dd17d80b.ppt
managementaccountingunitiv-230422140105-dd17d80b.ppt
SuseelaPalanimuthu
 
how to sell pi coins in South Korea profitably.
how to sell pi coins in South Korea profitably.how to sell pi coins in South Korea profitably.
how to sell pi coins in South Korea profitably.
DOT TECH
 
what is the best method to sell pi coins in 2024
what is the best method to sell pi coins in 2024what is the best method to sell pi coins in 2024
what is the best method to sell pi coins in 2024
DOT TECH
 
innovative-invoice-discounting-platforms-in-india-empowering-retail-investors...
innovative-invoice-discounting-platforms-in-india-empowering-retail-investors...innovative-invoice-discounting-platforms-in-india-empowering-retail-investors...
innovative-invoice-discounting-platforms-in-india-empowering-retail-investors...
Falcon Invoice Discounting
 
what is a pi whale and how to access one.
what is a pi whale and how to access one.what is a pi whale and how to access one.
what is a pi whale and how to access one.
DOT TECH
 
Intro_Economics_ GPresentation Week 4.pptx
Intro_Economics_ GPresentation Week 4.pptxIntro_Economics_ GPresentation Week 4.pptx
Intro_Economics_ GPresentation Week 4.pptx
shetivia
 
234Presentation on Indian Debt Market.ppt
234Presentation on Indian Debt Market.ppt234Presentation on Indian Debt Market.ppt
234Presentation on Indian Debt Market.ppt
PravinPatil144525
 
how to sell pi coins at high rate quickly.
how to sell pi coins at high rate quickly.how to sell pi coins at high rate quickly.
how to sell pi coins at high rate quickly.
DOT TECH
 
The new type of smart, sustainable entrepreneurship and the next day | Europe...
The new type of smart, sustainable entrepreneurship and the next day | Europe...The new type of smart, sustainable entrepreneurship and the next day | Europe...
The new type of smart, sustainable entrepreneurship and the next day | Europe...
Antonis Zairis
 
US Economic Outlook - Being Decided - M Capital Group August 2021.pdf
US Economic Outlook - Being Decided - M Capital Group August 2021.pdfUS Economic Outlook - Being Decided - M Capital Group August 2021.pdf
US Economic Outlook - Being Decided - M Capital Group August 2021.pdf
pchutichetpong
 
How to get verified on Coinbase Account?_.docx
How to get verified on Coinbase Account?_.docxHow to get verified on Coinbase Account?_.docx
How to get verified on Coinbase Account?_.docx
Buy bitget
 
Commercial Bank Economic Capsule - May 2024
Commercial Bank Economic Capsule - May 2024Commercial Bank Economic Capsule - May 2024
Commercial Bank Economic Capsule - May 2024
Commercial Bank of Ceylon PLC
 
The European Unemployment Puzzle: implications from population aging
The European Unemployment Puzzle: implications from population agingThe European Unemployment Puzzle: implications from population aging
The European Unemployment Puzzle: implications from population aging
GRAPE
 

Recently uploaded (20)

BYD SWOT Analysis and In-Depth Insights 2024.pptx
BYD SWOT Analysis and In-Depth Insights 2024.pptxBYD SWOT Analysis and In-Depth Insights 2024.pptx
BYD SWOT Analysis and In-Depth Insights 2024.pptx
 
APP I Lecture Notes to students 0f 4the year
APP I  Lecture Notes  to students 0f 4the yearAPP I  Lecture Notes  to students 0f 4the year
APP I Lecture Notes to students 0f 4the year
 
What website can I sell pi coins securely.
What website can I sell pi coins securely.What website can I sell pi coins securely.
What website can I sell pi coins securely.
 
What price will pi network be listed on exchanges
What price will pi network be listed on exchangesWhat price will pi network be listed on exchanges
What price will pi network be listed on exchanges
 
how to sell pi coins in all Africa Countries.
how to sell pi coins in all Africa Countries.how to sell pi coins in all Africa Countries.
how to sell pi coins in all Africa Countries.
 
655264371-checkpoint-science-past-papers-april-2023.pdf
655264371-checkpoint-science-past-papers-april-2023.pdf655264371-checkpoint-science-past-papers-april-2023.pdf
655264371-checkpoint-science-past-papers-april-2023.pdf
 
Summary of financial results for 1Q2024
Summary of financial  results for 1Q2024Summary of financial  results for 1Q2024
Summary of financial results for 1Q2024
 
managementaccountingunitiv-230422140105-dd17d80b.ppt
managementaccountingunitiv-230422140105-dd17d80b.pptmanagementaccountingunitiv-230422140105-dd17d80b.ppt
managementaccountingunitiv-230422140105-dd17d80b.ppt
 
how to sell pi coins in South Korea profitably.
how to sell pi coins in South Korea profitably.how to sell pi coins in South Korea profitably.
how to sell pi coins in South Korea profitably.
 
what is the best method to sell pi coins in 2024
what is the best method to sell pi coins in 2024what is the best method to sell pi coins in 2024
what is the best method to sell pi coins in 2024
 
innovative-invoice-discounting-platforms-in-india-empowering-retail-investors...
innovative-invoice-discounting-platforms-in-india-empowering-retail-investors...innovative-invoice-discounting-platforms-in-india-empowering-retail-investors...
innovative-invoice-discounting-platforms-in-india-empowering-retail-investors...
 
what is a pi whale and how to access one.
what is a pi whale and how to access one.what is a pi whale and how to access one.
what is a pi whale and how to access one.
 
Intro_Economics_ GPresentation Week 4.pptx
Intro_Economics_ GPresentation Week 4.pptxIntro_Economics_ GPresentation Week 4.pptx
Intro_Economics_ GPresentation Week 4.pptx
 
234Presentation on Indian Debt Market.ppt
234Presentation on Indian Debt Market.ppt234Presentation on Indian Debt Market.ppt
234Presentation on Indian Debt Market.ppt
 
how to sell pi coins at high rate quickly.
how to sell pi coins at high rate quickly.how to sell pi coins at high rate quickly.
how to sell pi coins at high rate quickly.
 
The new type of smart, sustainable entrepreneurship and the next day | Europe...
The new type of smart, sustainable entrepreneurship and the next day | Europe...The new type of smart, sustainable entrepreneurship and the next day | Europe...
The new type of smart, sustainable entrepreneurship and the next day | Europe...
 
US Economic Outlook - Being Decided - M Capital Group August 2021.pdf
US Economic Outlook - Being Decided - M Capital Group August 2021.pdfUS Economic Outlook - Being Decided - M Capital Group August 2021.pdf
US Economic Outlook - Being Decided - M Capital Group August 2021.pdf
 
How to get verified on Coinbase Account?_.docx
How to get verified on Coinbase Account?_.docxHow to get verified on Coinbase Account?_.docx
How to get verified on Coinbase Account?_.docx
 
Commercial Bank Economic Capsule - May 2024
Commercial Bank Economic Capsule - May 2024Commercial Bank Economic Capsule - May 2024
Commercial Bank Economic Capsule - May 2024
 
The European Unemployment Puzzle: implications from population aging
The European Unemployment Puzzle: implications from population agingThe European Unemployment Puzzle: implications from population aging
The European Unemployment Puzzle: implications from population aging
 

Madras cements 2 qfy2011 251010

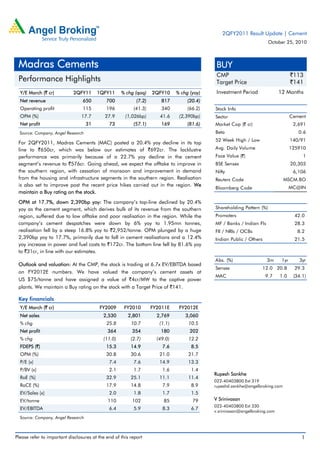
  • 1. Please refer to important disclosures at the end of this report 1 Y/E March (` cr) 2QFY11 1QFY11 % chg (qoq) 2QFY10 % chg (yoy) Net revenue 650 700 (7.2) 817 (20.4) Operating profit 115 196 (41.3) 340 (66.2) OPM (%) 17.7 27.9 (1,026bp) 41.6 (2,390bp) Net profit 31 73 (57.1) 169 (81.6) Source: Company, Angel Research For 2QFY2011, Madras Cements (MAC) posted a 20.4% yoy decline in its top line to `650cr, which was below our estimates of `692cr. The lacklustre performance was primarily because of a 22.7% yoy decline in the cement segment’s revenue to `576cr. Going ahead, we expect the offtake to improve in the southern region, with cessation of monsoon and improvement in demand from the housing and infrastructure segments in the southern region. Realisation is also set to improve post the recent price hikes carried out in the region. We maintain a Buy rating on the stock. OPM at 17.7%, down 2,390bp yoy: The company’s top-line declined by 20.4% yoy as the cement segment, which derives bulk of its revenue from the southern region, suffered due to low offtake and poor realisation in the region. While the company’s cement despatches were down by 6% yoy to 1.95mn tonnes, realisation fell by a steep 16.8% yoy to `2,952/tonne. OPM plunged by a huge 2,390bp yoy to 17.7%, primarily due to fall in cement realisations and a 12.4% yoy increase in power and fuel costs to `172cr. The bottom line fell by 81.6% yoy to `31cr, in line with our estimates. Outlook and valuation: At the CMP, the stock is trading at 6.7x EV/EBITDA based on FY2012E numbers. We have valued the company’s cement assets at US $75/tonne and have assigned a value of `4cr/MW to the captive power plants. We maintain a Buy rating on the stock with a Target Price of `141. Key financials Y/E March (` cr) FY2009 FY2010 FY2011E FY2012E Net sales 2,530 2,801 2,769 3,060 % chg 25.8 10.7 (1.1) 10.5 Net profit 364 354 180 202 % chg (11.0) (2.7) (49.0) 12.2 FDEPS (`) 15.3 14.9 7.6 8.5 OPM (%) 30.8 30.6 21.0 21.7 P/E (x) 7.4 7.6 14.9 13.3 P/BV (x) 2.1 1.7 1.6 1.4 RoE (%) 32.9 25.1 11.1 11.4 RoCE (%) 17.9 14.8 7.9 8.9 EV/Sales (x) 2.0 1.8 1.7 1.5 EV/tonne 110 102 85 79 EV/EBITDA 6.4 5.9 8.3 6.7 Source: Company, Angel Research BUY CMP `113 Target Price `141 Investment Period 12 Months Stock Info Sector Bloomberg Code Shareholding Pattern (%) Promoters 42.0 MF / Banks / Indian Fls 28.3 FII / NRIs / OCBs 8.2 Indian Public / Others 21.5 Abs. (%) 3m 1yr 3yr Sensex 12.0 20.8 29.3 MAC 9.7 1.0 (34.1) 1 20,303 6,106 MSCM.BO MC@IN Face Value (`) BSE Sensex Nifty Reuters Code 2,691 0.6 140/91 125910 Cement Avg. Daily Volume Market Cap (` cr) Beta 52 Week High / Low Rupesh Sankhe 022-40403800 Ext 319 rupeshd.sankhe@angelbroking.com V Srinivasan 022-40403800 Ext 330 v.srinivasan@angelbroking.com Madras Cements Performance Highlights 2QFY2011 Result Update | Cement October 25, 2010
  • 2. Madras Cements | 2QFY2011 Result Update October 25, 2010 2 Exhibit 1: 2QFY2011 performance Y/E March (` cr) 2QFY2011 1QFY2011 % chg (qoq) 2QFY2010 % chg (yoy) 1HFY2011 1HFY2010 % chg Net sales 650 700 (7.2) 817 (20.4) 1,350 1,621 (16.7) Net raw-material costs 120 84 42.8 86 38.4 203 226 (9.9) (% of sales) 18.4 12.0 10.6 15.1 13.9 Power & fuel 172 174 (1.5) 153 12.4 346 293 17.8 (% of sales) 26.4 24.9 18.7 25.6 18.1 Staff costs 37 39 (5.7) 31 20.2 77 64 20.6 (% of sales) 5.7 5.6 3.8 5.7 3.9 Freight & forwarding 122 123 (0.1) 119 2.5 245 246 (0.3) (% of sales) 18.8 17.5 14.6 18.1 15.2 Other expenses 85 85 (0.4) 87.9 (4) 169.5 163 4.3 (% of sales) 13.0 12.1 10.8 12.6 10.0 Total expenditure 535.1 504.8 6.0 477.2 12.2 1,040 991 5.0 Operating profit 115 196 (41.3) 340 (66.2) 310 630 (50.8) OPM (%) 17.7 27.9 41.6 23.0 38.9 Interest 35 35 - 38 (6.7) 70 75 (6.7) Depreciation 55 54 2.1 47 15.6 109 93 17.5 Other income 3 2 44.1 2 63.3 5 4 21.4 Extr. income/(expense) - - - - Provision for taxation (4) 36 (109.7) 87 (104.0) 32 158 (79.4) (% of PBT) (12.7) 33.2 33.9 23.9 33.9 Reported PAT 31.1 72.6 (57.1) 169.4 (81.6) 103 308 (66.4) PATM (%) 4.8 10.4 20.7 7.7 19.0 Equity capital 23.8 23.8 23.8 23.8 23.8 EPS (`) 1.3 3.1 7.1 4.3 13.0 Adjusted PAT 31 73 (57) 169.4 (81.6) 103 308 (66.4) Source: Company, Angel Research Exhibit 2: Financial performance Source: Company, Angel Research 770 817 611 577 700 650 138 169 16 29 73 31 0 10 20 30 40 50 0 250 500 750 1,000 1QFY10 2QFY10 3QFY10 4QFY10 1QFY11 2QFY11 Net Sales (LHS) Net Profit (LHS) OPM (RHS) (` cr) (%)
  • 3. Madras Cements | 2QFY2011 Result Update October 25, 2010 3 Exhibit 3: 2QFY2011 – Actual v/s Angel estimates (` cr) Actual Estimates Variation (%) Net sales 650 692 (6.1) Operating profit 115 132 (13.2) Net profit 31 32 (2.8) Source: Company, Angel Research Operational performance During the quarter, MAC’s per tonne cement realisations declined by 16.8% yoy to `2,952. The company’s operating profit per tonne of cement stood at `291, down 78.4% yoy. MAC’s incurred net loss per tonne stood at `21. Exhibit 4: Per tonne analysis Particulars (`) 2QFY2011 1QFY2010 2QFY2010 % chg (yoy) % chg (qoq) Realisation/tonne 2,952 3,189 3,547 (16.8) (7.4) Raw-material cost/tonne 570 406 525 8.5 40.5 Power & fuel cost /tonne 880 843 727 21.0 4.3 Freight cost/tonne 627 593 620 1.2 5.8 Operating profit/tonne 291 826 1,343 (78.4) (64.8) Depreciation/tonne 215 197 167 28.8 8.9 Net profit/tonne (21) 231 567 (103.6) (108.9) Source: Company, Angel Research Exhibit 5: Despatches and realisation trend Source: Company, Angel Research 0 1,000 2,000 3,000 4,000 1.60 1.80 2.00 2.20 1QFY10 2QFY10 3QFY10 4QFY10 1QFY11 2QFY11 Despatches Realisation (RHS) (mtpa) `/ton
  • 4. Madras Cements | 2QFY2011 Result Update October 25, 2010 4 Investment arguments Major player in the south, but limited presence in Andhra Pradesh: MAC is a major cement player in the southern region, with total cement capacity of 10.5mtpa. The company’s despatches have grown at a 12% CAGR over FY2007–10, aided by a 4.5mtpa increase in capacity over the same period. Further, MAC, which is currently facing clinker shortage, is setting up a second clinkerisation unit at its Ariyalur Plant, with capacity of 2mtpa. The total project cost is estimated to be `600cr. Post this expansion, MAC’s cement capacity would expand to 12.5mtpa by the end of FY2011. Thus, the company’s overall capacity is set to more than double over FY2007–12E. MAC derives ~50% of its cement revenue from Tamil Nadu and only 19% from Andhra Pradesh, which is the worst affected region in terms of demand slowdown and price correction. Thus, the company is better placed as compared to players with major exposure to Andhra Pradesh. Exhibit 6: Geography-wise revenue breakup (FY2010) Source: Company, Angel Research Exhibit 7: Installed capacity Source: Company, Angel Research Installation of new captive power capacities to improve margins: MAC has been adding up its windmill capacity to reduce dependence on the state grid for power requirement. The company’s windmill capacity currently stands at 163MW, which is sufficient to handle close to 61% of its total power requirements. Going ahead, MAC is planning to invest `310cr to establish 85MW of captive thermal power plant capacity, which includes a 60MW unit at Ariyalur and a 25MW plant at RR Nagar. Outlook and valuation: At the CMP, the stock is trading at an EV/EBITDA of 6.7x based on FY2012E numbers. We have valued the company’s cement assets at US $75/tonne and have assigned a value of `4cr/MW to the captive power plants. We maintain a Buy rating on the stock with a Target Price of `141. 47% 24% 19% 8% 2% Tamil Nadu Kerala Andhra Karnataka Others 6.0 8.0 10.0 10.5 12.5 12.5 0.0 4.0 8.0 12.0 16.0 FY07 FY08 FY09 FY10 FY11E FY12E (mtpa)
  • 5. Madras Cements | 2QFY2011 Result Update October 25, 2010 5 Exhibit 8: SOTP-based target price (FY2012E) Particulars Parameter Value (` cr) Target EV/tonne US $75 5,191 CPP* (244 MW) `4cr/MW 976 Market cap (` cr) 3,363 No. of shares (cr) 23.8 Target price (`) 141 Source: Angel Research; Note: * CPP refers to captive power plants Exhibit 9: Change in estimates (` cr) FY2011E FY2012E Earlier Revised Var. (%) Earlier Revised Var. (%) Net sales 2,746 2,769 0.8 3,117 3,060 (1.8) Operating exp. 2,180 2,188 0.4 2,441 2,395 (1.9) Operating profit 566 581 2.5 676 665 (1.6) Depreciation 209 209 0.0 248 248 0.0 Interest 148 148 (0.0) 133 133 (0.0) PBT 226 241 6.4 313 302 (3.5) Tax 75 60 (19.4) 103 100 (3.6) PAT 152 180 19.1 210 202 (3.5) Source: Company, Angel Research Exhibit 10: Key assumptions Earlier estimates Revised estimates Particulars FY11E FY12E FY11E FY12E Installed capacity – Cement (mtpa) 12.5 12.5 12.5 12.5 YoY growth (%) 19.1 - 19.1 - Utilisation (%) 69.0 76.0 67.0 73.0 Despatches growth (%) 9.1 10.4 5.1 9.0 Realisation growth (%) (14.0) 2.5 (15.0) 1.0 Source: Angel Research Exhibit 11: One-year forward EV/tonne (US $) Source: Company, Angel Research 0 3,000 6,000 9,000 12,000 Apr-05 Apr-06 Apr-07 Apr-08 Apr-09 Apr-10 EV(`cr) EV $70 $90 $110 $130
  • 6. Madras Cements | 2QFY2011 Result Update October 25, 2010 6 Exhibit 12: Recommendation summary Company Reco. CMP Tgt. Price Upside FY2012E FY2012E FY2010-12E FY2012E FY2012E (`) (`) (%) P/BV (x) P/E (x) EPS CAGR (%) RoCE (%) RoE (%) ACC* Neutral 984 - - 2.5 19.3 (22.5) 16.1 13.4 Ambuja Cements* Neutral 139 - - 2.7 21.4 (9.9) 16.7 13.3 Grasim Ind. Neutral 2,252 - - 1.1 9.0 (10.9) 14.1 12.4 India Cements Buy 113 139 23.0 1.0 26.9 (39.6) 4.5 3.0 JK Lakshmi Buy 62 92 48.3 0.6 5.3 (22.9) 10.0 11.3 Kesoram Ind. Buy 304 437 44.0 0.7 4.6 13.1 11.8 16.3 Madras Cements Buy 113 141 24.7 1.4 13.3 (24.4) 8.9 11.4 UltraTech Cement Neutral 1,111 - - 1.9 14.9 (7.9) 15.2 14.0 Source: Company, Angel Research; Note: *Year ending December.
  • 7. Madras Cements | 2QFY2011 Result Update October 25, 2010 7 Profit and loss statement (Standalone) Y/E March (` cr) FY07 FY08 FY09 FY10 FY11E FY12E Net Sales 1,574 2,012 2,530 2,801 2,769 3,060 Total operating income 1,574 2,012 2,530 2,801 2,769 3,060 % chg 56 28 26 11 (1.1) 10.5 Total Expenditure 1,018 1,260 1,752 1,943 2,188 2,395 Net Raw Materials 214 248 362 398 474 509 Other Mfg costs 310 408 602 598 663 714 Personnel 57 81 110 137 158 181 Other 438 523 678 810 893 992 EBITDA 556 752 778 858 581 665 % chg 163.7 35.3 3.5 10.2 (32.3) 14.5 (% of Net Sales) 35.3 37.4 30.8 30.6 21.0 21.7 Depreciation& Amortisation 72 93 138 196 209 248 EBIT 484 659 641 662 372 417 % chg 232.4 36.1 (2.8) 3.2 (43.8) 12.0 (% of Net Sales) 30.8 32.8 25.3 23.6 13.4 13.6 Interest & other Charges 23 52 110 152 148 133 Other Income 8 9 15 20 17 18 (% of PBT) 1.6 1.5 2.8 3.9 6.9 6.1 Recurring PBT 469 617 546 530 241 302 % chg 303.6 31.6 (11.5) (2.8) (54.6) 25.6 Extraordinary Expense/(Inc.) - - - - - - PBT (reported) 469 617 545 530 241 302 Tax 161 209 182 177 60 100 (% of PBT) 34.3 33.8 33.4 33.3 25.0 33.0 PAT (reported) 308 408 364 354 180 202 ADJ. PAT 308 408 364 354 180 202 % chg 285.7 32.5 (10.9) (2.8) (49.0) 12.2 (% of Net Sales) 19.6 20.3 14.4 12.6 6.5 6.6 Basic EPS (`) 26 34 15 15 8 9 Fully Diluted EPS (`) 26 34 15 15 8 9 % chg 288.9 34.5 (55.5) (2.7) (49.0) 12.2
  • 8. Madras Cements | 2QFY2011 Result Update October 25, 2010 8 Balance Sheet (Standalone) Y/E March (` cr) FY07 FY08 FY09 FY10 FY11E FY12E SOURCES OF FUNDS Equity Share Capital 12 12 24 24 24 24 Preference Capital - - - - Reserves& Surplus 654 942 1,236 1,534 1,671 1,845 Shareholders’ Funds 666 954 1,260 1,558 1,694 1,868 Total Loans 677 1,636 2,463 2,567 2,467 2,217 Deferred Tax Liability 226 363 490 585 585 585 Total Liabilities 1,569 2,952 4,214 4,710 4,746 4,670 APPLICATION OF FUNDS Gross Block 1,799 2,714 3,918 4,811 4,911 5,511 Less: Acc. Depreciation 718 808 918 1,119 1,327 1,575 Net Block 1,081 1,906 3,000 3,693 3,584 3,936 Capital Work-in-Progress 178 576 635 318 418 268 Goodwill - - - - - - Investments 89 89 89 89 89 89 Current Assets 615 779 914 1,135 1,184 1,012 Cash 57 23 39 35 47 32 Loans & Advances 365 452 456 532 532 532 Other 194 304 419 568 605 448 Current liabilities 395 402 440 546 550 656 Net Current Assets 220 378 473 589 634 356 Mis. Exp. not written off 2 3 16 21 21 21 Total Assets 1,569 2,952 4,214 4,710 4,746 4,670
  • 9. Madras Cements | 2QFY2011 Result Update October 25, 2010 9 Cash flow statement (Standalone) Y/E March (` cr) FY07 FY08 FY09 FY10 FY11E FY12E Profit before tax 469 617 545 530 241 302 Depreciation 72 93 138 196 209 248 Change in Working Capital (64) (72) 114 121 (52) 262 Less: Other income 8 9 15 20 17 18 Direct taxes paid 161 209 182 177 60 100 Cash Flow from Operations 308 420 600 651 321 694 (Inc)/ Decin Fixed Assets (326) (1,314) (1,262) (576) (200) (450) (Inc)/ Dec in Investments - - - - - - Other income 8 9 15 20 17 18 Cash Flow from Investing (318) (1,304) (1,247) (556) (183) (432) Issue of Equity - - - - - - Inc./(Dec.) in loans 75 958 828 103 (100) (250) Dividend Paid (Incl. Tax) 35 56 56 50 25 28 Others 23 52 110 152 - - Cash Flow from Financing 17 850 662 (98) (125) (278) Inc./(Dec.) in Cash 7 (34) 16 (3) 12 (16) Opening Cash balances 49 57 23 39 35 47 Closing Cash balances 57 23 39 35 47 32
  • 10. Madras Cements | 2QFY2011 Result Update October 25, 2010 10 Key ratios Y/E March FY07 FY08 FY09 FY10 FY11E FY12E Valuation Ratio (x) P/E (on FDEPS) 3.9 2.9 6.6 6.8 14.9 13.3 P/CEPS 3.2 2.4 4.8 4.4 6.9 6.0 P/BV 1.8 1.3 1.9 1.5 1.6 1.4 Dividend yield (%) 2.9 4.7 2.3 2.1 0.9 1.1 EV/Sales 1.1 1.3 1.8 1.7 1.7 1.5 EV/EBITDA 3.0 3.5 6.0 5.6 8.3 6.7 EV / Total Assets 1.1 0.9 1.1 1.0 1.0 1.0 Per Share Data (`) EPS (Basic) 25.5 34.3 15.3 14.9 7.6 8.5 EPS (fully diluted) 25.5 34.3 15.3 14.9 7.6 8.5 Cash EPS 31.5 42.1 21.1 23.1 16.4 18.9 DPS 2.9 4.7 2.3 2.1 1.1 1.2 Book Value 55.2 80.1 53.0 65.5 71.2 78.5 DuPont Analysis EBIT margin 30.8 32.8 25.3 23.6 13.4 13.6 Tax retention ratio 65.7 66.2 66.6 66.7 75.0 67.0 Asset turnover (x) 1.2 0.9 0.7 0.6 0.6 0.7 ROIC (Post-tax) 24.0 19.6 12.0 10.0 6.0 6.0 Cost of Debt (Post Tax) 2.3 3.0 3.6 4.0 4.4 3.8 Leverage (x) 1.1 1.2 1.7 1.7 1.5 1.3 Operating ROE 48.2 40.1 26.8 20.2 8.2 8.7 Returns (%) ROCE (Pre-tax) 35.1 29.1 17.9 14.8 7.9 8.9 Angel ROIC (Pre-tax) 41.5 37.1 22.2 17.0 8.7 9.8 ROE 58.2 50.4 32.9 25.1 11.1 11.4 Turnover ratios (x) Asset Turnover (Gross Block) 0.9 0.9 0.8 0.6 0.6 0.6 Inventory / Sales (days) 27 34 41 48 57.9 49.5 Receivables (days) 13 12 11 16 19.4 13.3 Payables (days) 112 115 88 93 91.4 91.9 WC cycle (ex-cash) (days) 25 47 57 64 75.2 54.3 Solvency ratios (x) Net debt to equity 0.8 1.6 1.9 1.6 1.4 1.1 Net debt to EBITDA 1.0 2.1 3.0 2.9 4.1 3.2 Interest Coverage (EBIT / Int.) 21.2 12.7 5.8 4.4 2.5 3.1
  • 11. Madras Cements | 2QFY2011 Result Update October 25, 2010 11 Research Team Tel: 022 - 4040 3800 E-mail: research@angeltrade.com Website: www.angeltrade.com DISCLAIMER This document is solely for the personal information of the recipient, and must not be singularly used as the basis of any investment decision. Nothing in this document should be construed as investment or financial advice. Each recipient of this document should make such investigations as they deem necessary to arrive at an independent evaluation of an investment in the securities of the companies referred to in this document (including the merits and risks involved), and should consult their own advisors to determine the merits and risks of such an investment. Angel Broking Limited, its affiliates, directors, its proprietary trading and investment businesses may, from time to time, make investment decisions that are inconsistent with or contradictory to the recommendations expressed herein. The views contained in this document are those of the analyst, and the company may or may not subscribe to all the views expressed within. Reports based on technical and derivative analysis center on studying charts of a stock's price movement, outstanding positions and trading volume, as opposed to focusing on a company's fundamentals and, as such, may not match with a report on a company's fundamentals. The information in this document has been printed on the basis of publicly available information, internal data and other reliable sources believed to be true, but we do not represent that it is accurate or complete and it should not be relied on as such, as this document is for general guidance only. Angel Broking Limited or any of its affiliates/ group companies shall not be in any way responsible for any loss or damage that may arise to any person from any inadvertent error in the information contained in this report. Angel Broking Limited has not independently verified all the information contained within this document. Accordingly, we cannot testify, nor make any representation or warranty, express or implied, to the accuracy, contents or data contained within this document. While Angel Broking Limited endeavours to update on a reasonable basis the information discussed in this material, there may be regulatory, compliance, or other reasons that prevent us from doing so. This document is being supplied to you solely for your information, and its contents, information or data may not be reproduced, redistributed or passed on, directly or indirectly. Angel Broking Limited and its affiliates may seek to provide or have engaged in providing corporate finance, investment banking or other advisory services in a merger or specific transaction to the companies referred to in this report, as on the date of this report or in the past. Neither Angel Broking Limited, nor its directors, employees or affiliates shall be liable for any loss or damage that may arise from or in connection with the use of this information. Note: Please refer to the important `Stock Holding Disclosure' report on the Angel website (Research Section). Also, please refer to the latest update on respective stocks for the disclosure status in respect of those stocks. Angel Broking Limited and its affiliates may have investment positions in the stocks recommended in this report. Disclosure of Interest Statement Madras Cements 1. Analyst ownership of the stock No 2. Angel and its Group companies ownership of the stock No 3. Angel and its Group companies' Directors ownership of the stock No 4. Broking relationship with company covered No Note: We have not considered any Exposure below ` 1 lakh for Angel, its Group companies and Directors. Ratings (Returns) : Buy (> 15%) Accumulate (5% to 15%) Neutral (-5 to 5%) Reduce (-5% to 15%) Sell (< -15%)