Jagran Prakashan Q2FY15: Buy for a target of Rs165IndiaNotes.com
JAGP’s 2QFY15 EBITDA grew 16% YoY to INR1.06b (vs est of INR1.04b), supported by high single-digit growth in print advertising/circulation revenue and lower ‘other expenses’.
Jagran Prakashan Q2FY15: Buy for a target of Rs165IndiaNotes.com
JAGP’s 2QFY15 EBITDA grew 16% YoY to INR1.06b (vs est of INR1.04b), supported by high single-digit growth in print advertising/circulation revenue and lower ‘other expenses’.
Ceat Q1FY15: Higher opex impact margins; Book profitsIndiaNotes.com
CEAT reported results which were below expectations. Sales were broadly in line with expectations but EBITDA margin declined by 160 bps QoQ. Book profits at current levels as there is no substantial upside from current levels.
Ceat Q1FY15: Higher opex impact margins; Book profitsIndiaNotes.com
CEAT reported results which were below expectations. Sales were broadly in line with expectations but EBITDA margin declined by 160 bps QoQ. Book profits at current levels as there is no substantial upside from current levels.
Vaibhav Global Q1FY15: Outlook continues to remain positive; HoldIndiaNotes.com
As expected, the company reported sales growth of 20.3% yoy to Rs 301 cr, on account of sluggish TV Sales. Q1 is a temporary blip and Nirmal Bang expects the growth to be normalized from Q3 onwards (Q2 is seasonally weak quarter for the company). Hold
how to swap pi coins to foreign currency withdrawable.DOT TECH
As of my last update, Pi is still in the testing phase and is not tradable on any exchanges.
However, Pi Network has announced plans to launch its Testnet and Mainnet in the future, which may include listing Pi on exchanges.
The current method for selling pi coins involves exchanging them with a pi vendor who purchases pi coins for investment reasons.
If you want to sell your pi coins, reach out to a pi vendor and sell them to anyone looking to sell pi coins from any country around the globe.
Below is the contact information for my personal pi vendor.
Telegram: @Pi_vendor_247
Poonawalla Fincorp and IndusInd Bank Introduce New Co-Branded Credit Cardnickysharmasucks
The unveiling of the IndusInd Bank Poonawalla Fincorp eLITE RuPay Platinum Credit Card marks a notable milestone in the Indian financial landscape, showcasing a successful partnership between two leading institutions, Poonawalla Fincorp and IndusInd Bank. This co-branded credit card not only offers users a plethora of benefits but also reflects a commitment to innovation and adaptation. With a focus on providing value-driven and customer-centric solutions, this launch represents more than just a new product—it signifies a step towards redefining the banking experience for millions. Promising convenience, rewards, and a touch of luxury in everyday financial transactions, this collaboration aims to cater to the evolving needs of customers and set new standards in the industry.
Resume
• Real GDP growth slowed down due to problems with access to electricity caused by the destruction of manoeuvrable electricity generation by Russian drones and missiles.
• Exports and imports continued growing due to better logistics through the Ukrainian sea corridor and road. Polish farmers and drivers stopped blocking borders at the end of April.
• In April, both the Tax and Customs Services over-executed the revenue plan. Moreover, the NBU transferred twice the planned profit to the budget.
• The European side approved the Ukraine Plan, which the government adopted to determine indicators for the Ukraine Facility. That approval will allow Ukraine to receive a EUR 1.9 bn loan from the EU in May. At the same time, the EU provided Ukraine with a EUR 1.5 bn loan in April, as the government fulfilled five indicators under the Ukraine Plan.
• The USA has finally approved an aid package for Ukraine, which includes USD 7.8 bn of budget support; however, the conditions and timing of the assistance are still unknown.
• As in March, annual consumer inflation amounted to 3.2% yoy in April.
• At the April monetary policy meeting, the NBU again reduced the key policy rate from 14.5% to 13.5% per annum.
• Over the past four weeks, the hryvnia exchange rate has stabilized in the UAH 39-40 per USD range.
how to sell pi coins in South Korea profitably.DOT TECH
Yes. You can sell your pi network coins in South Korea or any other country, by finding a verified pi merchant
What is a verified pi merchant?
Since pi network is not launched yet on any exchange, the only way you can sell pi coins is by selling to a verified pi merchant, and this is because pi network is not launched yet on any exchange and no pre-sale or ico offerings Is done on pi.
Since there is no pre-sale, the only way exchanges can get pi is by buying from miners. So a pi merchant facilitates these transactions by acting as a bridge for both transactions.
How can i find a pi vendor/merchant?
Well for those who haven't traded with a pi merchant or who don't already have one. I will leave the telegram id of my personal pi merchant who i trade pi with.
Tele gram: @Pi_vendor_247
#pi #sell #nigeria #pinetwork #picoins #sellpi #Nigerian #tradepi #pinetworkcoins #sellmypi
how can i use my minded pi coins I need some funds.DOT TECH
If you are interested in selling your pi coins, i have a verified pi merchant, who buys pi coins and resell them to exchanges looking forward to hold till mainnet launch.
Because the core team has announced that pi network will not be doing any pre-sale. The only way exchanges like huobi, bitmart and hotbit can get pi is by buying from miners.
Now a merchant stands in between these exchanges and the miners. As a link to make transactions smooth. Because right now in the enclosed mainnet you can't sell pi coins your self. You need the help of a merchant,
i will leave the telegram contact of my personal pi merchant below. 👇 I and my friends has traded more than 3000pi coins with him successfully.
@Pi_vendor_247
The secret way to sell pi coins effortlessly.DOT TECH
Well as we all know pi isn't launched yet. But you can still sell your pi coins effortlessly because some whales in China are interested in holding massive pi coins. And they are willing to pay good money for it. If you are interested in selling I will leave a contact for you. Just telegram this number below. I sold about 3000 pi coins to him and he paid me immediately.
Telegram: @Pi_vendor_247
how to sell pi coins effectively (from 50 - 100k pi)DOT TECH
Anywhere in the world, including Africa, America, and Europe, you can sell Pi Network Coins online and receive cash through online payment options.
Pi has not yet been launched on any exchange because we are currently using the confined Mainnet. The planned launch date for Pi is June 28, 2026.
Reselling to investors who want to hold until the mainnet launch in 2026 is currently the sole way to sell.
Consequently, right now. All you need to do is select the right pi network provider.
Who is a pi merchant?
An individual who buys coins from miners on the pi network and resells them to investors hoping to hang onto them until the mainnet is launched is known as a pi merchant.
debuts.
I'll provide you the Telegram username
@Pi_vendor_247
how can I sell my pi coins for cash in a pi APPDOT TECH
You can't sell your pi coins in the pi network app. because it is not listed yet on any exchange.
The only way you can sell is by trading your pi coins with an investor (a person looking forward to hold massive amounts of pi coins before mainnet launch) .
You don't need to meet the investor directly all the trades are done with a pi vendor/merchant (a person that buys the pi coins from miners and resell it to investors)
I Will leave The telegram contact of my personal pi vendor, if you are finding a legitimate one.
@Pi_vendor_247
#pi network
#pi coins
#money
what is the best method to sell pi coins in 2024DOT TECH
The best way to sell your pi coins safely is trading with an exchange..but since pi is not launched in any exchange, and second option is through a VERIFIED pi merchant.
Who is a pi merchant?
A pi merchant is someone who buys pi coins from miners and pioneers and resell them to Investors looking forward to hold massive amounts before mainnet launch in 2026.
I will leave the telegram contact of my personal pi merchant to trade pi coins with.
@Pi_vendor_247
If you are looking for a pi coin investor. Then look no further because I have the right one he is a pi vendor (he buy and resell to whales in China). I met him on a crypto conference and ever since I and my friends have sold more than 10k pi coins to him And he bought all and still want more. I will drop his telegram handle below just send him a message.
@Pi_vendor_247
how to sell pi coins in all Africa Countries.DOT TECH
Yes. You can sell your pi network for other cryptocurrencies like Bitcoin, usdt , Ethereum and other currencies And this is done easily with the help from a pi merchant.
What is a pi merchant ?
Since pi is not launched yet in any exchange. The only way you can sell right now is through merchants.
A verified Pi merchant is someone who buys pi network coins from miners and resell them to investors looking forward to hold massive quantities of pi coins before mainnet launch in 2026.
I will leave the telegram contact of my personal pi merchant to trade with.
@Pi_vendor_247
The European Unemployment Puzzle: implications from population agingGRAPE
We study the link between the evolving age structure of the working population and unemployment. We build a large new Keynesian OLG model with a realistic age structure, labor market frictions, sticky prices, and aggregate shocks. Once calibrated to the European economy, we quantify the extent to which demographic changes over the last three decades have contributed to the decline of the unemployment rate. Our findings yield important implications for the future evolution of unemployment given the anticipated further aging of the working population in Europe. We also quantify the implications for optimal monetary policy: lowering inflation volatility becomes less costly in terms of GDP and unemployment volatility, which hints that optimal monetary policy may be more hawkish in an aging society. Finally, our results also propose a partial reversal of the European-US unemployment puzzle due to the fact that the share of young workers is expected to remain robust in the US.
Empowering the Unbanked: The Vital Role of NBFCs in Promoting Financial Inclu...Vighnesh Shashtri
In India, financial inclusion remains a critical challenge, with a significant portion of the population still unbanked. Non-Banking Financial Companies (NBFCs) have emerged as key players in bridging this gap by providing financial services to those often overlooked by traditional banking institutions. This article delves into how NBFCs are fostering financial inclusion and empowering the unbanked.
Latino Buying Power - May 2024 Presentation for Latino CaucusDanay Escanaverino
Unlock the potential of Latino Buying Power with this in-depth SlideShare presentation. Explore how the Latino consumer market is transforming the American economy, driven by their significant buying power, entrepreneurial contributions, and growing influence across various sectors.
**Key Sections Covered:**
1. **Economic Impact:** Understand the profound economic impact of Latino consumers on the U.S. economy. Discover how their increasing purchasing power is fueling growth in key industries and contributing to national economic prosperity.
2. **Buying Power:** Dive into detailed analyses of Latino buying power, including its growth trends, key drivers, and projections for the future. Learn how this influential group’s spending habits are shaping market dynamics and creating opportunities for businesses.
3. **Entrepreneurial Contributions:** Explore the entrepreneurial spirit within the Latino community. Examine how Latino-owned businesses are thriving and contributing to job creation, innovation, and economic diversification.
4. **Workforce Statistics:** Gain insights into the role of Latino workers in the American labor market. Review statistics on employment rates, occupational distribution, and the economic contributions of Latino professionals across various industries.
5. **Media Consumption:** Understand the media consumption habits of Latino audiences. Discover their preferences for digital platforms, television, radio, and social media. Learn how these consumption patterns are influencing advertising strategies and media content.
6. **Education:** Examine the educational achievements and challenges within the Latino community. Review statistics on enrollment, graduation rates, and fields of study. Understand the implications of education on economic mobility and workforce readiness.
7. **Home Ownership:** Explore trends in Latino home ownership. Understand the factors driving home buying decisions, the challenges faced by Latino homeowners, and the impact of home ownership on community stability and economic growth.
This SlideShare provides valuable insights for marketers, business owners, policymakers, and anyone interested in the economic influence of the Latino community. By understanding the various facets of Latino buying power, you can effectively engage with this dynamic and growing market segment.
Equip yourself with the knowledge to leverage Latino buying power, tap into their entrepreneurial spirit, and connect with their unique cultural and consumer preferences. Drive your business success by embracing the economic potential of Latino consumers.
**Keywords:** Latino buying power, economic impact, entrepreneurial contributions, workforce statistics, media consumption, education, home ownership, Latino market, Hispanic buying power, Latino purchasing power.
when will pi network coin be available on crypto exchange.DOT TECH
There is no set date for when Pi coins will enter the market.
However, the developers are working hard to get them released as soon as possible.
Once they are available, users will be able to exchange other cryptocurrencies for Pi coins on designated exchanges.
But for now the only way to sell your pi coins is through verified pi vendor.
Here is the telegram contact of my personal pi vendor
@Pi_vendor_247
USDA Loans in California: A Comprehensive Overview.pptxmarketing367770
USDA Loans in California: A Comprehensive Overview
If you're dreaming of owning a home in California's rural or suburban areas, a USDA loan might be the perfect solution. The U.S. Department of Agriculture (USDA) offers these loans to help low-to-moderate-income individuals and families achieve homeownership.
Key Features of USDA Loans:
Zero Down Payment: USDA loans require no down payment, making homeownership more accessible.
Competitive Interest Rates: These loans often come with lower interest rates compared to conventional loans.
Flexible Credit Requirements: USDA loans have more lenient credit score requirements, helping those with less-than-perfect credit.
Guaranteed Loan Program: The USDA guarantees a portion of the loan, reducing risk for lenders and expanding borrowing options.
Eligibility Criteria:
Location: The property must be located in a USDA-designated rural or suburban area. Many areas in California qualify.
Income Limits: Applicants must meet income guidelines, which vary by region and household size.
Primary Residence: The home must be used as the borrower's primary residence.
Application Process:
Find a USDA-Approved Lender: Not all lenders offer USDA loans, so it's essential to choose one approved by the USDA.
Pre-Qualification: Determine your eligibility and the amount you can borrow.
Property Search: Look for properties in eligible rural or suburban areas.
Loan Application: Submit your application, including financial and personal information.
Processing and Approval: The lender and USDA will review your application. If approved, you can proceed to closing.
USDA loans are an excellent option for those looking to buy a home in California's rural and suburban areas. With no down payment and flexible requirements, these loans make homeownership more attainable for many families. Explore your eligibility today and take the first step toward owning your dream home.
USDA Loans in California: A Comprehensive Overview.pptx
Ht media ru2 qfy2011-281010
1. Please refer to important disclosures at the end of this report 1
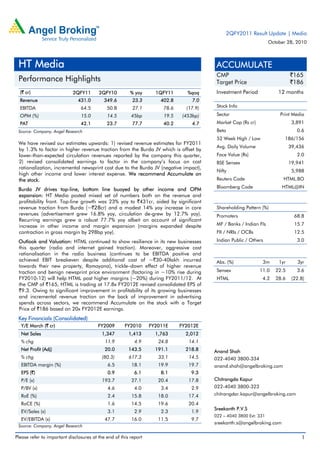
(` cr) 2QFY11 2QFY10 % yoy 1QFY11 %qoq
Revenue 431.0 349.6 23.3 402.8 7.0
EBITDA 64.5 50.8 27.1 78.6 (17.9)
OPM (%) 15.0 14.5 45bp 19.5 (453bp)
PAT 42.1 23.7 77.7 40.2 4.7
Source: Company, Angel Research
We have revised our estimates upwards: 1) revised revenue estimates for FY2011
by 1.3% to factor in higher revenue traction from the Burda JV which is offset by
lower-than-expected circulation revenues reported by the company this quarter,
2) revised consolidated earnings to factor in the company’s focus on cost
rationalization, incremental newsprint cost due to the Burda JV (negative impact),
high other income and lower interest expense. We recommend Accumulate on
the stock.
Burda JV drives top-line, bottom line buoyed by other income and OPM
expansion: HT Media posted mixed set of numbers both on the revenue and
profitability front. Top-line growth was 23% yoy to `431cr, aided by significant
revenue traction from Burda (~`28cr) and a modest 14% yoy increase in core
revenues (advertisement grew 16.8% yoy, circulation de-grew by 12.7% yoy).
Recurring earnings grew a robust 77.7% yoy albeit on account of significant
increase in other income and margin expansion (margins expanded despite
contraction in gross margin by 298bp yoy).
Outlook and Valuation: HTML continued to show resilience in its new businesses
this quarter (radio and internet gained traction). Moreover, aggressive cost
rationalisation in the radio business (continues to be EBITDA positive and
achieved EBIT breakeven despite additional cost of ~`30-40lakh incurred
towards their new property, Ramayana), trickle–down effect of higher revenue
traction and benign newsprint price environment (factoring in ~10% rise during
FY2010-12) will help HTML post higher margins (~20%) during FY2011/12. At
the CMP of `165, HTML is trading at 17.8x FY2012E revised consolidated EPS of
`9.3. Owing to significant improvement in profitability of its growing businesses
and incremental revenue traction on the back of improvement in advertising
spends across sectors, we recommend Accumulate on the stock with a Target
Price of `186 based on 20x FY2012E earnings.
Key Financials (Consolidated)
Y/E March (` cr) FY2009 FY2010 FY2011E FY2012E
Net Sales 1,347 1,413 1,763 2,012
% chg 11.9 4.9 24.8 14.1
Net Profit (Adj) 20.0 143.5 191.1 218.8
% chg (80.3) 617.3 33.1 14.5
EBITDA margin (%) 6.5 18.1 19.9 19.7
EPS (`) 0.9 6.1 8.1 9.3
P/E (x) 193.7 27.1 20.4 17.8
P/BV (x) 4.6 4.0 3.4 2.9
RoE (%) 2.4 15.8 18.0 17.4
RoCE (%) 1.6 14.5 19.6 20.4
EV/Sales (x) 3.1 2.9 2.3 1.9
EV/EBITDA (x) 47.7 16.0 11.5 9.7
Source: Company, Angel Research
ACCUMULATE
CMP `165
Target Price `186
Investment Period 12 months
Stock Info
Sector Print Media
Market Cap (Rs cr) 3,891
Beta 0.6
52 Week High / Low 186/156
Avg. Daily Volume 39,436
Face Value (Rs) 2.0
BSE Sensex 19,941
Nifty 5,988
Reuters Code HTML.BO
Bloomberg Code HTML@IN
Shareholding Pattern (%)
Promoters 68.8
MF / Banks / Indian Fls 15.7
FII / NRIs / OCBs 12.5
Indian Public / Others 3.0
Abs. (%) 3m 1yr 3yr
Sensex 11.0 22.5 3.6
HTML 4.2 28.6 (22.8)
Anand Shah
022-4040 3800-334
anand.shah@angelbroking.com
Chitrangda Kapur
022-4040 3800-323
chitrangdar.kapur@angelbroking.com
Sreekanth P.V.S
022 – 4040 3800 Ext: 331
sreekanth.s@angelbroking.com
HT Media
Performance Highlights
2QFY2011 Result Update | Media
October 28, 2010
3. HT Media|2QFY2011 Result Update
October 28, 2010 3
Top-line growth strong at 23% led by ~20%+ growth in both English
and Hindi
HT Media posted a strong top-line growth of 23% yoy to `431cr (`350cr) driven by
23.6% yoy growth in English and 22.5% yoy growth in Hindi. On a sequential basis,
however, Hindustan reported a decline of 5% in advertising revenue on account of
the seasonality factor (2QFY2010 partly captured the festive season), while for
English print the advertising revenue was modest at 2.5%. Circulation revenue
recorded a decline of 12.7% yoy/10.7% qoq to `41.8cr. Both English print and
Hindustan reported a yoy decline of 25.7% and 5.3% respectively, in circulation.
While Hindustan’s circulation revenue decline maybe attributed to increase in
competitive intensity in its core Bihar/Jharkhand market leading to lower realisation
(with the entry of DB Corp in Ranchi, the cover price of Hindustan was slashed to `2),
the English print circulation suffered on account of higher discounts/free trial
subscription copies distributed in the markets of Mumbai, Punjab, UP and some parts
in Delhi. As part of the company strategy, management has indicated that they
would strive to garner higher advertising revenue going forward by focusing on
attaining higher readership irrespective of the circulation.
Exhibit 3: Top-line growth (Consolidated)
Source: Company, Angel Research
Exhibit 4: English/Hindi Ad-rev. up 13%/30%
Source: Company, Angel Research
Exhibit 5: Circulation rev. declines 12.7%
Source: Company, Angel Research
344 338 330
350 359 374
403
431
-
50
100
150
200
250
300
350
400
450
500
3QFY09 4QFY09 1QFY10 2QFY10 3QFY10 4QFY10 1QFY11 2QFY11
(`cr)
282 286
302
329 329
(5)
-
5
10
15
20
25
-
100
200
300
2QFY10 3QFY10 4QFY10 1QFY11 2QFY11
(%)
(`cr)
Ad Revenue (LHS) YoY growth (RHS)
48 51
43
47
42
(20)
(10)
-
10
20
30
40
-
10
20
30
40
50
60
2QFY10 3QFY10 4QFY10 1QFY11 2QFY11
(%)
(`cr)
Circ Revenue (LHS) YoY growth (RHS)
4. HT Media|2QFY2011 Result Update
October 28, 2010 4
Amongst other segments, the new businesses registered significant revenue
traction. The radio business reported robust top-line growth of 43.7% yoy to
`14.1cr (`9.8cr) on account of increased advertising, while the internet business
contributed `2.7cr to overall revenues. Management has indicated that the
Burda JV contributed `28cr to revenues in its first full quarter of operation. We
expect the Burda JV to contribute ~`75cr to FY2011 top-line.
Bumper earnings despite jump in tax rate, aided by other income
In terms of earnings, HT Media posted a robust growth of 77.7% yoy to `42cr
(`24cr) on a recurring basis and 60.9% yoy growth to `39cr (`24cr) on a
reported basis, despite the spike in the tax rate (up 1,260bp yoy) and
depreciation cost (up 13.1% yoy), aided by significant 520% yoy increase in
other income (spike on account of higher interest and dividend income and a
profit of ~`2.5cr booked through divestment of private treaties), 26% yoy decline
in interest expense and margin expansion. Moreover, the losses in internet
business have reduced (reported an operating loss of `8.5cr in 2QFY2011
compared to `9.5cr in 2QFY2010), while radio has reported an operating profit
of `1.6cr.
Exhibit 6: NPM to sustain at ~10% in FY2011
Source: Company, Angel Research
Exhibit 7: Sequentially Gross margins contracts OPM
Source: Company, Angel Research
OPM expands on cost rationalisation
At the operating level, HT Media posted a modest 45bp yoy expansion in
operating margins, driving 27% yoy growth in operating profit to `64.5cr, aided
by various cost rationalisation measures adopted by the company, which saw
decline in staff cost (down 76bp yoy/156bp qoq), advertising spend (down
232bp yoy/qoq increase of 40bp) and other expenses (down 35bp yoy/23bp
qoq). However, a significant 298bp yoy/592bp qoq contraction in gross margin
on account of hardening newsprint costs and operating loss for Burda JV
(recorded newsprint cost of ~`24cr this quarter) curtailed further OPM
expansion.
In terms of segments, HTML recorded EBIT margin expansion of 327bp yoy to
14% (10.7%), aided by the company’s print business (recorded EBIT of `70cr
and margin expansion of 199bp yoy to 16.7%) and decrease in the losses of
internet businesses, while radio achieved breakeven with a marginal `0.5cr
profit (loss of `2.4cr) at EBIT level.
(2)
-
2
4
6
8
10
12
14
16
(10)
-
10
20
30
40
50
3QFY09 1QFY10 3QFY10 1QFY11
(%)
(`cr)
Recurring PAT (LHS) NPM (RHS)
5.7
(6.1)
15.4 15.5 18.8 21.9 19.5
15.0
56.5 59.8 62.5 64.7
68.4 69.1 67.7
61.7
(20.0)
-
20.0
40.0
60.0
80.0
3QFY09 1QFY10 3QFY10 1QFY11
(%)
OPM Gross Margins
5. HT Media|2QFY2011 Result Update
October 28, 2010 5
Exhibit 8: Segmental Performance (Consolidated)
Y/E March (` cr) 2QFY11 2QFY10 % chg 1HFY2011 1HFY2010 % chg
Revenue
Printing 417.7 339.6 23.0 808.8 667.0 21.3
Radio 14.1 9.8 43.7 26.4 18.7 41.4
Internet 2.7 1.0 179.4 4.7 1.7 176.5
Total Revenue 434.6 350.4 24.0 839.9 687.4 22.2
Less: Inter segment 1.3 0.7 3.3 1.3
Less: Other Op Inc 12.7 0.3 13.9 0.5
Total Net sales 420.6 349.3 20.4 822.7 685.6 20.0
EBIT
Printing 69.9 50.0 39.6 148.4 105.3 40.9
Radio 0.5 (2.4) (0.7) (5.2)
Internet (9.4) (10.0) (18.2) (19.5)
Total EBIT 60.9 37.6 61.8 129.5 80.7 60.5
EBIT Margin (%) 14.0 10.7 327 15.4 11.7
Source: Company, Angel Research
Investment Rationale
Incremental growth in ad revenue, Burda JV to scale up top-line: HTML
recorded a rebound in ad-revenue this quarter, with a yoy growth of 23.6% in
English print and 22.5% yoy in Hindi print, despite 2QFY2010 partially
capturing the festive season. The increase was primarily driven by volume
growth and a marginal improvement in yield. With the up-tick in economy, we
estimate this growth in ad-revenue to sustain, with the English (HT Times and
Mint) and Hindi print businesses (HMVL) posting a CAGR of 15.6% and 26%
over FY2010–12, respectively. While Hindustan’s ad–revenue will grow
maximum in UP (we peg a CAGR of ~32% over FY2010–12), HT Mumbai will
be the maximum growth driver for the English print’s ad-revenue (we peg a
CAGR of ~15% over FY2010–12). Moreover, FY2011 will be the first full
operational year for the Burda JV and we estimate it to contribute ~`75cr to
top-line in FY2011.
Resilience in new business to continue, expect OPM of ~20% in FY1011/12: In
terms of operating performance, HTML continued to show resilience in its new
businesses this quarter (radio and internet gained traction). Moreover,
aggressive cost rationalisation in the radio business (continues to be EBITDA
positive and achieved EBIT breakeven despite additional cost of ~`30-40lakh
incurred towards their new property, Ramayana), trickle–down effect of higher
revenue traction and benign newsprint price environment (factoring in ~10%
rise during FY2010-12E) will help HTML post higher margins (~20%) during
FY2011/12.
Balance sheet to remain healthy, we peg cash to swell to ~`200cr+ in FY2012:
HTML has shown significant turnaround in the net working capital in FY2010,
with improvement in both inventory and debtor turnover. Going forward, for our
FY2011 and FY2012 estimates, we expect the company to sustain its negative
working capital cycle, thus increasing its cash surplus. As of 2QFY2011, the
company recorded ~`91cr of cash in its books, which we peg it to swell to
~`200cr by FY2012. Hence, we believe that HTML is extremely well placed in
terms of funding its expansion plans and continuing investing in its growing
business, owing to a low debt:equity of ~0.2x and low working capital
requirement.
6. HT Media|2QFY2011 Result Update
October 28, 2010 6
Outlook and Valuation
We have revised upwards our revenue expectations for FY2011 by 1.3% to factor
in higher revenue traction from Burda JV - we expect Burda JV to contribute
`75cr in top-line (earlier estimated `60cr), but offset by lower-than-expected
circulation revenues reported by the company (pruned the consolidated
circulation revenues to ~`170cr).
The consolidated earnings are revised upwards to factor in: 1) saving through
the cost rationalisation initiatives taken by the company in terms of
advertisement spend and staff cost but, offset by incremental newsprint cost due
to Burda JV (expect cost to be 75% of estimated Burda’s revenues), 2) high other
income, and 3) lower interest expense as the company pays off its debt.
Exhibit 9: Change in estimates
Parameter Old Estimate New Estimate % chg
(` cr) FY11E FY12E FY11E FY12E FY11E FY12E
Revenue 1,741 2,014 1,763 2,012 1.3 (0.1)
OPM (%) 19.8 20.3 19.9 19.7 7bp (61bp)
EPS (`) 7.6 9.3 8.1 9.3 6.9 0.1
Source: Company, Angel Research
At CMP of `165, HTML is trading at 17.8x FY2012E revised consolidated EPS of
`9.3. Owing to significant improvement in profitability of its growing businesses
and incremental revenue traction on the back of improvement in advertising
spend across sectors, we recommend Accumulate on the stock with a Target
Price of `186 based on 20x FY2012E earnings.
Downside risks to our estimates include – 1) Sharp rise in newsprint prices, 2)
Increased competition, and 3) Higher-than-expected losses or re-investment in
growing businesses (Radio, Mint and Internet).
11. HT Media|2QFY2011 Result Update
October 28, 2010 11
Research Team Tel: 022 - 4040 3800 E-mail: research@angeltrade.com Website: www.angeltrade.com
Disclaimer
This document is solely for the personal information of the recipient, and must not be singularly used as the basis of any investment
decision. Nothing in this document should be construed as investment or financial advice. Each recipient of this document should make
such investigations as they deem necessary to arrive at an independent evaluation of an investment in the securities of the companies
referred to in this document (including the merits and risks involved), and should consult their own advisors to determine the merits and
risks of such an investment.
Angel Broking Limited, its affiliates, directors, its proprietary trading and investment businesses may, from time to time, make
investment decisions that are inconsistent with or contradictory to the recommendations expressed herein. The views contained in this
document are those of the analyst, and the company may or may not subscribe to all the views expressed within.
Reports based on technical and derivative analysis center on studying charts of a stock's price movement, outstanding positions and
trading volume, as opposed to focusing on a company's fundamentals and, as such, may not match with a report on a company's
fundamentals.
The information in this document has been printed on the basis of publicly available information, internal data and other reliable
sources believed to be true, but we do not represent that it is accurate or complete and it should not be relied on as such, as this
document is for general guidance only. Angel Broking Limited or any of its affiliates/ group companies shall not be in any way
responsible for any loss or damage that may arise to any person from any inadvertent error in the information contained in this report.
Angel Broking Limited has not independently verified all the information contained within this document. Accordingly, we cannot testify,
nor make any representation or warranty, express or implied, to the accuracy, contents or data contained within this document. While
Angel Broking Limited endeavours to update on a reasonable basis the information discussed in this material, there may be regulatory,
compliance, or other reasons that prevent us from doing so.
This document is being supplied to you solely for your information, and its contents, information or data may not be reproduced,
redistributed or passed on, directly or indirectly.
Angel Broking Limited and its affiliates may seek to provide or have engaged in providing corporate finance, investment banking or
other advisory services in a merger or specific transaction to the companies referred to in this report, as on the date of this report or in
the past.
Neither Angel Broking Limited, nor its directors, employees or affiliates shall be liable for any loss or damage that may arise from or in
connection with the use of this information.
Note: Please refer to the important `Stock Holding Disclosure' report on the Angel website (Research Section). Also, please refer to the
latest update on respective stocks for the disclosure status in respect of those stocks. Angel Broking Limited and its affiliates may have
investment positions in the stocks recommended in this report.
Disclosure of Interest Statement HTML
1. Analyst ownership of the stock No
2. Angel and its Group companies ownership of the stock No
3. Angel and its Group companies' Directors ownership of the stock No
4. Broking relationship with company covered No
Note: We have not considered any Exposure below Rs 1 lakh for Angel, its Group companies and Directors.
Ratings (Returns) : Buy (> 15%) Accumulate (5% to 15%) Neutral (-5 to 5%)
Reduce (-5% to 15%) Sell (< -15%)