Dividend Policy and Dividend Decision Theories.pptx
Finolex Cables 2QFY2011 Result Update | Power Cables
1. Please refer to important disclosures at the end of this report 1
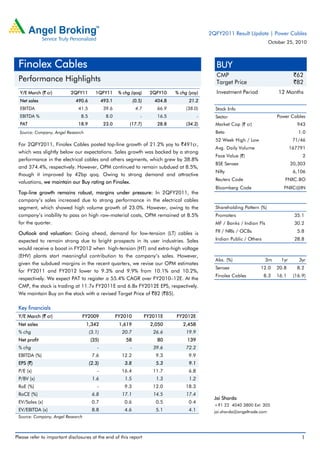
Y/E March (` cr) 2QFY11 1QFY11 % chg (qoq) 2QFY10 % chg (yoy)
Net sales 490.6 493.1 (0.5) 404.8 21.2
EBITDA 41.5 39.6 4.7 66.9 (38.0)
EBITDA % 8.5 8.0 - 16.5 -
PAT 18.9 23.0 (17.7) 28.8 (34.2)
Source: Company, Angel Research
For 2QFY2011, Finolex Cables posted top-line growth of 21.2% yoy to `491cr,
which was slightly below our expectations. Sales growth was backed by a strong
performance in the electrical cables and others segments, which grew by 38.8%
and 374.4%, respectively. However, OPM continued to remain subdued at 8.5%,
though it improved by 42bp qoq. Owing to strong demand and attractive
valuations, we maintain our Buy rating on Finolex.
Top-line growth remains robust, margins under pressure: In 2QFY2011, the
company’s sales increased due to strong performance in the electrical cables
segment, which showed high volume growth of 23.0%. However, owing to the
company’s inability to pass on high raw-material costs, OPM remained at 8.5%
for the quarter.
Outlook and valuation: Going ahead, demand for low-tension (LT) cables is
expected to remain strong due to bright prospects in its user industries. Sales
would receive a boost in FY2012 when high-tension (HT) and extra-high voltage
(EHV) plants start meaningful contribution to the company’s sales. However,
given the subdued margins in the recent quarters, we revise our OPM estimates
for FY2011 and FY2012 lower to 9.3% and 9.9% from 10.1% and 10.2%,
respectively. We expect PAT to register a 55.4% CAGR over FY2010–12E. At the
CMP, the stock is trading at 11.7x FY2011E and 6.8x FY2012E EPS, respectively.
We maintain Buy on the stock with a revised Target Price of `82 (`85).
Key financials
Y/E March (` cr) FY2009 FY2010 FY2011E FY2012E
Net sales 1,342 1,619 2,050 2,458
% chg (3.1) 20.7 26.6 19.9
Net profit (35) 58 80 139
% chg - - 39.6 72.2
EBITDA (%) 7.6 12.2 9.3 9.9
EPS (`) (2.3) 3.8 5.3 9.1
P/E (x) - 16.4 11.7 6.8
P/BV (x) 1.6 1.5 1.3 1.2
RoE (%) - 9.3 12.0 18.3
RoCE (%) 6.8 17.1 14.5 17.4
EV/Sales (x) 0.7 0.6 0.5 0.4
EV/EBITDA (x) 8.8 4.6 5.1 4.1
Source: Company, Angel Research
BUY
CMP `62
Target Price `82
Investment Period 12 Months
Stock Info
Sector
Bloomberg Code FNXC@IN
Shareholding Pattern (%)
Promoters 35.1
MF / Banks / Indian Fls 30.2
FII / NRIs / OCBs 5.8
Indian Public / Others 28.8
Abs. (%) 3m 1yr 3yr
Sensex 12.0 20.8 8.2
Finolex Cables 8.3 16.1 (16.9)
2
20,303
6,106
FNXC.BO
943
1.0
71/46
167791
Power Cables
Avg. Daily Volume
Market Cap (` cr)
Beta
52 Week High / Low
Face Value (`)
BSE Sensex
Nifty
Reuters Code
Jai Sharda
+91 22 4040 3800 Ext: 305
jai.sharda@angeltrade.com
Finolex Cables
Performance Highlights
2QFY2011 Result Update | Power Cables
October 25, 2010
2. Finolex Cables | 2QFY2011 Result Update
October 25, 2010 2
Exhibit 1: 2QFY2011 Performance
Y/E March (` cr) 2QFY2011 1QFY2011 % chg (qoq) 2QFY2010 % chg (yoy) FY2010 FY2009 % chg
Net sales 490.6 493.1 (0.5) 404.8 21.2 1,618.7 1,341.5 20.7
Consumption of RM 385.8 397.2 (2.9) 289.2 33.4 1,221.1 1,057.4 15.5
(% of sales) 78.6 80.6 71.4 75.4 78.8
Staff costs 14.2 15.6 (9.1) 15.7 (9.4) 59.2 53.3 11.1
(% of sales) 2.9 3.2 3.9 3.7 4.0
Other expenses 49.1 40.6 20.9 33.0 48.7 143.2 132.8 7.8
(% of sales) 10.0 8.2 8.2 8.8 9.9
Total expenditure 449.1 453.4 (0.9) 337.9 32.9 1,423.5 1,243.5 14.5
Operating profit 41.5 39.6 4.7 66.9 (38.0) 195.2 98.1 99.1
OPM 8.5 8.0 16.5 12.1 7.3
Interest 4.5 4.0 13.2 4.4 2.7 16.9 25.3 (33.2)
Depreciation 10.1 9.8 3.5 9.8 3.4 37.2 38.8 (3.9)
Other income 14.8 5.9 152.3 5.4 173.8 24.1 23.8 1.2
PBT (excl. extr. items) 41.6 31.7 31.2 58.1 (28.4) 165.2 57.8 185.7
Extr. income/(expense) (12.1) (3.6) (22.2) (76.0) (87.9)
PBT (incl. extr. items) 29.5 28.1 5.0 35.9 (17.7) 89.2 (30.1) -
(% of sales) 6.0 5.7 8.9 5.5 (2.2)
Provision for taxation 10.6 5.1 106.6 7.1 48.9 31.5 5.4 483.0
(% of PBT) 35.9 18.2 19.8 35.4 (18.0)
Reported PAT 18.9 23.0 (17.7) 28.8 (34.2) 57.6 (35.5) -
PATM 3.9 4.7 7.1 3.6 (2.6)
Equity shares (cr) 15.3 15.3 15.3 15.3 15.3
EPS (`) 1.2 1.5 (17.7) 1.9 (34.2) 3.8 (2.3) -
Adjusted PAT 31.0 26.6 16.6 51.0 (39.2) 133.7 52.4 155.0
Source: Company, Angel Research
Segment-wise performance
During the quarter, the electrical cables segment showed strong growth of
38.8% yoy to `345cr (`249cr). The company witnessed robust volume growth of
23.0% in the segment, while realisations increased by ~12.8%. The segment
reported EBIT of `45.5cr, implying EBIT margin of 13.2%. Margin for the segment
improved by 96bp sequentially, but fell 818bp yoy. Notably, in the corresponding
period last year, the company had the benefit of low raw-material cost.
The communication cables segment reported a 13.0% yoy decline in sales to `46cr
(`53cr). Sales declined despite a 17.0% increase in volumes. EBIT margin for the
segment declined by 314bp yoy to 17.4%. However, sequentially, EBIT margin
improved by 926bp.
The copper rods segment’s sales increased to `315cr (`248cr), an increase of
27.1% yoy. However, the company had to absorb sales tax outgo of `4.2cr due to
timing difference in implementation of the Sales Tax Exemption Scheme in the
segment, which adversely affected the company’s performance. Consequently, the
segment registered EBIT of (`6cr), reporting an EBIT margin of (2.0%).
The others segment reported 374.4% increase in sales to `49cr (`10cr). However,
the segment registered a loss of `0.8cr in 2QFY2011, vis-à-vis a loss of `1.1cr in
2QFY2010.
3. Finolex Cables | 2QFY2011 Result Update
October 25, 2010 3
Exhibit 2: Segment-wise performance
Y/E March (` cr) 2QFY2011 1QFY2011 2QFY2010 % chg (qoq) % chg (yoy)
Total revenue
A) Electrical cables 345.4 296.4 248.9 16.5 38.8
B) Comm. cables 46.2 42.7 53.1 8.1 (13.0)
C) Copper rods 314.8 338.7 247.8 (7.1) 27.1
D) Others 49.2 55.7 10.4 (11.7) 374.4
Total 755.6 733.6 560.2 3.0 34.9
Less: Inter-segment rev. 265.0 240.5 155.4 10.2 70.6
Net sales 490.6 493.1 404.8 (0.5) 21.2
EBIT margin (%)
A) Electrical cables 13.2 12.2 21.4 96bp (818bp)
B) Comm. cables 17.4 8.1 20.5 926bp (314bp)
C) Copper rods (2.0) 1.1 2.4 (309bp) (443bp)
D) Others (1.5) 1.2 (10.7) (271bp) 916bp
Source: Company, Angel Research
Sales growth remains strong on the back of strong volumes
Finolex has registered strong sales growth over the past eight quarters, increasing
from `238cr in 3QFY2009 to `491cr in 2QFY2011. This has come on the back of
strong volume growth. Going forward, we expect the trend to continue, with robust
demand expected from the user industries, besides contribution from the HT plant
kicking in.
Exhibit 3: Sales trend
Source: Company, Angel Research
238
327 328
405 422
464
493 491
(40.0)
(20.0)
0.0
20.0
40.0
60.0
80.0
100.0
0
100
200
300
400
500
600
3QFY09
4QFY09
1QFY10
2QFY10
3QFY10
4QFY10
1QFY11
2QFY11
(%)
(`cr)
Sales (LHS) yoy Growth (RHS)
4. Finolex Cables | 2QFY2011 Result Update
October 25, 2010 4
Margins under pressure, but stabilising
After the crisis in FY2009, the company’s OPM expanded from (0.5%) to 16.5% in
2QFY2010, primarily on the back of low raw-material prices. However, since then,
margins fell to 7.1% in 4QFY2010, as the company could not pass on the rapid
increase in raw-material prices. Post that, margins have steadily increased.
In 2QFY2011, margins expanded to 8.5%. Going ahead, we expect margins to
expand further and the company to post OPM of 9.3% in FY2011E and
9.9% in FY2012E.
Exhibit 4: Margins trend
Source: Company, Angel Research
PAT set to increase going ahead
The company’s PAT has remained erratic over the past few quarters due to
fluctuating OPM and forex losses. However, going ahead, as forex losses decline
and OPM stabilises, we expect PAT to increase from current levels.
Exhibit 5: Profit trend
Source: Company, Angel Research
(2.0)
0.0
2.0
4.0
6.0
8.0
10.0
12.0
14.0
16.0
18.0
(10)
-
10
20
30
40
50
60
70
80
3QFY09
4QFY09
1QFY10
2QFY10
3QFY10
4QFY10
1QFY11
2QFY11
(%)
(`cr)
EBITDA (LHS) OPM (RHS)
(47)
3
22
29
12
(5)
23
19
(60)
(50)
(40)
(30)
(20)
(10)
0
10
20
30
40
3QFY09
4QFY09
1QFY10
2QFY10
3QFY10
4QFY10
1QFY11
2QFY11
(`cr)
5. Finolex Cables | 2QFY2011 Result Update
October 25, 2010 5
Management call – Key takeaways
Sales growth of 38.8% in the electrical cables segment was backed by strong
demand from the housing and auto segments and high copper prices.
Capacity utilisation continued to remain high in the Roorkee plant at 80–85%,
whereas plants in Pune and Goa are operating at over 70% utilisation levels.
The progress at the EHV cables plant is satisfactory and the plant is expected
to be ready for production by the end of FY2011.
There was a delay in the announcement of the Sales Tax Exemption Scheme,
during which Finolex continued to sell copper rods at lower rates to customers,
thereby making losses in the sale of copper rods. Consequently, the company
had to absorb `4.2cr.
Investment arguments
Poised for high growth going ahead: Finolex is poised to register robust growth
over the next few years, owing to strong growth in the existing LT cables segment
and entry into the HT and EHV cables verticals. In the LT cables vertical, we expect
the organised players to gradually gain market share as their distribution reach
expands and customers increasingly demand higher quality and branded wires.
Entry into the HT cables segment gives accessibility to the generation and
distribution segment, where the market opportunity is estimated at `37,000cr over
the next 10 years.
Tax benefits from Roorkee plant to help in turnaround of the company: The
company has shifted a major chunk of production to its Roorkee plant, which
avails excise duty and income tax benefits. Owing to this, we expect excise duty
and tax rates for the company to remain low at 9% and 22.0%, respectively, in
FY2012E. The company has further increased capacity of this plant by 50%. The
proximity to the growing north Indian markets and tax benefits availed by this plant
are expected to boost the turnaround of the company.
Major capex already undertaken: Finolex has already incurred the major capex
required to register growth over the next four-five years. Thus, on account of high
operating leverage and strong sales growth, we expect the company to increase its
net profit to `139cr in FY2012E from `58cr in FY2010.
Outlook and valuation
We maintain our positive outlook on Finolex, given its strong growth prospects, as
demand from user industries strengthens. We expect sales to increase at a 23.2%
CAGR over FY2010–12E. We expect OPM to increase from the current levels of
8.5%, as strong underlying demand enables the company to pass on the
raw-material price increase. However, given that the company has posted
lower-than-expected OPM in the first two quarters of FY2011, we have revised our
OPM estimates downwards for FY2011E and FY2012E to 9.3% and 9.9% from
10.0% and 10.2% currently. Consequently, our PAT estimate for FY2011E has
been reduced to `80cr (`90cr) and that for FY2012E has been reduced to `139cr
(`143cr). At current levels, the stock is trading at 11.7x and 6.8x its FY2011E and
FY2012E P/E, respectively. We maintain Buy on Finolex with a revised Target Price
of `82 (`85).
6. Finolex Cables | 2QFY2011 Result Update
October 25, 2010 6
Exhibit 6: Revised estimates
` cr Old New % chg
FY2011E FY2012E FY2011E FY2012E FY2011E FY2012E
Sales 2,048 2,458 2,048 2,458 - -
EBITDA 206 250 190 243 (7.6) (3.0)
EBITDA % 10.0 10.2 9.3 9.9
PAT 90 143 80 139 (10.7) (2.9)
EPS 5.9 9.3 5.3 9.1 (10.0) (2.5)
Source: Angel Research
Exhibit 7: Key assumptions
FY2011E FY2012E Remarks
Electrical cables contribution to sales 66.6 68.6 Higher contribution owing to HT cables sales
Communication cables contribution to sales 8.6 7.7 Decline mainly on account of lacklustre demand in JFTC
Copper rods contribution to sales 19.8 18.2 Sales to be driven by improvement in the economy
Others contribution to sales 4.9 5.5 CFL and switches to lead sales
OPM (%) 9.3 9.9 OPM to remain under pressure owing to high copper prices
Tax rate (%) 20.0 22.0 Higher production in Pune plant to result in higher tax
Source: Angel Research
Exhibit 8: Peer valuations
Company Mcap (` cr) CMP(`) EPS (`) P/E (x) P/BV (x) RoE (%)
FY11E FY12E FY11E FY12E FY11E FY12E FY11E FY12E
Finolex Cables 943 62 5.3 9.1 11.7 6.8 1.3 1.2 12.0 18.3
Sterlite Technologies 2,899 81 7.4 8.9 11.0 9.1 2.6 2.1 25.6 24.2
Source: Company, Bloomberg, Angel Research
Exhibit 9: One-year forward P/BV band
Source: Company, Bloomberg, Angel Research
0
20
40
60
80
100
120
140
Mar-02
Aug-02
Jan-03
Jun-03
Nov-03
Apr-04
Sep-04
Feb-05
Jul-05
Dec-05
May-06
Oct-06
Mar-07
Aug-07
Jan-08
Jun-08
Nov-08
Apr-09
Sep-09
Feb-10
Jul-10
SharePrice(`)
Price 0.5x 1.0x 1.5x 2.0x 2.5x
11. Finolex Cables | 2QFY2011 Result Update
October 25, 2010 11
Research Team Tel: 022 - 4040 3800 E-mail: research@angeltrade.com Website: www.angeltrade.com
DISCLAIMER
This document is solely for the personal information of the recipient, and must not be singularly used as the basis of any investment
decision. Nothing in this document should be construed as investment or financial advice. Each recipient of this document should make
such investigations as they deem necessary to arrive at an independent evaluation of an investment in the securities of the companies
referred to in this document (including the merits and risks involved), and should consult their own advisors to determine the merits and
risks of such an investment.
Angel Broking Limited, its affiliates, directors, its proprietary trading and investment businesses may, from time to time, make
investment decisions that are inconsistent with or contradictory to the recommendations expressed herein. The views contained in this
document are those of the analyst, and the company may or may not subscribe to all the views expressed within.
Reports based on technical and derivative analysis center on studying charts of a stock's price movement, outstanding positions and
trading volume, as opposed to focusing on a company's fundamentals and, as such, may not match with a report on a company's
fundamentals.
The information in this document has been printed on the basis of publicly available information, internal data and other reliable
sources believed to be true, but we do not represent that it is accurate or complete and it should not be relied on as such, as this
document is for general guidance only. Angel Broking Limited or any of its affiliates/ group companies shall not be in any way
responsible for any loss or damage that may arise to any person from any inadvertent error in the information contained in this report.
Angel Broking Limited has not independently verified all the information contained within this document. Accordingly, we cannot testify,
nor make any representation or warranty, express or implied, to the accuracy, contents or data contained within this document. While
Angel Broking Limited endeavours to update on a reasonable basis the information discussed in this material, there may be regulatory,
compliance, or other reasons that prevent us from doing so.
This document is being supplied to you solely for your information, and its contents, information or data may not be reproduced,
redistributed or passed on, directly or indirectly.
Angel Broking Limited and its affiliates may seek to provide or have engaged in providing corporate finance, investment banking or
other advisory services in a merger or specific transaction to the companies referred to in this report, as on the date of this report or in
the past.
Neither Angel Broking Limited, nor its directors, employees or affiliates shall be liable for any loss or damage that may arise from or in
connection with the use of this information.
Note: Please refer to the important `Stock Holding Disclosure' report on the Angel website (Research Section). Also, please
refer to the latest update on respective stocks for the disclosure status in respect of those stocks. Angel Broking Limited and
its affiliates may have investment positions in the stocks recommended in this report.
Disclosure of Interest Statement Finolex Cables
1. Analyst ownership of the stock Yes
2. Angel and its Group companies ownership of the stock No
3. Angel and its Group companies' Directors ownership of the stock Yes
4. Broking relationship with company covered No
Note: We have not considered any Exposure below ` 1 lakh for Angel, its Group companies and Directors.
Ratings (Returns): Buy (> 15%) Accumulate (5% to 15%) Neutral (-5 to 5%)
Reduce (-5% to 15%) Sell (< -15%)