1. Please refer to important disclosures at the end of this report 1
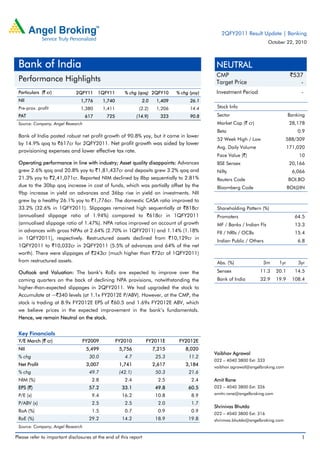
Particulars (` cr) 2QFY11 1QFY11 % chg (qoq) 2QFY10 % chg (yoy)
NII 1,776 1,740 2.0 1,409 26.1
Pre-prov. profit 1,380 1,411 (2.2) 1,206 14.4
PAT 617 725 (14.9) 323 90.8
Source: Company, Angel Research
Bank of India posted robust net profit growth of 90.8% yoy, but it came in lower
by 14.9% qoq to `617cr for 2QFY2011. Net profit growth was aided by lower
provisioning expenses and lower effective tax rate.
Operating performance in line with industry; Asset quality disappoints: Advances
grew 2.6% qoq and 20.8% yoy to `1,81,437cr and deposits grew 3.2% qoq and
21.3% yoy to `2,41,071cr. Reported NIM declined by 8bp sequentially to 2.81%
due to the 30bp qoq increase in cost of funds, which was partially offset by the
9bp increase in yield on advances and 36bp rise in yield on investments. NII
grew by a healthy 26.1% yoy to `1,776cr. The domestic CASA ratio improved to
33.2% (32.6% in 1QFY2011). Slippages remained high sequentially at `818cr
(annualised slippage ratio of 1.94%) compared to `618cr in 1QFY2011
(annualised slippage ratio of 1.47%). NPA ratios improved on account of growth
in advances with gross NPAs at 2.64% (2.70% in 1QFY2011) and 1.14% (1.18%
in 1QFY2011), respectively. Restructured assets declined from `10,129cr in
1QFY2011 to `10,032cr in 2QFY2011 (5.5% of advances and 64% of the net
worth). There were slippages of `243cr (much higher than `72cr of 1QFY2011)
from restructured assets.
Outlook and Valuation: The bank’s RoEs are expected to improve over the
coming quarters on the back of declining NPA provisions, notwithstanding the
higher-than-expected slippages in 2QFY2011. We had upgraded the stock to
Accumulate at ~`340 levels (at 1.1x FY2012E P/ABV). However, at the CMP, the
stock is trading at 8.9x FY2012E EPS of `60.5 and 1.69x FY2012E ABV, which
we believe prices in the expected improvement in the bank’s fundamentals.
Hence, we remain Neutral on the stock.
Key Financials
Y/E March (` cr) FY2009 FY2010 FY2011E FY2012E
NII 5,499 5,756 7,215 8,020
% chg 30.0 4.7 25.3 11.2
Net Profit 3,007 1,741 2,617 3,184
% chg 49.7 (42.1) 50.3 21.6
NIM (%) 2.8 2.4 2.5 2.4
EPS (`) 57.2 33.1 49.8 60.5
P/E (x) 9.4 16.2 10.8 8.9
P/ABV (x) 2.5 2.5 2.0 1.7
RoA (%) 1.5 0.7 0.9 0.9
RoE (%) 29.2 14.2 18.9 19.8
Source: Company, Angel Research
NEUTRAL
CMP `537
Target Price -
Investment Period -
Stock Info
Sector Banking
Market Cap (` cr) 28,178
Beta 0.9
52 Week High / Low 588/309
Avg. Daily Volume 171,020
Face Value (`) 10
BSE Sensex 20,166
Nifty 6,066
Reuters Code BOI.BO
Bloomberg Code BOI@IN
Shareholding Pattern (%)
Promoters 64.5
MF / Banks / Indian Fls 13.3
FII / NRIs / OCBs 15.4
Indian Public / Others 6.8
Abs. (%) 3m 1yr 3yr
Sensex 11.3 20.1 14.5
Bank of India 32.9 19.9 108.4
Vaibhav Agrawal
022 – 4040 3800 Ext: 333
vaibhav.agrawal@angelbroking.com
Amit Rane
022 – 4040 3800 Ext: 326
amitn.rane@angelbroking.com
Shrinivas Bhutda
022 – 4040 3800 Ext: 316
shrinivas.bhutda@angelbroking.com
2QFY2011 Result Update | Banking
October 22, 2010
Bank of India
Performance Highlights
2. Bank of India | 2QFY2011 Result Update
October 22, 2010 2
Exhibit 1: 2QFY2011 performance
Particulars (` cr) 2QFY11 1QFY11 % chg (qoq) 2QFY10 % chg (yoy)
Interest earned 5,156 4,822 6.9 4,489 14.8
Interest expenses 3,380 3,081 9.7 3,080 9.7
NII 1,776 1,740 2.0 1,409 26.1
Non-interest income 585 586 (0.2) 676 (13.5)
Operating income 2,361 2,326 1.5 2,085 13.2
Operating expenses 981 916 7.1 879 11.6
Pre-prov. profit 1,380 1,411 (2.2) 1,206 14.4
Provisions & cont. 527 386 36.7 602 (12.4)
PBT 852 1,025 (16.8) 604 41.1
Prov. for taxes 235 300 (21.4) 280 (16.1)
PAT 617 725 (14.9) 323 90.8
EPS (`) 11.7 13.8 (14.9) 6.1 90.8
Cost-to-income ratio (%) 41.6 39.4 42.2
Effective tax rate (%) 27.6 29.2 46.5
Net NPA (%) 1.1 1.2 1.1
Source: Company, Angel Research
Exhibit 2: 2QFY2011 Actual v/s Angel estimates
Particulars (` cr) Actual Estimates Var. (%)
NII 1,776 1,820 (2.4)
Non-interest income 585 502 16.5
Operating income 2,361 2,321 1.7
Operating expenses 981 949 3.3
Pre-prov. profit 1,380 1,372 0.5
Provisions & cont. 527 422 25.1
PBT 852 951 (10.3)
Prov. for taxes 235 315 (25.4)
PAT 617 635 (2.9)
Source: Company, Angel Research
3. Bank of India | 2QFY2011 Result Update
October 22, 2010 3
Advances growth in line with industry; deposits growth higher
For 2QFY2011, the bank’s net advances grew 2.6% qoq and 20.8% yoy to
`1,81,437cr and deposits grew 3.2% qoq and 21.3% yoy to `2,41,071cr. The
domestic gross advances grew 3.8% qoq and 22.3% yoy to `1,44,661cr and the
overseas gross loan book registered growth of 5.9% qoq and 24.1% yoy to
`39,681cr.
Demand for domestic loans was primarily driven by the corporates (up 44.4% yoy).
Agricultural advances were up 17.4% yoy, while the SME segment registered a
decline of 6.8% yoy. Growth in retail advances was sluggish both sequentially and
on yoy basis. Management is expecting strong traction in infrastructure lending
(sanction of `13,000cr) especially power and roads segments, going ahead.
Considering moderate overall growth so far, we have reduced our credit growth
estimates for FY2011 from 20.0% to 18.0%.
Exhibit 3: Trend in advances and deposits
Source: Company, Angel Research
Exhibit 4: Corporate domestic lending showing strong traction
Particulars (` cr) 2QFY11 1QFY11 % chg (qoq) 2QFY10 % chg (yoy)
Agricultural 19,302 17,782 8.5 16,439 17.4
SME 27,253 31,100 (12.4) 29,232 (6.8)
Corporates 82,779 75,024 10.3 57,310 44.4
Retail 15,327 15,453 (0.8) 15,272 0.4
- Housing 7,449 7,985 (6.7) 6,894 8.1
- Business Mortgage 1,577 1,659 (4.9) 2,065 (23.6)
- Auto 1,295 1,257 3.0 1,020 27.0
- Education 5,006 4,552 10.0 5,293 (5.4)
Total domestic advances 144,661 139,359 3.8 118,253 22.3
Source: Company, Angel Research
8.3
5.2
5.3
6.3
2.1 1.6
4.5
7.4
4.9
2.6
6.1
3.1
4.6
10.5
2.8
1.9
3.7
11.5
1.7
3.2
-
2.0
4.0
6.0
8.0
10.0
12.0
14.0
100,000
140,000
180,000
220,000
260,000
1QFY09
2QFY09
3QFY09
4QFY09
1QFY10
2QFY10
3QFY10
4QFY10
1QFY11
2QFY11
Advances (` cr) Deposits (` cr)
Advances qoq growth (%, RHS) Deposits qoq growth (%, RHS)
4. Bank of India | 2QFY2011 Result Update
October 22, 2010 4
Exhibit 5: Corporates continue their dominance in domestic advances
Source: Company, Angel Research
NIMs decline sequentially in spite of ~90bp increase in CASA
The domestic CASA ratio improved to 33.2% (from 32.3% in 1QFY2011). CASA
deposits increased by a healthy 29.0% yoy, driven by yoy growth of 27.1% and
29.5% in current and savings deposits, respectively. The global reported NIM
declined by 8bp sequentially to 2.81% in 2QFY2011, due to the 30bp qoq
increase in cost of funds, which was partially offset by the 9bp increase in yield on
advances and the 36bp rise in yield on investments. Consequently, NII came in
slightly lower than our estimates, registering a 26.1% yoy and 2.0% qoq growth to
`1,776cr.
For 3QFY2011, management expects to sustain NIM in the range of 2.90-2.95%
on the back of focus on mid-corporate, SME and retail segments.
Exhibit 6: Trend in spreads – Global
Particulars (%) 2QFY10 3QFY10 4QFY10 1QFY11 2QFY11
Cost of deposits 5.59 5.26 4.79 4.79 4.99
Yield on advances 8.97 8.41 8.12 8.38 8.47
Yield on investments 7.14 7.36 6.98 6.90 7.26
Yield on funds 7.66 7.35 6.90 6.96 7.25
Cost of funds 5.26 4.90 4.53 4.45 4.75
Reported NIM 2.57 2.60 2.57 2.89 2.81
Source: Company, Angel Research
Agri
14%
SME
19%
Corporates
57%
Housing
5%
Business
Mortgage
1%
Auto
1%
Education
1%
Others
2%Retail
11%
5. Bank of India | 2QFY2011 Result Update
October 22, 2010 5
Exhibit 7: Trend in spreads - Domestic
Source: Company, Angel Research
Non-interest income declines
CEB income recorded a decent growth of 21.4% yoy and 20.4% qoq. Recoveries
were down by 44.6% yoy to `30cr compared to `54cr in 2QFY2010. Total non-
interest income declined 13.5% yoy to `585cr due to lower treasury gains (down
48.0% yoy). However, non-interest income excluding treasury grew 11.5% yoy. We
expect total non-interest income to decline by 7.8% in FY2011E.
Exhibit 8: Break-up of non-interest income
Particulars (` cr) 2QFY11 1QFY11 % chg (qoq) 2QFY10 % chg (yoy)
CEB 301 250 20.4 248 21.4
Treasury 147 231 (36.3) 283 (48.0)
Recoveries 30 37 (18.4) 54 (44.6)
Others 107 68 55.8 91 16.9
Total 585 586 (0.2) 676 (13.5)
Source: Company, Angel Research
Exhibit 9: Trend in non-interest income mix
Source: Company, Angel Research
3.46 2.83 3.08 3.11 3.01 3.29 3.17
6.29 6.00 5.86
5.48
5.05 4.95
5.32
9.19
8.47 8.51 8.20
7.66 7.74 8.05
3.00
5.00
7.00
9.00
11.00
-
1.00
2.00
3.00
4.00
4QFY09
1QFY10
2QFY10
3QFY10
4QFY10
1QFY11
2QFY11
Reported NIM (%, LHS) Cost of Funds (%) Yield on Funds (%)
230 264 287 311 263 248 252 334 250 301
181 120
672
342
276 283 212
194
231 147
-
300
600
900
1,200
1QFY09
2QFY09
3QFY09
4QFY09
1QFY10
2QFY10
3QFY10
4QFY10
1QFY11
2QFY11
CEB Treasury Recoveries Others(` cr)
6. Bank of India | 2QFY2011 Result Update
October 22, 2010 6
Slippages higher than expected
Slippages remained high sequentially at `818cr (annualized slippage ratio of
1.94%) compared to `618cr in 1QFY2011 (annualized slippage ratio of 1.47%).
Textiles, Engineering and Chemicals sector were the major contributors to the
slippages. NPA ratios improved on account of growth in advances with gross NPAs
at 2.64% (2.7% in 1QFY2011) and 1.14% (1.18% in 1QFY2011), respectively. The
provision coverage ratio including technical write-offs improved to 70.0% from
68.3% in 1QFY2011.
Restructured assets declined from `10,129cr in 1QFY2011 to `10,032cr in
2QFY2011 (5.5% of advances and 64% of the net worth). There were slippages of
`243cr (much higher than `72cr of 1QFY2011) from restructured assets. The
cumulative slippages from restructured advances increased to `1,866cr (18.6% of
the restructured advances).
Exhibit 10: Trend in asset quality
Source: Company, Angel Research, Note: NPA coverage excluding write-offs till 4QFY2009
Operating costs under control; provisions rise
Total operating expenses increased 7.1% qoq and 11.6% yoy to `981cr. The cost-
to-income ratio stood at 41.6%, above the bank’s eight-quarter average of 40.3%.
Till date, the bank has made excess provision of ~`170cr in employee costs, which
is expected to provide a cushion against future liabilities.
69 69 68
75
67
59
70
66
68 70
35
50
65
80
-
1,500
3,000
4,500
6,000
1QFY09
2QFY09
3QFY09
4QFY09
1QFY10
2QFY10
3QFY10
4QFY10
1QFY11
2QFY11
Gross NPAs (` cr) Net NPAs (` cr) Coverage ratio (%, RHS)
7. Bank of India | 2QFY2011 Result Update
October 22, 2010 7
Exhibit 11: Trend in opex
Source: Company, Angel Research
During the quarter, provisioning expenses were up by 36.7% sequentially, on
account of floating provisions of `158cr for meeting the mandated norm of 70%
provision coverage for NPAs.
Exhibit 12: Break-up of provisioning expenses
Particulars (` cr) 2QFY11 1QFY11 % chg (qoq) 2QFY10 % chg (yoy)
NPA 286 308 (7.0) 470 (39.1)
Investment related 63 1 - 134 (53.2)
Others 178 78 129.8 (2) -
527 386 36.7 602 (12.4)
Source: Company, Angel Research
Sufficient capital adequacy
The bank is well capitalised with a CAR of 13.0% and tier-I capital of 8.4%
(forming 64.6% of the total CAR). With the Government of India holding at 64.5%,
the bank has adequate headroom to raise additional tier-I capital.
Exhibit 13: Comfortable capital adequacy
Source: Company, Angel Research
460
482
518
478
533
545
619
599
574
603
215
316
293
333
320
334
317
401
342
378
38.6 39.6
31.5
36.5
43.8 42.2
45.3 43.9
39.4
41.6
-
10.0
20.0
30.0
40.0
50.0
-
200
400
600
800
1,000
1,200
1QFY09
2QFY09
3QFY09
4QFY09
1QFY10
2QFY10
3QFY10
4QFY10
1QFY11
2QFY11
Staff expenses (` cr) Other opex (` cr) Cost-to-income ratio (%, RHS)
8.9 9.2 9.2 9.4 8.5 8.5 8.4
4.1 4.1 4.4 4.3
4.5 4.8 4.7
0.0
3.0
6.0
9.0
12.0
15.0
4QFY09
1QFY10
2QFY10
3QFY10
4QFY10
1QFY11
2QFY11
Tier-I CAR (%) Tier-II CAR (%)
8. Bank of India | 2QFY2011 Result Update
October 22, 2010 8
Investment Arguments
Lower provisions to drive RoE
During the 2008 global meltdown, the bank faced severe asset quality pressure
and reported a slippage rate of 2.9% in FY2010 (from 1.8% in FY2009.) As a
result, the NPA provision/assets increased to 0.7% in FY2010 from 0.3% in
FY2009 in turn exerting pressure on the bank’s RoE. However, as observed in the
1QFY2011 results, the bank has overcome the worst in terms of asset quality.
Further, with an improvement in the operating environment, we expect the NPA
provision/assets to decline sharply to 0.4% by FY2012, leading to RoE of 19.8% by
FY2012 from 14.2% in FY2010.
Efficient capital management aiding RoE outlook
The bank’s CAR is at a comfortable 13.3%, with 8.5% tier-1 component reinforced
by strong internal generation that leaves comfortable headroom for tier-II sources.
The bank’s leverage is amongst the highest within peers, aided by relatively higher
use of tier-1 bonds and revaluation reserves. With the government holding at 64%,
the bank is not facing pronounced near-term constraints on the equity front.
Reasonably high fee income with moderate funding mix
The international operations contribute a substantial 21.2% to the bank’s
advances. The international operations enable a wider spectrum of fee-based
services to its domestic corporate and retail customers, foreign currency
fund-based services to the Indian corporates and savings products to its PIO clients
abroad. The bank has a CASA relatively better funding mix with domestic CASA
ratio at 33.2% as of 2QFY2011.
Outlook and Valuation
The bank’s RoEs are expected to improve over the coming quarters on the back of
declining NPA provisions, notwithstanding the higher-than-expected slippages in
2QFY2011. We had upgraded the stock to Accumulate at ~`340 levels (at 1.1x
FY2012E P/ABV). However, at the CMP, the stock is trading at 8.9x FY2012E EPS
of `60.5 and 1.69x FY2012E ABV, which we believe prices in the expected
improvement in the bank’s fundamentals. Hence, we remain Neutral on the stock.
13. Bank of India | 2QFY2011 Result Update
October 22, 2010 13
Research Team Tel: 022 - 4040 3800 E-mail: research@angeltrade.com Website: www.angeltrade.com
DISCLAIMER
This document is solely for the personal information of the recipient, and must not be singularly used as the basis of any investment
decision. Nothing in this document should be construed as investment or financial advice. Each recipient of this document should make
such investigations as they deem necessary to arrive at an independent evaluation of an investment in the securities of the companies
referred to in this document (including the merits and risks involved), and should consult their own advisors to determine the merits and
risks of such an investment.
Angel Broking Limited, its affiliates, directors, its proprietary trading and investment businesses may, from time to time, make
investment decisions that are inconsistent with or contradictory to the recommendations expressed herein. The views contained in this
document are those of the analyst, and the company may or may not subscribe to all the views expressed within.
Reports based on technical and derivative analysis center on studying charts of a stock's price movement, outstanding positions and
trading volume, as opposed to focusing on a company's fundamentals and, as such, may not match with a report on a company's
fundamentals.
The information in this document has been printed on the basis of publicly available information, internal data and other reliable
sources believed to be true, but we do not represent that it is accurate or complete and it should not be relied on as such, as this
document is for general guidance only. Angel Broking Limited or any of its affiliates/ group companies shall not be in any way
responsible for any loss or damage that may arise to any person from any inadvertent error in the information contained in this report.
Angel Broking Limited has not independently verified all the information contained within this document. Accordingly, we cannot testify,
nor make any representation or warranty, express or implied, to the accuracy, contents or data contained within this document. While
Angel Broking Limited endeavours to update on a reasonable basis the information discussed in this material, there may be regulatory,
compliance, or other reasons that prevent us from doing so.
This document is being supplied to you solely for your information, and its contents, information or data may not be reproduced,
redistributed or passed on, directly or indirectly.
Angel Broking Limited and its affiliates may seek to provide or have engaged in providing corporate finance, investment banking or
other advisory services in a merger or specific transaction to the companies referred to in this report, as on the date of this report or in
the past.
Neither Angel Broking Limited, nor its directors, employees or affiliates shall be liable for any loss or damage that may arise from or in
connection with the use of this information.
Note: Please refer to the important `Stock Holding Disclosure' report on the Angel website (Research Section). Also, please
refer to the latest update on respective stocks for the disclosure status in respect of those stocks. Angel Broking Limited and
its affiliates may have investment positions in the stocks recommended in this report.
Disclosure of Interest Statement Bank of India
1. Analyst ownership of the stock No
2. Angel and its Group companies ownership of the stock No
3. Angel and its Group companies' Directors ownership of the stock No
4. Broking relationship with company covered No
Note: We have not considered any Exposure below ` 1 lakh for Angel, its Group companies and Directors.
Ratings (Returns): Buy (> 15%) Accumulate (5% to 15%) Neutral (-5 to 5%)
Reduce (-5% to 15%) Sell (< -15%)