VIP Call Girls in Saharanpur Aarohi 8250192130 Independent Escort Service Sah...
Hcc ru2 qfy2011-291010
1. Please refer to important disclosures at the end of this report 1
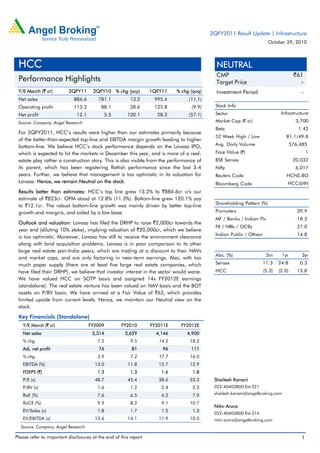
Y/E March (` cr) 2QFY11 2QFY10 % chg (yoy) 1QFY11 % chg (qoq)
Net sales 884.6 781.1 13.2 995.4 (11.1)
Operating profit 113.3 88.1 28.6 125.8 (9.9)
Net profit 12.1 5.5 120.1 28.3 (57.1)
Source: Company, Angel Research
For 2QFY2011, HCC’s results were higher than our estimates primarily because
of the better-than-expected top-line and EBITDA margin growth leading to higher
bottom-line. We believe HCC’s stock performance depends on the Lavasa IPO,
which is expected to hit the markets in December this year, and is more of a real-
estate play rather a construction story. This is also visible from the performance of
its parent, which has been registering flattish performance since the last 3-4
years. Further, we believe that management is too optimistic in its valuation for
Lavasa. Hence, we remain Neutral on the stock.
Results better than estimates: HCC’s top line grew 13.2% to `884.6cr v/s our
estimate of `823cr. OPM stood at 12.8% (11.3%). Bottom-line grew 120.1% yoy
to `12.1cr. The robust bottom-line growth was mainly driven by better top-line
growth and margins, and aided by a low base.
Outlook and valuation: Lavasa has filed the DRHP to raise `2,000cr towards the
year end (diluting 10% stake), implying valuation of `20,000cr, which we believe
is too optimistic. Moreover, Lavasa has still to receive the environment clearance
along with land acquisition problems. Lavasa is in poor comparison to its other
large real estate pan-India peers, which are trading at a discount to their NAVs
and market caps, and are only factoring in near-term earnings. Also, with too
much paper supply (there are at least five large real estate companies, which
have filed their DRHP), we believe that investor interest in the sector would wane.
We have valued HCC on SOTP basis and assigned 14x FY2012E earnings
(standalone). The real estate venture has been valued on NAV basis and the BOT
assets on P/BV basis. We have arrived at a Fair Value of `63, which provides
limited upside from current levels. Hence, we maintain our Neutral view on the
stock.
Key Financials (Standalone)
Y/E March (` cr) FY2009 FY2010 FY2011E FY2012E
Net sales 3,314 3,629 4,146 4,900
% chg 7.5 9.5 14.2 18.2
Adj. net profit 76 81 96 111
% chg 3.9 7.2 17.7 16.0
EBITDA (%) 13.0 11.8 12.7 12.9
FDEPS (`) 1.3 1.3 1.6 1.8
P/E (x) 48.7 45.4 38.6 33.3
P/BV (x) 1.6 1.2 2.4 2.3
RoE (%) 7.6 6.5 6.2 7.0
RoCE (%) 9.9 8.2 9.1 10.7
EV/Sales (x) 1.8 1.7 1.5 1.3
EV/EBITDA (x) 13.6 14.1 11.9 10.5
Source: Company, Angel Research
NEUTRAL
CMP `61
Target Price -
Investment Period -
Stock Info
Sector
Bloomberg Code
Shareholding Pattern (%)
Promoters 39.9
MF / Banks / Indian Fls 18.3
FII / NRIs / OCBs 27.0
Indian Public / Others 14.8
Abs. (%) 3m 1yr 3yr
Sensex 11.3 24.8 0.3
HCC (5.3) (2.0) 13.8
1
20,032
6,017
HCNS.BO
HCC@IN
3,700
1.42
81.1/49.8
576,485
Infrastructure
Avg. Daily Volume
Market Cap (` cr)
Beta
52 Week High / Low
Face Value (`)
BSE Sensex
Nifty
Reuters Code
Shailesh Kanani
022-40403800 Ext:321
shailesh.kanani@angelbroking.com
Nitin Arora
022-40403800 Ext:314
nitin.arora@angelbroking.com
HCC
Performance Highlights
2QFY2011 Result Update | Infrastructure
October 29, 2010
2. HCC |2QFY2011 Result Update
October 29, 2010 2
Exhibit 1: 2QFY2011 performance (Standalone)
Y/E March (` cr) 2QFY11 2QFY10 % chg (yoy) 1QFY11 % chg (qoq) 1HFY11 1HFY10 % chg (yoy)
Income from Operations 884.6 781.1 13.2 995.4 (11.1) 1,880 1,657.1 13.4
Total Expenditure 771.3 693.0 11.3 869.6 (11.3) 1,641 1,443.7 13.7
Operating Profit 113.3 88.1 28.6 125.8 (9.9) 239.0 213.4 12.0
OPM (%) 12.8 11.3 150bp 12.6 20bp 12.7 12.9 (20)bp
Interest 67.1 49.9 34.4 57.7 16.2 125 111.2 12.2
Depreciation 35.9 31.5 13.9 34.7 3.4 71 61.6 14.6
Non Operating Income 6.1 2.8 116.5 3.1 98.1 9 4.7 95.2
Nonrecurring items - - - - - - (10.3) -
Profit Before tax 16.5 9.5 73.2 36.4 (54.8) 52.9 35.1 50.8
Tax 4.3 4.0 8.4 8.1 12 11.4 9.4
PAT 12.1 5.5 120.1 28.3 (57.1) 40.5 23.7 70.6
PAT (%) 1.4 0.7 70bp 2.8 (140)bp 2.2 1.4 80bp
FDEPS (`) 0.2 0.1 120.1 0.93 (78.5) 0.7 0.4 70.6
Source: Company, Angel Research
Exhibit 2: 2QFY2011 Actual v/s Angel estimates
Estimates Actual Variation (%)
Revenues (` cr) 823.0 884.6 7.5
EBITDA Margin (%) 12.1 12.8 70bp
PAT (` cr) 10.5 12.1 15.6
Source: Company, Angel Research
Top-line and bottom-line marginally higher than our estimates
HCC’s reported top-line yoy growth of 13.2% to `884.6cr marginally above our
estimate of `823cr. The lower revenue realisation was primarily due to the loss
incurred in the Delhi Metro project. We expect the company to post a better
performance in 2HFY2011 due to revenue inflow from the Delhi-Faridabad
expressway (expected to be operational from November 2010) and EPC revenues
from the NH-34 project, which has achieved financial closure.
Exhibit 3: Quarterly revenue trend
Source: Company, Angel Research
(10.0)
(5.0)
0.0
5.0
10.0
15.0
20.0
25.0
0
200
400
600
800
1,000
1,200
2QFY09
3QFY09
4QFY09
1QFY10
2QFY10
3QFY10
4QFY10
1QFY11
2QFY11
Sales (Rs cr, LHS) Growth (yoy %, RHS)
3. HCC |2QFY2011 Result Update
October 29, 2010 3
Operating margin improved 12.8% during the quarter as against our estimate of
12.1% mainly because of reduction in other expenses, as a percentage of sales.
Bottom-line surged 120.1% yoy to `12.1cr (`5.5) mainly driven by better top-line
growth and margins, and aided by a low base.
Exhibit 4: Quarterly EBITDA trend
Source: Company, Angel Research
Exhibit 5: Quarterly PAT trend
Source: Company, Angel Research
Order book analysis
HCC’s order book, as of 2QFY2011, stood at `17,795cr (4.8x FY2011E revenue)
(excluding the disputed order) with the company bagging orders worth `1,178cr
this quarter. The company’s order book comprises the hydro power (43%), water
solutions (20%), transportation (24%) and nuclear and special projects (13%). The
company is L1 for contracts worth `1,537cr. Going ahead, the company has given
guidance of adding `3,000-4,000cr of road BOT projects every year and also
indicated to enter the new segments of metal and mining, which should further
ramp up its order book.
Exhibit 6: Order booking and order book trend
Source: Company, Angel Research
Exhibit 7: Segmental order book break-up (%)
Source: Company, Angel Research
0.0
2.0
4.0
6.0
8.0
10.0
12.0
14.0
16.0
18.0
0.0
20.0
40.0
60.0
80.0
100.0
120.0
140.0
160.0
2QFY09
3QFY09
4QFY09
1QFY10
2QFY10
3QFY10
4QFY10
1QFY11
2QFY11
EBITDA (Rs cr, LHS) EBITDAM (%, RHS)
-
1.0
2.0
3.0
4.0
5.0
6.0
0.0
10.0
20.0
30.0
40.0
50.0
60.0
2QFY09
3QFY09
4QFY09
1QFY10
2QFY10
3QFY10
4QFY10
1QFY11
2QFY11
PAT (Rs cr, LHS) PATM (%, RHS)
12.2
34.5
42.4
32.1
26.3
13.0
16.7
29.2
30.8
0.0
10.0
20.0
30.0
40.0
50.0
0
5,000
10,000
15,000
20,000
2QFY09
3QFY09
4QFY09
1QFY10
2QFY10
3QFY10
4QFY10
1QFY11
2QFY11
Order Book (Rs cr, LHS) Order Inflow (Rs cr, LHS)
L1 Status (Rs cr, LHS) Order Book growth (%, RHS)
43
20
24
13
Hydro Power Water Soln. Transportation Nuclear and Sp.Projects
4. HCC |2QFY2011 Result Update
October 29, 2010 4
Outlook and Valuation
Lavasa has filed the DRHP to raise `2,000cr towards the year end (diluting 10%
stake), implying valuation of `20,000cr, which we believe is too optimistic.
Moreover, Lavasa has still to receive the environment clearance along with land
acquisition problems. Lavasa is in poor comparison to its other large real estate
pan-India peers, which are trading at a discount to their NAVs and market caps,
and are only factoring in near-term earnings. Also, with too much paper supply
(there are at least five large real estate companies, which have filed their DRHP),
we believe that investor interest in the sector would wane.
We have valued HCC on SOTP basis and assigned 14x FY2012E earnings
(standalone). The real estate venture has been valued on NAV basis and the BOT
assets on P/BV basis. We have arrived at a Fair Value of `63, which provides
limited upside from current levels. Hence, we maintain our Neutral view on the
stock.
Exhibit 8: SOTP valuation summary
Business Segment Methodology Remarks `/share
Construction P/E 14.0x FY2012E earnings 25.7
Value of Real Estate NAV Basis NAV Basis 29.3
Road BOT P/BV 1.5x P/BV 8.1
Total 63.1
Source: Company, Angel Research
Exhibit 9: Key assumptions
` cr FY2007 FY2008 FY2009 FY2010 FY2011E FY2012E
Order Inflow 1,998 3,929 7,616 7,979 11,402 10,114
Revenues 2,358 3,083 3,314 3,629 4,146 4,900
Order Backlog (Y/E) 9,312 10,158 14,460 18,810 26,066 31,279
Order Book to Sales ratio (x) 3.9 3.3 4.4 5.2 6.3 6.4
Source: Company, Angel Research
Exhibit 10: Angel EPS forecast v/s consensus
Angel Forecast Bloomberg Consensus Variation (%)
FY2011E 1.6 1.8 16.4
FY2012E 1.8 2.4 33.1
(
Source: Company, Angel Research
10. HCC |2QFY2011 Result Update
October 29, 2010 10
Research Team Tel: 022 - 4040 3800 E-mail: research@angeltrade.com Website: www.angeltrade.com
DISCLAIMER
This document is solely for the personal information of the recipient, and must not be singularly used as the basis of any investment
decision. Nothing in this document should be construed as investment or financial advice. Each recipient of this document should make
such investigations as they deem necessary to arrive at an independent evaluation of an investment in the securities of the companies
referred to in this document (including the merits and risks involved), and should consult their own advisors to determine the merits and
risks of such an investment.
Angel Broking Limited, its affiliates, directors, its proprietary trading and investment businesses may, from time to time, make
investment decisions that are inconsistent with or contradictory to the recommendations expressed herein. The views contained in this
document are those of the analyst, and the company may or may not subscribe to all the views expressed within.
Reports based on technical and derivative analysis center on studying charts of a stock's price movement, outstanding positions and
trading volume, as opposed to focusing on a company's fundamentals and, as such, may not match with a report on a company's
fundamentals.
The information in this document has been printed on the basis of publicly available information, internal data and other reliable
sources believed to be true, but we do not represent that it is accurate or complete and it should not be relied on as such, as this
document is for general guidance only. Angel Broking Limited or any of its affiliates/ group companies shall not be in any way
responsible for any loss or damage that may arise to any person from any inadvertent error in the information contained in this report.
Angel Broking Limited has not independently verified all the information contained within this document. Accordingly, we cannot testify,
nor make any representation or warranty, express or implied, to the accuracy, contents or data contained within this document. While
Angel Broking Limited endeavours to update on a reasonable basis the information discussed in this material, there may be regulatory,
compliance, or other reasons that prevent us from doing so.
This document is being supplied to you solely for your information, and its contents, information or data may not be reproduced,
redistributed or passed on, directly or indirectly.
Angel Broking Limited and its affiliates may seek to provide or have engaged in providing corporate finance, investment banking or
other advisory services in a merger or specific transaction to the companies referred to in this report, as on the date of this report or in
the past.
Neither Angel Broking Limited, nor its directors, employees or affiliates shall be liable for any loss or damage that may arise from or in
connection with the use of this information.
Note: Please refer to the important `Stock Holding Disclosure' report on the Angel website (Research Section). Also, please
refer to the latest update on respective stocks for the disclosure status in respect of those stocks. Angel Broking Limited and
its affiliates may have investment positions in the stocks recommended in this report.
Disclosure of Interest Statement HCC
1. Analyst ownership of the stock No
2. Angel and its Group companies ownership of the stock No
3. Angel and its Group companies' Directors ownership of the stock No
4. Broking relationship with company covered No
Note: We have not considered any Exposure below ` 1 lakh for Angel, its Group companies and Directors.
Ratings (Returns): Buy (> 15%) Accumulate (5% to 15%) Neutral (-5 to 5%)
Reduce (-5% to 15%) Sell (< -15%)