Downloaded 112 times

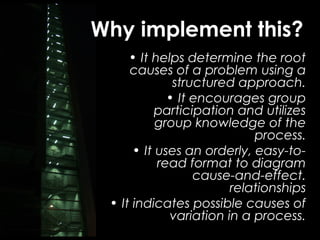

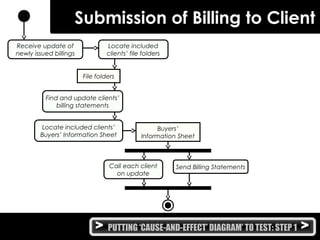
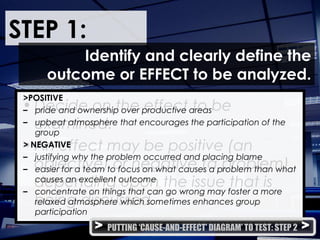
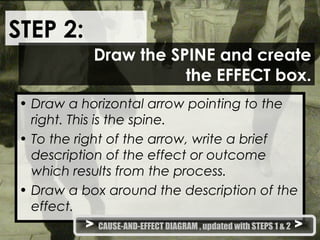
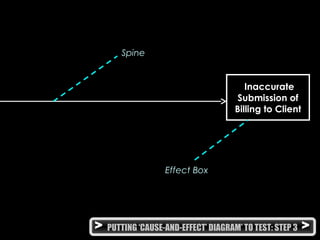
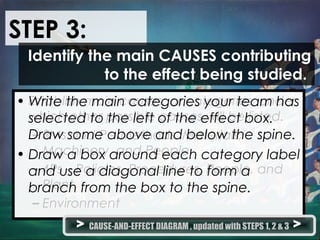
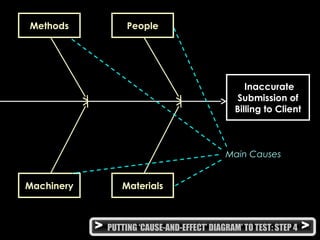
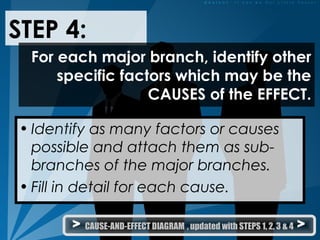
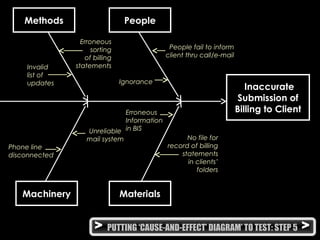
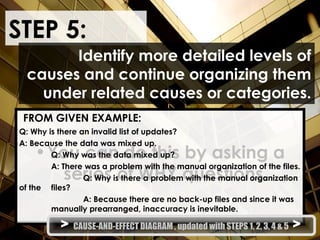
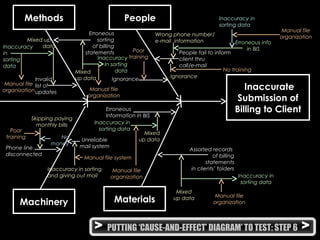

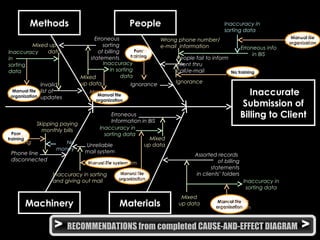


The document describes the steps to create a cause-and-effect diagram, also known as an Ishikawa or fishbone diagram, which is a visual tool for identifying potential causes of a particular effect or problem. It lists 6 steps: 1) define the effect, 2) draw the spine and effect box, 3) identify main cause categories, 4) identify specific causes, 5) drill down on causes, and 6) analyze the diagram. An example diagram shows potential causes for the inaccurate submission of billing to clients, with repeated causes like poor training and a manual filing system identified for corrective action.


![Qcl 14-v3 [cause-effect diagram]-[parinita dwivedi]_[banasthali university]](https://cdn.slidesharecdn.com/ss_thumbnails/qcl-14-v3cause-effectdiagramparinitadwivedibanasthaliuniversity-150117081348-conversion-gate02-thumbnail.jpg?width=640&height=640&fit=bounds)

![Qcl 14-v3 [cause-effect diagram]-[banasthali university]_[shreya gupta]](https://cdn.slidesharecdn.com/ss_thumbnails/qcl-14-v3cause-effectdiagrambanasthaliuniversityshreyagupta-150121060516-conversion-gate01-thumbnail.jpg?width=640&height=640&fit=bounds)


![Qcl 14-v3 [cause-effect-diagram]-[banasthali university]_[devanshi agarwal] (1)](https://cdn.slidesharecdn.com/ss_thumbnails/qcl-14-v3cause-effect-diagrambanasthaliuniversitydevanshiagarwal1-150115005645-conversion-gate02-thumbnail.jpg?width=640&height=640&fit=bounds)
![QCL- 14-v3 _[cause and effect diag]_[banasthali vidyapith]_[monikakumari]](https://cdn.slidesharecdn.com/ss_thumbnails/qcl-14-v3causeandeffectdiagbanasthaliunivmonikakumari-150119083542-conversion-gate02-thumbnail.jpg?width=640&height=640&fit=bounds)


