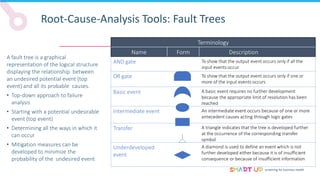
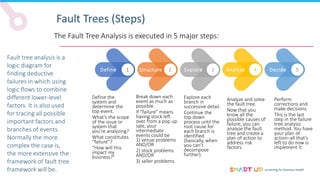
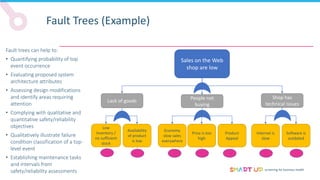
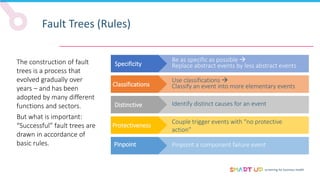
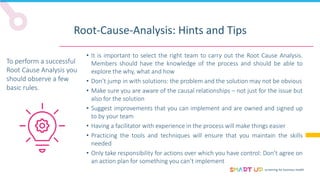
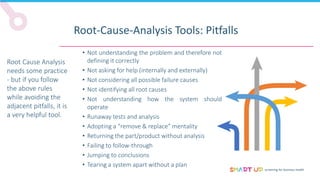
Root-cause analysis tools can help identify the underlying causes of problems. The document discusses several tools:
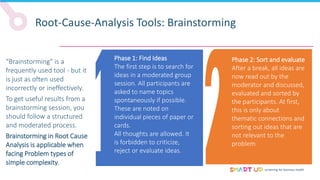
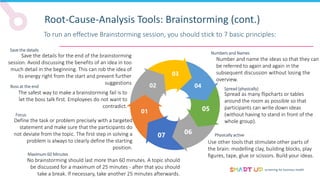
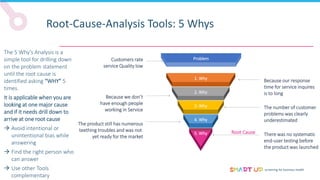
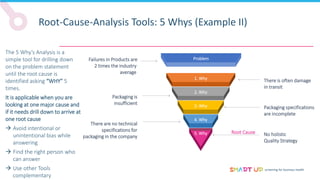
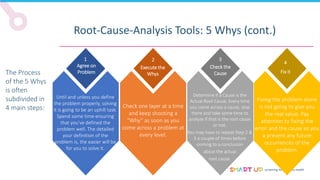
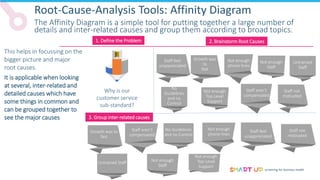
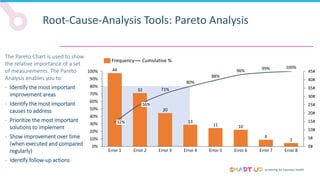
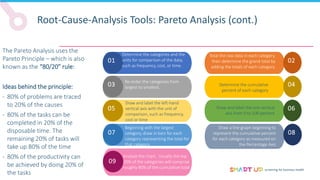
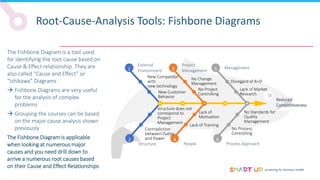
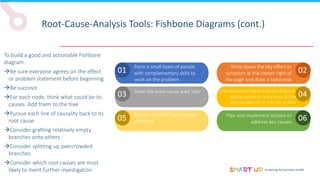
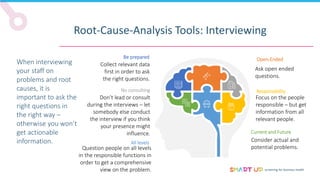
Brainstorming is used to generate ideas in a structured group session, following principles like forbidding criticism and limiting sessions to 60 minutes. The 5 Whys tool asks "why" five times to drill down through problems to their root causes. Affinity diagrams group interrelated causes into categories to identify major causes. Pareto charts identify the most important causes addressing 80% of the problem. Fishbone diagrams show the relationship between effects and multiple potential causes. Other tools covered include interviewing staff, fault trees, and general tips for effective root cause analysis.