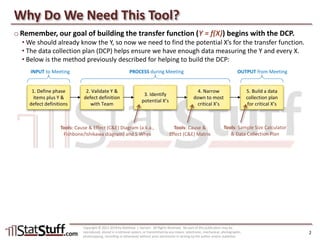
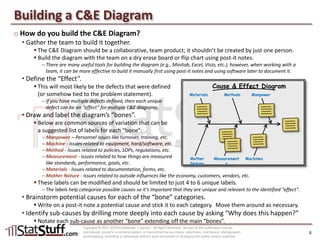
SlideShare a Scribd company logo
Section & Lesson #:
Pre-Requisite Lessons:
Complex Tools + Clear Teaching = Powerful Results
Identify Root Causes – C&E Diagram
Six Sigma-Measure – Lesson 23
An extension of the topic on identifying root causes using a cause & effect
(C&E) diagram that will lead toward building a data collection plan (DCP).
Six Sigma-Measure #22 – Identify Root Causes – DCP Overview
Copyright © 2011-2019 by Matthew J. Hansen. All Rights Reserved. No part of this publication may be reproduced, stored in a retrieval system, or transmitted by any means
(electronic, mechanical, photographic, photocopying, recording or otherwise) without prior permission in writing by the author and/or publisher.
Why Do We Need This Tool?
o Remember, our goal of building the transfer function (Y = f(X)) begins with the DCP.
• We should already know the Y, so now we need to find the potential X’s for the transfer function.
• The data collection plan (DCP) helps ensure we have enough data measuring the Y and every X.
• Below is the method previously described for helping to build the DCP:
Copyright © 2011-2019 by Matthew J. Hansen. All Rights Reserved. No part of this publication may be
reproduced, stored in a retrieval system, or transmitted by any means (electronic, mechanical, photographic,
photocopying, recording or otherwise) without prior permission in writing by the author and/or publisher.
2
1. Define phase
items plus Y &
defect definitions
2. Validate Y &
defect definition
with Team
3. Identify
potential X’s
4. Narrow
down to most
critical X’s
5. Build a data
collection plan
for critical X’s
INPUT to Meeting PROCESS during Meeting OUTPUT from Meeting
Tools: Cause & Effect (C&E) Diagram (a.k.a.,
Fishbone/Ishikawa diagram) and 5 Whys
Tools: Cause &
Effect (C&E) Matrix
Tools: Sample Size Calculator
& Data Collection Plan
C&E Diagram Defined
o What is a Cause & Effect (C&E) Diagram?
• It’s a collaborative tool (a.k.a., Fishbone diagram or Ishikawa diagram) used by a team to help
identify all possible causes for a particular undesirable effect.
o What is the purpose of a C&E Diagram?
• Helps a team focus on a problem’s content and not its history.
• Keeps the team focused on the problem’s causes instead of the symptoms.
• Uses a team’s collective knowledge to build a holistic view and create team consensus of all
possible causes affecting a problem.
o Below is an example of a C&E Diagram built in Minitab:
Copyright © 2011-2019 by Matthew J. Hansen. All Rights Reserved. No part of this publication may be
reproduced, stored in a retrieval system, or transmitted by any means (electronic, mechanical, photographic,
photocopying, recording or otherwise) without prior permission in writing by the author and/or publisher.
3
Customer
waits too
long before
talking to
agent
Materials
Mother Nature
Measurements
Methods
Machines
Manpower
Low Staffing Lev els
Slow sy stem
Processes require
putting customer on
hold to w rap up last
call
A gents aren't
measured on A v g
Speed to A nsw er
C all reasons change
throughout day
(longer calls)
C all v olume changes
throughout day
(affects staffing)
Cause-and-Effect Diagram
Building a C&E Diagram
o How do you build the C&E Diagram?
• Gather the team to build it together.
 The C&E Diagram should be a collaborative, team product; it shouldn’t be created by just one person.
 Build the diagram with the team on a dry erase board or flip chart using post-it notes.
– There are many useful tools for building the diagram (e.g., Minitab, Excel, Visio, etc.); however, when working with a
team, it can be more effective to build it manually first using post-it notes and using software later to document it.
• Define the “Effect”.
 This will most likely be the defects that were defined
(or somehow tied to the problem statement).
– If you have multiple defects defined, then each unique
defect can be an “effect” for multiple C&E diagrams.
• Draw and label the diagram’s “bones”.
 Below are common sources of variation that can be
a suggested list of labels for each “bone”:
– Manpower – Personnel issues like turnover, training, etc.
– Machine - Issues related to equipment, hard/software, etc.
– Method - Issues related to policies, SOPs, regulations, etc.
– Measurement - Issues related to how things are measured
like standards, performance, goals, etc.
– Materials - Issues related to documentation, forms, etc.
– Mother Nature - Issues related to outside influences like the economy, customers, vendors, etc.
 These labels can be modified and should be limited to just 4 to 6 unique labels.
– The labels help categorize possible causes so it’s important that they are unique and relevant to the identified “effect”.
• Brainstorm potential causes for each of the “bone” categories.
 Write on a post-it note a potential cause and stick it to each category. Move them around as necessary.
• Identify sub-causes by drilling more deeply into each cause by asking “Why does this happen?”
 Notate each sub-cause as another “bone” extending off the main “bones”.
Copyright © 2011-2019 by Matthew J. Hansen. All Rights Reserved. No part of this publication may be
reproduced, stored in a retrieval system, or transmitted by any means (electronic, mechanical, photographic,
photocopying, recording or otherwise) without prior permission in writing by the author and/or publisher.
4
Cause & Effect Diagram
Materials Methods Manpower
Mother
Nature
Measurement
s
Machines
Documenting a C&E Diagram
o How do you document the C&E Diagram?
• After the team manually builds the C&E diagram, it should be documented using various software
tools to make it easily accessible and to embed it into the project storyboard.
• Below are the instructions for building the diagram into Minitab:
 Begin by typing the identified causes into different columns in Minitab’s worksheet.
 In Minitab go to Stat > Quality Tools > Cause and Effect…
 Update the “Label” section to reflect the “bone” labels used in the diagram.
 For the “Causes”, assign the column title respective to the label you noted.
– If you have sub-causes, change the “In Column” drop-down to “Constant” to reflect the name of the new bone extension.
– Then click the “Sub…”button and assign the column title respective to the newly created label.
 Type in the “Effect”.
 Add a new title as needed,
otherwise Minitab will entitle it
“Cause and Effect Diagram”.
 The dialog example (at right) is
what was used to create the
previously shown C&E diagram.
Copyright © 2011-2019 by Matthew J. Hansen. All Rights Reserved. No part of this publication may be
reproduced, stored in a retrieval system, or transmitted by any means (electronic, mechanical, photographic,
photocopying, recording or otherwise) without prior permission in writing by the author and/or publisher.
5
Practical Application
o Identify a prior project or initiative you worked in your organization.
• Try building a C&E Diagram for that project or initiative by answering the following:
 What was used as the critical metric (project Y)?
 How would you define a defect?
– This would be the ultimate “effect” used in the C&E Diagram.
 Review each source of variation listed below and notate any related causes leading to the effect.
– Manpower
– Machine
– Method
– Measurement
– Materials
– Mother Nature
 Notate any additional sub-causes that also eventually lead to the ultimate effect.
• Try building the C&E Diagram in an online tool like Minitab, Visio, PowerPoint, etc.
Copyright © 2011-2019 by Matthew J. Hansen. All Rights Reserved. No part of this publication may be
reproduced, stored in a retrieval system, or transmitted by any means (electronic, mechanical, photographic,
photocopying, recording or otherwise) without prior permission in writing by the author and/or publisher.
6

More Related Content

What's hot

Identify Root Causes – C&E Matrix
Identify Root Causes – C&E MatrixIdentify Root Causes – C&E Matrix
Identify Root Causes – C&E Matrix
Matt Hansen
 
Defining the Project Y
Defining the Project YDefining the Project Y
Defining the Project Y
Matt Hansen
 
MSA – Planning & Conducting the MSA
MSA – Planning & Conducting the MSAMSA – Planning & Conducting the MSA
MSA – Planning & Conducting the MSA
Matt Hansen
 
MSA – Overview
MSA – OverviewMSA – Overview
MSA – Overview
Matt Hansen
 
Process Capability: Step 6 (Binomial)
Process Capability: Step 6 (Binomial)Process Capability: Step 6 (Binomial)
Process Capability: Step 6 (Binomial)
Matt Hansen
 
Variation Over Time (Short/Long Term Data)
Variation Over Time (Short/Long Term Data)Variation Over Time (Short/Long Term Data)
Variation Over Time (Short/Long Term Data)
Matt Hansen
 
Calculating a Sample Size
Calculating a Sample SizeCalculating a Sample Size
Calculating a Sample Size
Matt Hansen
 
Process Capability: Step 4 (Normal Distributions)
Process Capability: Step 4 (Normal Distributions)Process Capability: Step 4 (Normal Distributions)
Process Capability: Step 4 (Normal Distributions)
Matt Hansen
 
Analyze Phase Roadmap (Level 3)
Analyze Phase Roadmap (Level 3)Analyze Phase Roadmap (Level 3)
Analyze Phase Roadmap (Level 3)
Matt Hansen
 
Building a Scorecard
Building a ScorecardBuilding a Scorecard
Building a Scorecard
Matt Hansen
 
Rational Sub-Grouping
Rational Sub-GroupingRational Sub-Grouping
Rational Sub-Grouping
Matt Hansen
 
Measure Phase Roadmap (Level 3) with Matt Hansen at StatStuff
Measure Phase Roadmap (Level 3) with Matt Hansen at StatStuffMeasure Phase Roadmap (Level 3) with Matt Hansen at StatStuff
Measure Phase Roadmap (Level 3) with Matt Hansen at StatStuff
Matt Hansen
 
Process Capability: Step 5 (Non-Normal Distributions)
Process Capability: Step 5 (Non-Normal Distributions)Process Capability: Step 5 (Non-Normal Distributions)
Process Capability: Step 5 (Non-Normal Distributions)
Matt Hansen
 
Building a Process Map with Matt Hansen at StatStuff
Building a Process Map with Matt Hansen at StatStuffBuilding a Process Map with Matt Hansen at StatStuff
Building a Process Map with Matt Hansen at StatStuff
Matt Hansen
 
Descriptive Statistics
Descriptive StatisticsDescriptive Statistics
Descriptive Statistics
Matt Hansen
 
The Necessity of the Measure Phase with Matt Hansen at StatStuff
The Necessity of the Measure Phase with Matt Hansen at StatStuffThe Necessity of the Measure Phase with Matt Hansen at StatStuff
The Necessity of the Measure Phase with Matt Hansen at StatStuff
Matt Hansen
 
Different Sources of Data with Matt Hansen at StatStuff
Different Sources of Data with Matt Hansen at StatStuffDifferent Sources of Data with Matt Hansen at StatStuff
Different Sources of Data with Matt Hansen at StatStuff
Matt Hansen
 
Hypothesis Testing: Formal and Informal Sub-Processes
Hypothesis Testing: Formal and Informal Sub-ProcessesHypothesis Testing: Formal and Informal Sub-Processes
Hypothesis Testing: Formal and Informal Sub-Processes
Matt Hansen
 
Hypothesis Testing: Relationships (Compare 2+ Factors)
Hypothesis Testing: Relationships (Compare 2+ Factors)Hypothesis Testing: Relationships (Compare 2+ Factors)
Hypothesis Testing: Relationships (Compare 2+ Factors)
Matt Hansen
 
Compiling Operational Definitions with Matt Hansen at StatStuff
Compiling Operational Definitions with Matt Hansen at StatStuffCompiling Operational Definitions with Matt Hansen at StatStuff
Compiling Operational Definitions with Matt Hansen at StatStuff
Matt Hansen
 

What's hot (20)

Identify Root Causes – C&E Matrix
Identify Root Causes – C&E MatrixIdentify Root Causes – C&E Matrix
Identify Root Causes – C&E Matrix
 
Defining the Project Y
Defining the Project YDefining the Project Y
Defining the Project Y
 
MSA – Planning & Conducting the MSA
MSA – Planning & Conducting the MSAMSA – Planning & Conducting the MSA
MSA – Planning & Conducting the MSA
 
MSA – Overview
MSA – OverviewMSA – Overview
MSA – Overview
 
Process Capability: Step 6 (Binomial)
Process Capability: Step 6 (Binomial)Process Capability: Step 6 (Binomial)
Process Capability: Step 6 (Binomial)
 
Variation Over Time (Short/Long Term Data)
Variation Over Time (Short/Long Term Data)Variation Over Time (Short/Long Term Data)
Variation Over Time (Short/Long Term Data)
 
Calculating a Sample Size
Calculating a Sample SizeCalculating a Sample Size
Calculating a Sample Size
 
Process Capability: Step 4 (Normal Distributions)
Process Capability: Step 4 (Normal Distributions)Process Capability: Step 4 (Normal Distributions)
Process Capability: Step 4 (Normal Distributions)
 
Analyze Phase Roadmap (Level 3)
Analyze Phase Roadmap (Level 3)Analyze Phase Roadmap (Level 3)
Analyze Phase Roadmap (Level 3)
 
Building a Scorecard
Building a ScorecardBuilding a Scorecard
Building a Scorecard
 
Rational Sub-Grouping
Rational Sub-GroupingRational Sub-Grouping
Rational Sub-Grouping
 
Measure Phase Roadmap (Level 3) with Matt Hansen at StatStuff
Measure Phase Roadmap (Level 3) with Matt Hansen at StatStuffMeasure Phase Roadmap (Level 3) with Matt Hansen at StatStuff
Measure Phase Roadmap (Level 3) with Matt Hansen at StatStuff
 
Process Capability: Step 5 (Non-Normal Distributions)
Process Capability: Step 5 (Non-Normal Distributions)Process Capability: Step 5 (Non-Normal Distributions)
Process Capability: Step 5 (Non-Normal Distributions)
 
Building a Process Map with Matt Hansen at StatStuff
Building a Process Map with Matt Hansen at StatStuffBuilding a Process Map with Matt Hansen at StatStuff
Building a Process Map with Matt Hansen at StatStuff
 
Descriptive Statistics
Descriptive StatisticsDescriptive Statistics
Descriptive Statistics
 
The Necessity of the Measure Phase with Matt Hansen at StatStuff
The Necessity of the Measure Phase with Matt Hansen at StatStuffThe Necessity of the Measure Phase with Matt Hansen at StatStuff
The Necessity of the Measure Phase with Matt Hansen at StatStuff
 
Different Sources of Data with Matt Hansen at StatStuff
Different Sources of Data with Matt Hansen at StatStuffDifferent Sources of Data with Matt Hansen at StatStuff
Different Sources of Data with Matt Hansen at StatStuff
 
Hypothesis Testing: Formal and Informal Sub-Processes
Hypothesis Testing: Formal and Informal Sub-ProcessesHypothesis Testing: Formal and Informal Sub-Processes
Hypothesis Testing: Formal and Informal Sub-Processes
 
Hypothesis Testing: Relationships (Compare 2+ Factors)
Hypothesis Testing: Relationships (Compare 2+ Factors)Hypothesis Testing: Relationships (Compare 2+ Factors)
Hypothesis Testing: Relationships (Compare 2+ Factors)
 
Compiling Operational Definitions with Matt Hansen at StatStuff
Compiling Operational Definitions with Matt Hansen at StatStuffCompiling Operational Definitions with Matt Hansen at StatStuff
Compiling Operational Definitions with Matt Hansen at StatStuff
 

Similar to Identify Root Causes – C&E Diagram

Getting Feedback with a Plus/Delta Tool
Getting Feedback with a Plus/Delta ToolGetting Feedback with a Plus/Delta Tool
Getting Feedback with a Plus/Delta Tool
Matt Hansen
 
Leading a Lean Workout (Kaizen Event) with Matt Hansen at StatStuff
Leading a Lean Workout (Kaizen Event) with Matt Hansen at StatStuffLeading a Lean Workout (Kaizen Event) with Matt Hansen at StatStuff
Leading a Lean Workout (Kaizen Event) with Matt Hansen at StatStuff
Matt Hansen
 
Building a Project Storyboard with Matt Hansen at StatStuff
Building a Project Storyboard with Matt Hansen at StatStuffBuilding a Project Storyboard with Matt Hansen at StatStuff
Building a Project Storyboard with Matt Hansen at StatStuff
Matt Hansen
 
Building a Project Charter with Matt Hansen at StatStuff
Building a Project Charter with Matt Hansen at StatStuffBuilding a Project Charter with Matt Hansen at StatStuff
Building a Project Charter with Matt Hansen at StatStuff
Matt Hansen
 
Cause effect diagram
Cause effect diagramCause effect diagram
Cause effect diagram
Sun Technologies
 
Prioritize Solutions with an Impact Matrix
Prioritize Solutions with an Impact MatrixPrioritize Solutions with an Impact Matrix
Prioritize Solutions with an Impact Matrix
Matt Hansen
 
What's new in Design-Expert version 9?
 What's new in  Design-Expert version 9? What's new in  Design-Expert version 9?
What's new in Design-Expert version 9?
Cheer Chain Enterprise Co., Ltd.
 
Building a Problem Statement with Matt Hansen at StatStuff
Building a Problem Statement with Matt Hansen at StatStuffBuilding a Problem Statement with Matt Hansen at StatStuff
Building a Problem Statement with Matt Hansen at StatStuff
Matt Hansen
 
Identify Root Causes – 5 Whys
Identify Root Causes – 5 WhysIdentify Root Causes – 5 Whys
Identify Root Causes – 5 Whys
Matt Hansen
 
Design expert 9 tutorials 2015
Design expert 9 tutorials 2015Design expert 9 tutorials 2015
Design expert 9 tutorials 2015
Cheer Chain Enterprise Co., Ltd.
 
Quality tools in JUST 2 HOURS !!
Quality tools in JUST 2 HOURS !!Quality tools in JUST 2 HOURS !!
Quality tools in JUST 2 HOURS !!
The Jamilah H
 
Андрій Татчин "Software Project Estimation: Theory and Reality"
Андрій Татчин "Software Project Estimation: Theory and Reality" Андрій Татчин "Software Project Estimation: Theory and Reality"
Андрій Татчин "Software Project Estimation: Theory and Reality"
Lviv Startup Club
 
Get started with Sketch: a fast (and awesome) communication and design tool
Get started with Sketch: a fast (and awesome) communication and design toolGet started with Sketch: a fast (and awesome) communication and design tool
Get started with Sketch: a fast (and awesome) communication and design tool
Christopher Azar
 
Kinetic casestudy
Kinetic casestudyKinetic casestudy
Kinetic casestudy
David Riedy
 
Causeeffect
CauseeffectCauseeffect
Causeeffect
cristoselvi
 
Project Pre-Assessment Using a Min/Max Analysis with Matt Hansen at StatStuff
Project Pre-Assessment Using a Min/Max Analysis with Matt Hansen at StatStuffProject Pre-Assessment Using a Min/Max Analysis with Matt Hansen at StatStuff
Project Pre-Assessment Using a Min/Max Analysis with Matt Hansen at StatStuff
Matt Hansen
 
Cmgt 410 cmgt410 cmgt 410 education for service uopstudy.com
Cmgt 410 cmgt410 cmgt 410 education for service   uopstudy.comCmgt 410 cmgt410 cmgt 410 education for service   uopstudy.com
Cmgt 410 cmgt410 cmgt 410 education for service uopstudy.com
UOPCourseHelp
 
New 7QC tools for the quality person during RCa
New 7QC tools for the quality person during RCaNew 7QC tools for the quality person during RCa
New 7QC tools for the quality person during RCa
AravindhNagaraj1
 
06 Opms Major Steps To Create
06 Opms Major Steps To Create06 Opms Major Steps To Create
06 Opms Major Steps To Create
Gs Chandy
 

Similar to Identify Root Causes – C&E Diagram (20)

Getting Feedback with a Plus/Delta Tool
Getting Feedback with a Plus/Delta ToolGetting Feedback with a Plus/Delta Tool
Getting Feedback with a Plus/Delta Tool
 
Leading a Lean Workout (Kaizen Event) with Matt Hansen at StatStuff
Leading a Lean Workout (Kaizen Event) with Matt Hansen at StatStuffLeading a Lean Workout (Kaizen Event) with Matt Hansen at StatStuff
Leading a Lean Workout (Kaizen Event) with Matt Hansen at StatStuff
 
Building a Project Storyboard with Matt Hansen at StatStuff
Building a Project Storyboard with Matt Hansen at StatStuffBuilding a Project Storyboard with Matt Hansen at StatStuff
Building a Project Storyboard with Matt Hansen at StatStuff
 
Building a Project Charter with Matt Hansen at StatStuff
Building a Project Charter with Matt Hansen at StatStuffBuilding a Project Charter with Matt Hansen at StatStuff
Building a Project Charter with Matt Hansen at StatStuff
 
Cause effect diagram
Cause effect diagramCause effect diagram
Cause effect diagram
 
Prioritize Solutions with an Impact Matrix
Prioritize Solutions with an Impact MatrixPrioritize Solutions with an Impact Matrix
Prioritize Solutions with an Impact Matrix
 
What's new in Design-Expert version 9?
 What's new in  Design-Expert version 9? What's new in  Design-Expert version 9?
What's new in Design-Expert version 9?
 
Building a Problem Statement with Matt Hansen at StatStuff
Building a Problem Statement with Matt Hansen at StatStuffBuilding a Problem Statement with Matt Hansen at StatStuff
Building a Problem Statement with Matt Hansen at StatStuff
 
Identify Root Causes – 5 Whys
Identify Root Causes – 5 WhysIdentify Root Causes – 5 Whys
Identify Root Causes – 5 Whys
 
Design expert 9 tutorials 2015
Design expert 9 tutorials 2015Design expert 9 tutorials 2015
Design expert 9 tutorials 2015
 
Quality tools in JUST 2 HOURS !!
Quality tools in JUST 2 HOURS !!Quality tools in JUST 2 HOURS !!
Quality tools in JUST 2 HOURS !!
 
Андрій Татчин "Software Project Estimation: Theory and Reality"
Андрій Татчин "Software Project Estimation: Theory and Reality" Андрій Татчин "Software Project Estimation: Theory and Reality"
Андрій Татчин "Software Project Estimation: Theory and Reality"
 
Sas 07 Costing
Sas 07 CostingSas 07 Costing
Sas 07 Costing
 
Get started with Sketch: a fast (and awesome) communication and design tool
Get started with Sketch: a fast (and awesome) communication and design toolGet started with Sketch: a fast (and awesome) communication and design tool
Get started with Sketch: a fast (and awesome) communication and design tool
 
Kinetic casestudy
Kinetic casestudyKinetic casestudy
Kinetic casestudy
 
Causeeffect
CauseeffectCauseeffect
Causeeffect
 
Project Pre-Assessment Using a Min/Max Analysis with Matt Hansen at StatStuff
Project Pre-Assessment Using a Min/Max Analysis with Matt Hansen at StatStuffProject Pre-Assessment Using a Min/Max Analysis with Matt Hansen at StatStuff
Project Pre-Assessment Using a Min/Max Analysis with Matt Hansen at StatStuff
 
Cmgt 410 cmgt410 cmgt 410 education for service uopstudy.com
Cmgt 410 cmgt410 cmgt 410 education for service   uopstudy.comCmgt 410 cmgt410 cmgt 410 education for service   uopstudy.com
Cmgt 410 cmgt410 cmgt 410 education for service uopstudy.com
 
New 7QC tools for the quality person during RCa
New 7QC tools for the quality person during RCaNew 7QC tools for the quality person during RCa
New 7QC tools for the quality person during RCa
 
06 Opms Major Steps To Create
06 Opms Major Steps To Create06 Opms Major Steps To Create
06 Opms Major Steps To Create
 

More from Matt Hansen

Closing a Project
Closing a ProjectClosing a Project
Closing a Project
Matt Hansen
 
Documenting a New Process with SOPs
Documenting a New Process with SOPsDocumenting a New Process with SOPs
Documenting a New Process with SOPs
Matt Hansen
 
Building a Control Plan
Building a Control PlanBuilding a Control Plan
Building a Control Plan
Matt Hansen
 
Control Charts: Recalculating Control Limits
Control Charts: Recalculating Control LimitsControl Charts: Recalculating Control Limits
Control Charts: Recalculating Control Limits
Matt Hansen
 
Control Charts: U Chart
Control Charts: U ChartControl Charts: U Chart
Control Charts: U Chart
Matt Hansen
 
Control Charts: P Chart
Control Charts: P ChartControl Charts: P Chart
Control Charts: P Chart
Matt Hansen
 
Control Charts: Xbar-S Chart
Control Charts: Xbar-S ChartControl Charts: Xbar-S Chart
Control Charts: Xbar-S Chart
Matt Hansen
 
Control Charts: I-MR Chart
Control Charts: I-MR ChartControl Charts: I-MR Chart
Control Charts: I-MR Chart
Matt Hansen
 
Control Charts: Finding the Right Control Chart
Control Charts: Finding the Right Control ChartControl Charts: Finding the Right Control Chart
Control Charts: Finding the Right Control Chart
Matt Hansen
 
Control Phase Roadmap (Level 3)
Control Phase Roadmap (Level 3)Control Phase Roadmap (Level 3)
Control Phase Roadmap (Level 3)
Matt Hansen
 
Piloting Solutions: Build the Pilot Plan
Piloting Solutions: Build the Pilot PlanPiloting Solutions: Build the Pilot Plan
Piloting Solutions: Build the Pilot Plan
Matt Hansen
 
Piloting Solutions: The Process
Piloting Solutions: The ProcessPiloting Solutions: The Process
Piloting Solutions: The Process
Matt Hansen
 
Risk Assessment with a FMEA Tool
Risk Assessment with a FMEA ToolRisk Assessment with a FMEA Tool
Risk Assessment with a FMEA Tool
Matt Hansen
 
Brainstorm Solutions with an Affinity Diagram
Brainstorm Solutions with an Affinity DiagramBrainstorm Solutions with an Affinity Diagram
Brainstorm Solutions with an Affinity Diagram
Matt Hansen
 
Brainstorm & Prioritize Solutions with a Workout
Brainstorm & Prioritize Solutions with a WorkoutBrainstorm & Prioritize Solutions with a Workout
Brainstorm & Prioritize Solutions with a Workout
Matt Hansen
 
Testing for Multicollinearity
Testing for MulticollinearityTesting for Multicollinearity
Testing for Multicollinearity
Matt Hansen
 
Compiling Analysis Results
Compiling Analysis ResultsCompiling Analysis Results
Compiling Analysis Results
Matt Hansen
 
Improve Phase Roadmap (Level 3)
Improve Phase Roadmap (Level 3)Improve Phase Roadmap (Level 3)
Improve Phase Roadmap (Level 3)
Matt Hansen
 
Hypothesis Testing: Relationships (Compare 1:1)
Hypothesis Testing: Relationships (Compare 1:1)Hypothesis Testing: Relationships (Compare 1:1)
Hypothesis Testing: Relationships (Compare 1:1)
Matt Hansen
 
Hypothesis Testing: Relationships (Overview)
Hypothesis Testing: Relationships (Overview)Hypothesis Testing: Relationships (Overview)
Hypothesis Testing: Relationships (Overview)
Matt Hansen
 

More from Matt Hansen (20)

Closing a Project
Closing a ProjectClosing a Project
Closing a Project
 
Documenting a New Process with SOPs
Documenting a New Process with SOPsDocumenting a New Process with SOPs
Documenting a New Process with SOPs
 
Building a Control Plan
Building a Control PlanBuilding a Control Plan
Building a Control Plan
 
Control Charts: Recalculating Control Limits
Control Charts: Recalculating Control LimitsControl Charts: Recalculating Control Limits
Control Charts: Recalculating Control Limits
 
Control Charts: U Chart
Control Charts: U ChartControl Charts: U Chart
Control Charts: U Chart
 
Control Charts: P Chart
Control Charts: P ChartControl Charts: P Chart
Control Charts: P Chart
 
Control Charts: Xbar-S Chart
Control Charts: Xbar-S ChartControl Charts: Xbar-S Chart
Control Charts: Xbar-S Chart
 
Control Charts: I-MR Chart
Control Charts: I-MR ChartControl Charts: I-MR Chart
Control Charts: I-MR Chart
 
Control Charts: Finding the Right Control Chart
Control Charts: Finding the Right Control ChartControl Charts: Finding the Right Control Chart
Control Charts: Finding the Right Control Chart
 
Control Phase Roadmap (Level 3)
Control Phase Roadmap (Level 3)Control Phase Roadmap (Level 3)
Control Phase Roadmap (Level 3)
 
Piloting Solutions: Build the Pilot Plan
Piloting Solutions: Build the Pilot PlanPiloting Solutions: Build the Pilot Plan
Piloting Solutions: Build the Pilot Plan
 
Piloting Solutions: The Process
Piloting Solutions: The ProcessPiloting Solutions: The Process
Piloting Solutions: The Process
 
Risk Assessment with a FMEA Tool
Risk Assessment with a FMEA ToolRisk Assessment with a FMEA Tool
Risk Assessment with a FMEA Tool
 
Brainstorm Solutions with an Affinity Diagram
Brainstorm Solutions with an Affinity DiagramBrainstorm Solutions with an Affinity Diagram
Brainstorm Solutions with an Affinity Diagram
 
Brainstorm & Prioritize Solutions with a Workout
Brainstorm & Prioritize Solutions with a WorkoutBrainstorm & Prioritize Solutions with a Workout
Brainstorm & Prioritize Solutions with a Workout
 
Testing for Multicollinearity
Testing for MulticollinearityTesting for Multicollinearity
Testing for Multicollinearity
 
Compiling Analysis Results
Compiling Analysis ResultsCompiling Analysis Results
Compiling Analysis Results
 
Improve Phase Roadmap (Level 3)
Improve Phase Roadmap (Level 3)Improve Phase Roadmap (Level 3)
Improve Phase Roadmap (Level 3)
 
Hypothesis Testing: Relationships (Compare 1:1)
Hypothesis Testing: Relationships (Compare 1:1)Hypothesis Testing: Relationships (Compare 1:1)
Hypothesis Testing: Relationships (Compare 1:1)
 
Hypothesis Testing: Relationships (Overview)
Hypothesis Testing: Relationships (Overview)Hypothesis Testing: Relationships (Overview)
Hypothesis Testing: Relationships (Overview)
 

Recently uploaded

ikea_woodgreen_petscharity_cat-alogue_digital.pdf
ikea_woodgreen_petscharity_cat-alogue_digital.pdfikea_woodgreen_petscharity_cat-alogue_digital.pdf
ikea_woodgreen_petscharity_cat-alogue_digital.pdf
agatadrynko
 
Skye Residences | Extended Stay Residences Near Toronto Airport
Skye Residences | Extended Stay Residences Near Toronto AirportSkye Residences | Extended Stay Residences Near Toronto Airport
Skye Residences | Extended Stay Residences Near Toronto Airport
marketingjdass
 
Project File Report BBA 6th semester.pdf
Project File Report BBA 6th semester.pdfProject File Report BBA 6th semester.pdf
Project File Report BBA 6th semester.pdf
RajPriye
 
The Influence of Marketing Strategy and Market Competition on Business Perfor...
The Influence of Marketing Strategy and Market Competition on Business Perfor...The Influence of Marketing Strategy and Market Competition on Business Perfor...
The Influence of Marketing Strategy and Market Competition on Business Perfor...
Adam Smith
 
Meas_Dylan_DMBS_PB1_2024-05XX_Revised.pdf
Meas_Dylan_DMBS_PB1_2024-05XX_Revised.pdfMeas_Dylan_DMBS_PB1_2024-05XX_Revised.pdf
Meas_Dylan_DMBS_PB1_2024-05XX_Revised.pdf
dylandmeas
 
Maksym Vyshnivetskyi: PMO Quality Management (UA)
Maksym Vyshnivetskyi: PMO Quality Management (UA)Maksym Vyshnivetskyi: PMO Quality Management (UA)
Maksym Vyshnivetskyi: PMO Quality Management (UA)
Lviv Startup Club
 
Discover the innovative and creative projects that highlight my journey throu...
Discover the innovative and creative projects that highlight my journey throu...Discover the innovative and creative projects that highlight my journey throu...
Discover the innovative and creative projects that highlight my journey throu...
dylandmeas
 
Affordable Stationery Printing Services in Jaipur | Navpack n Print
Affordable Stationery Printing Services in Jaipur | Navpack n PrintAffordable Stationery Printing Services in Jaipur | Navpack n Print
Affordable Stationery Printing Services in Jaipur | Navpack n Print
Navpack & Print
 
Search Disrupted Google’s Leaked Documents Rock the SEO World.pdf
Search Disrupted Google’s Leaked Documents Rock the SEO World.pdfSearch Disrupted Google’s Leaked Documents Rock the SEO World.pdf
Search Disrupted Google’s Leaked Documents Rock the SEO World.pdf
Arihant Webtech Pvt. Ltd
 
Exploring Patterns of Connection with Social Dreaming
Exploring Patterns of Connection with Social DreamingExploring Patterns of Connection with Social Dreaming
Exploring Patterns of Connection with Social Dreaming
Nicola Wreford-Howard
 
April 2024 Nostalgia Products Newsletter
April 2024 Nostalgia Products NewsletterApril 2024 Nostalgia Products Newsletter
April 2024 Nostalgia Products Newsletter
NathanBaughman3
 
falcon-invoice-discounting-a-premier-platform-for-investors-in-india
falcon-invoice-discounting-a-premier-platform-for-investors-in-indiafalcon-invoice-discounting-a-premier-platform-for-investors-in-india
falcon-invoice-discounting-a-premier-platform-for-investors-in-india
Falcon Invoice Discounting
 
Memorandum Of Association Constitution of Company.ppt
Memorandum Of Association Constitution of Company.pptMemorandum Of Association Constitution of Company.ppt
Memorandum Of Association Constitution of Company.ppt
seri bangash
 
Unveiling the Secrets How Does Generative AI Work.pdf
Unveiling the Secrets How Does Generative AI Work.pdfUnveiling the Secrets How Does Generative AI Work.pdf
Unveiling the Secrets How Does Generative AI Work.pdf
Sam H
 
amptalk_RecruitingDeck_english_2024.06.05
amptalk_RecruitingDeck_english_2024.06.05amptalk_RecruitingDeck_english_2024.06.05
amptalk_RecruitingDeck_english_2024.06.05
marketing317746
 
Buy Verified PayPal Account | Buy Google 5 Star Reviews
Buy Verified PayPal Account | Buy Google 5 Star ReviewsBuy Verified PayPal Account | Buy Google 5 Star Reviews
Buy Verified PayPal Account | Buy Google 5 Star Reviews
usawebmarket
 
Kseniya Leshchenko: Shared development support service model as the way to ma...
Kseniya Leshchenko: Shared development support service model as the way to ma...Kseniya Leshchenko: Shared development support service model as the way to ma...
Kseniya Leshchenko: Shared development support service model as the way to ma...
Lviv Startup Club
 
Introduction to Amazon company 111111111111
Introduction to Amazon company 111111111111Introduction to Amazon company 111111111111
Introduction to Amazon company 111111111111
zoyaansari11365
 
Brand Analysis for an artist named Struan
Brand Analysis for an artist named StruanBrand Analysis for an artist named Struan
Brand Analysis for an artist named Struan
sarahvanessa51503
 
一比一原版加拿大渥太华大学毕业证(uottawa毕业证书)如何办理
一比一原版加拿大渥太华大学毕业证(uottawa毕业证书)如何办理一比一原版加拿大渥太华大学毕业证(uottawa毕业证书)如何办理
一比一原版加拿大渥太华大学毕业证(uottawa毕业证书)如何办理
taqyed
 

Recently uploaded (20)

ikea_woodgreen_petscharity_cat-alogue_digital.pdf
ikea_woodgreen_petscharity_cat-alogue_digital.pdfikea_woodgreen_petscharity_cat-alogue_digital.pdf
ikea_woodgreen_petscharity_cat-alogue_digital.pdf
 
Skye Residences | Extended Stay Residences Near Toronto Airport
Skye Residences | Extended Stay Residences Near Toronto AirportSkye Residences | Extended Stay Residences Near Toronto Airport
Skye Residences | Extended Stay Residences Near Toronto Airport
 
Project File Report BBA 6th semester.pdf
Project File Report BBA 6th semester.pdfProject File Report BBA 6th semester.pdf
Project File Report BBA 6th semester.pdf
 
The Influence of Marketing Strategy and Market Competition on Business Perfor...
The Influence of Marketing Strategy and Market Competition on Business Perfor...The Influence of Marketing Strategy and Market Competition on Business Perfor...
The Influence of Marketing Strategy and Market Competition on Business Perfor...
 
Meas_Dylan_DMBS_PB1_2024-05XX_Revised.pdf
Meas_Dylan_DMBS_PB1_2024-05XX_Revised.pdfMeas_Dylan_DMBS_PB1_2024-05XX_Revised.pdf
Meas_Dylan_DMBS_PB1_2024-05XX_Revised.pdf
 
Maksym Vyshnivetskyi: PMO Quality Management (UA)
Maksym Vyshnivetskyi: PMO Quality Management (UA)Maksym Vyshnivetskyi: PMO Quality Management (UA)
Maksym Vyshnivetskyi: PMO Quality Management (UA)
 
Discover the innovative and creative projects that highlight my journey throu...
Discover the innovative and creative projects that highlight my journey throu...Discover the innovative and creative projects that highlight my journey throu...
Discover the innovative and creative projects that highlight my journey throu...
 
Affordable Stationery Printing Services in Jaipur | Navpack n Print
Affordable Stationery Printing Services in Jaipur | Navpack n PrintAffordable Stationery Printing Services in Jaipur | Navpack n Print
Affordable Stationery Printing Services in Jaipur | Navpack n Print
 
Search Disrupted Google’s Leaked Documents Rock the SEO World.pdf
Search Disrupted Google’s Leaked Documents Rock the SEO World.pdfSearch Disrupted Google’s Leaked Documents Rock the SEO World.pdf
Search Disrupted Google’s Leaked Documents Rock the SEO World.pdf
 
Exploring Patterns of Connection with Social Dreaming
Exploring Patterns of Connection with Social DreamingExploring Patterns of Connection with Social Dreaming
Exploring Patterns of Connection with Social Dreaming
 
April 2024 Nostalgia Products Newsletter
April 2024 Nostalgia Products NewsletterApril 2024 Nostalgia Products Newsletter
April 2024 Nostalgia Products Newsletter
 
falcon-invoice-discounting-a-premier-platform-for-investors-in-india
falcon-invoice-discounting-a-premier-platform-for-investors-in-indiafalcon-invoice-discounting-a-premier-platform-for-investors-in-india
falcon-invoice-discounting-a-premier-platform-for-investors-in-india
 
Memorandum Of Association Constitution of Company.ppt
Memorandum Of Association Constitution of Company.pptMemorandum Of Association Constitution of Company.ppt
Memorandum Of Association Constitution of Company.ppt
 
Unveiling the Secrets How Does Generative AI Work.pdf
Unveiling the Secrets How Does Generative AI Work.pdfUnveiling the Secrets How Does Generative AI Work.pdf
Unveiling the Secrets How Does Generative AI Work.pdf
 
amptalk_RecruitingDeck_english_2024.06.05
amptalk_RecruitingDeck_english_2024.06.05amptalk_RecruitingDeck_english_2024.06.05
amptalk_RecruitingDeck_english_2024.06.05
 
Buy Verified PayPal Account | Buy Google 5 Star Reviews
Buy Verified PayPal Account | Buy Google 5 Star ReviewsBuy Verified PayPal Account | Buy Google 5 Star Reviews
Buy Verified PayPal Account | Buy Google 5 Star Reviews
 
Kseniya Leshchenko: Shared development support service model as the way to ma...
Kseniya Leshchenko: Shared development support service model as the way to ma...Kseniya Leshchenko: Shared development support service model as the way to ma...
Kseniya Leshchenko: Shared development support service model as the way to ma...
 
Introduction to Amazon company 111111111111
Introduction to Amazon company 111111111111Introduction to Amazon company 111111111111
Introduction to Amazon company 111111111111
 
Brand Analysis for an artist named Struan
Brand Analysis for an artist named StruanBrand Analysis for an artist named Struan
Brand Analysis for an artist named Struan
 
一比一原版加拿大渥太华大学毕业证(uottawa毕业证书)如何办理
一比一原版加拿大渥太华大学毕业证(uottawa毕业证书)如何办理一比一原版加拿大渥太华大学毕业证(uottawa毕业证书)如何办理
一比一原版加拿大渥太华大学毕业证(uottawa毕业证书)如何办理
 

Identify Root Causes – C&E Diagram

  • 1. Section & Lesson #: Pre-Requisite Lessons: Complex Tools + Clear Teaching = Powerful Results Identify Root Causes – C&E Diagram Six Sigma-Measure – Lesson 23 An extension of the topic on identifying root causes using a cause & effect (C&E) diagram that will lead toward building a data collection plan (DCP). Six Sigma-Measure #22 – Identify Root Causes – DCP Overview Copyright © 2011-2019 by Matthew J. Hansen. All Rights Reserved. No part of this publication may be reproduced, stored in a retrieval system, or transmitted by any means (electronic, mechanical, photographic, photocopying, recording or otherwise) without prior permission in writing by the author and/or publisher.
  • 2. Why Do We Need This Tool? o Remember, our goal of building the transfer function (Y = f(X)) begins with the DCP. • We should already know the Y, so now we need to find the potential X’s for the transfer function. • The data collection plan (DCP) helps ensure we have enough data measuring the Y and every X. • Below is the method previously described for helping to build the DCP: Copyright © 2011-2019 by Matthew J. Hansen. All Rights Reserved. No part of this publication may be reproduced, stored in a retrieval system, or transmitted by any means (electronic, mechanical, photographic, photocopying, recording or otherwise) without prior permission in writing by the author and/or publisher. 2 1. Define phase items plus Y & defect definitions 2. Validate Y & defect definition with Team 3. Identify potential X’s 4. Narrow down to most critical X’s 5. Build a data collection plan for critical X’s INPUT to Meeting PROCESS during Meeting OUTPUT from Meeting Tools: Cause & Effect (C&E) Diagram (a.k.a., Fishbone/Ishikawa diagram) and 5 Whys Tools: Cause & Effect (C&E) Matrix Tools: Sample Size Calculator & Data Collection Plan
  • 3. C&E Diagram Defined o What is a Cause & Effect (C&E) Diagram? • It’s a collaborative tool (a.k.a., Fishbone diagram or Ishikawa diagram) used by a team to help identify all possible causes for a particular undesirable effect. o What is the purpose of a C&E Diagram? • Helps a team focus on a problem’s content and not its history. • Keeps the team focused on the problem’s causes instead of the symptoms. • Uses a team’s collective knowledge to build a holistic view and create team consensus of all possible causes affecting a problem. o Below is an example of a C&E Diagram built in Minitab: Copyright © 2011-2019 by Matthew J. Hansen. All Rights Reserved. No part of this publication may be reproduced, stored in a retrieval system, or transmitted by any means (electronic, mechanical, photographic, photocopying, recording or otherwise) without prior permission in writing by the author and/or publisher. 3 Customer waits too long before talking to agent Materials Mother Nature Measurements Methods Machines Manpower Low Staffing Lev els Slow sy stem Processes require putting customer on hold to w rap up last call A gents aren't measured on A v g Speed to A nsw er C all reasons change throughout day (longer calls) C all v olume changes throughout day (affects staffing) Cause-and-Effect Diagram
  • 4. Building a C&E Diagram o How do you build the C&E Diagram? • Gather the team to build it together.  The C&E Diagram should be a collaborative, team product; it shouldn’t be created by just one person.  Build the diagram with the team on a dry erase board or flip chart using post-it notes. – There are many useful tools for building the diagram (e.g., Minitab, Excel, Visio, etc.); however, when working with a team, it can be more effective to build it manually first using post-it notes and using software later to document it. • Define the “Effect”.  This will most likely be the defects that were defined (or somehow tied to the problem statement). – If you have multiple defects defined, then each unique defect can be an “effect” for multiple C&E diagrams. • Draw and label the diagram’s “bones”.  Below are common sources of variation that can be a suggested list of labels for each “bone”: – Manpower – Personnel issues like turnover, training, etc. – Machine - Issues related to equipment, hard/software, etc. – Method - Issues related to policies, SOPs, regulations, etc. – Measurement - Issues related to how things are measured like standards, performance, goals, etc. – Materials - Issues related to documentation, forms, etc. – Mother Nature - Issues related to outside influences like the economy, customers, vendors, etc.  These labels can be modified and should be limited to just 4 to 6 unique labels. – The labels help categorize possible causes so it’s important that they are unique and relevant to the identified “effect”. • Brainstorm potential causes for each of the “bone” categories.  Write on a post-it note a potential cause and stick it to each category. Move them around as necessary. • Identify sub-causes by drilling more deeply into each cause by asking “Why does this happen?”  Notate each sub-cause as another “bone” extending off the main “bones”. Copyright © 2011-2019 by Matthew J. Hansen. All Rights Reserved. No part of this publication may be reproduced, stored in a retrieval system, or transmitted by any means (electronic, mechanical, photographic, photocopying, recording or otherwise) without prior permission in writing by the author and/or publisher. 4 Cause & Effect Diagram Materials Methods Manpower Mother Nature Measurement s Machines
  • 5. Documenting a C&E Diagram o How do you document the C&E Diagram? • After the team manually builds the C&E diagram, it should be documented using various software tools to make it easily accessible and to embed it into the project storyboard. • Below are the instructions for building the diagram into Minitab:  Begin by typing the identified causes into different columns in Minitab’s worksheet.  In Minitab go to Stat > Quality Tools > Cause and Effect…  Update the “Label” section to reflect the “bone” labels used in the diagram.  For the “Causes”, assign the column title respective to the label you noted. – If you have sub-causes, change the “In Column” drop-down to “Constant” to reflect the name of the new bone extension. – Then click the “Sub…”button and assign the column title respective to the newly created label.  Type in the “Effect”.  Add a new title as needed, otherwise Minitab will entitle it “Cause and Effect Diagram”.  The dialog example (at right) is what was used to create the previously shown C&E diagram. Copyright © 2011-2019 by Matthew J. Hansen. All Rights Reserved. No part of this publication may be reproduced, stored in a retrieval system, or transmitted by any means (electronic, mechanical, photographic, photocopying, recording or otherwise) without prior permission in writing by the author and/or publisher. 5
  • 6. Practical Application o Identify a prior project or initiative you worked in your organization. • Try building a C&E Diagram for that project or initiative by answering the following:  What was used as the critical metric (project Y)?  How would you define a defect? – This would be the ultimate “effect” used in the C&E Diagram.  Review each source of variation listed below and notate any related causes leading to the effect. – Manpower – Machine – Method – Measurement – Materials – Mother Nature  Notate any additional sub-causes that also eventually lead to the ultimate effect. • Try building the C&E Diagram in an online tool like Minitab, Visio, PowerPoint, etc. Copyright © 2011-2019 by Matthew J. Hansen. All Rights Reserved. No part of this publication may be reproduced, stored in a retrieval system, or transmitted by any means (electronic, mechanical, photographic, photocopying, recording or otherwise) without prior permission in writing by the author and/or publisher. 6