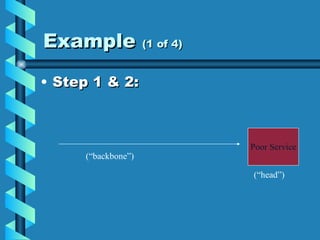
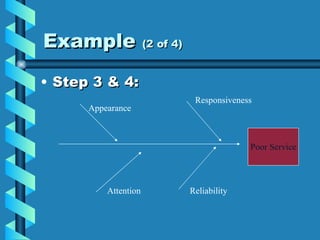
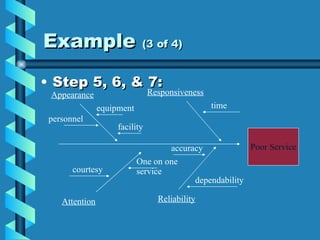
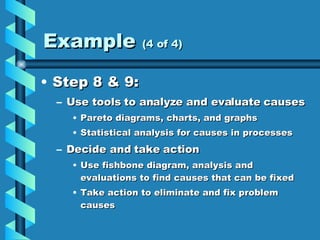

1. Fishbone diagrams (also called Ishikawa or cause-and-effect diagrams) are a visual tool for identifying potential causes of problems or effects. 2. They resemble a fish skeleton and are used to structure a team's brainstorming to generate possible causes for quality issues or other problems in products, processes, or services. 3. The creation of fishbone diagrams involves identifying the main problem or effect, major causes, secondary causes, and relationships between causes to understand root causes and facilitate problem-solving.


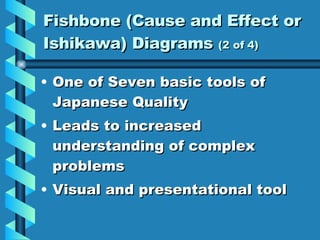
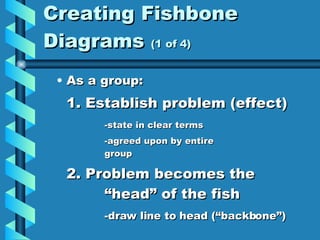
![Qcl 14-v3 [cause effect diagram-poor placement of students]-[banasthali unive...](https://cdn.slidesharecdn.com/ss_thumbnails/qcl-14-v3causeeffectdiagram-poorplacementofstudentsbanasthaliuniversityanshuverma-150110071924-conversion-gate01-thumbnail.jpg?width=640&height=640&fit=bounds)


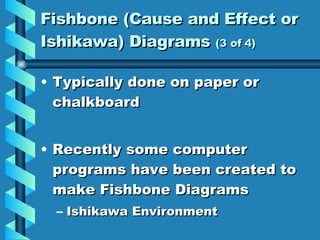
![Qcl 14-v3 [cause-effect diagram]-[banasthali university]_[shreya gupta]](https://cdn.slidesharecdn.com/ss_thumbnails/qcl-14-v3cause-effectdiagrambanasthaliuniversityshreyagupta-150121060516-conversion-gate01-thumbnail.jpg?width=640&height=640&fit=bounds)

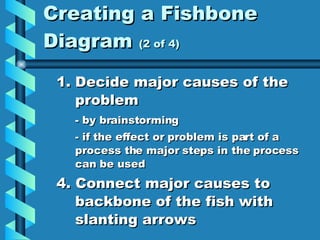
![Qcl 14-v3 [cause-effect diagram]-[parinita dwivedi]_[banasthali university]](https://cdn.slidesharecdn.com/ss_thumbnails/qcl-14-v3cause-effectdiagramparinitadwivedibanasthaliuniversity-150117081348-conversion-gate02-thumbnail.jpg?width=640&height=640&fit=bounds)


