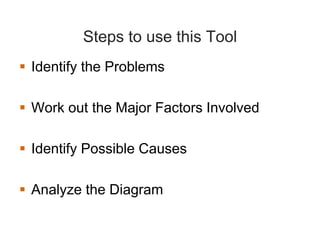
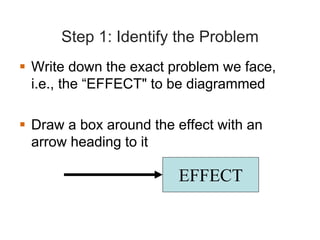
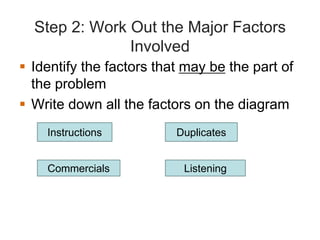
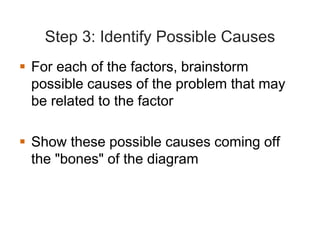
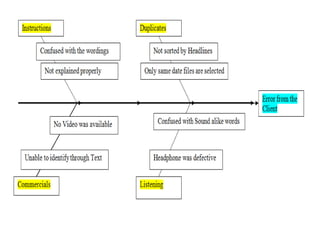
Cause and Effect Analysis
Amit Shrivastava
Hyderabad, India.
History
 Cause and Effect Analysis was devised by
professor Kaoru Ishikawa, a pioneer of
quality management, in the 1960s. The
technique was then published in his 1990
book, "Introduction to Quality Control.“
 The diagrams that we create, are known
as Ishikawa Diagrams or Fishbone
Diagrams
This is used to:
 Discover the root cause of a problem
 Uncover bottlenecks in the process
 Identify where and why the process isn't
working
Key Points
The technique uses a diagram-based
approach for thinking through all of the
possible causes of a problem. This helps to
carry out a thorough analysis of the
situation.
Steps to use this Tool
 Identify the Problems
 Work out the Major Factors Involved
 Identify Possible Causes
 Analyze the Diagram
Step 1: Identify the Problem
 Write down the exact problem we face,
i.e., the “EFFECT" to be diagrammed
 Draw a box around the effect with an
arrow heading to it
EFFECT
Step 2: Work Out the Major Factors
Involved
 Identify the factors that may be the part of
the problem
 Write down all the factors on the diagram
Instructions Duplicates
Commercials Listening
Step 3: Identify Possible Causes
 For each of the factors, brainstorm
possible causes of the problem that may
be related to the factor
 Show these possible causes coming off
the "bones" of the diagram
Step 4: Analyze the Diagram
 We have a diagram, that shows all of the
possible causes of the problem that we
can think of
 We can now investigate the most likely
causes further
Cause and effect analysis

Cause and effect analysis

  • 1.
    Cause and EffectAnalysis Amit Shrivastava Hyderabad, India.
  • 2.
    History  Cause andEffect Analysis was devised by professor Kaoru Ishikawa, a pioneer of quality management, in the 1960s. The technique was then published in his 1990 book, "Introduction to Quality Control.“  The diagrams that we create, are known as Ishikawa Diagrams or Fishbone Diagrams
  • 3.
    This is usedto:  Discover the root cause of a problem  Uncover bottlenecks in the process  Identify where and why the process isn't working
  • 4.
    Key Points The techniqueuses a diagram-based approach for thinking through all of the possible causes of a problem. This helps to carry out a thorough analysis of the situation.
  • 5.
    Steps to usethis Tool  Identify the Problems  Work out the Major Factors Involved  Identify Possible Causes  Analyze the Diagram
  • 6.
    Step 1: Identifythe Problem  Write down the exact problem we face, i.e., the “EFFECT" to be diagrammed  Draw a box around the effect with an arrow heading to it EFFECT
  • 7.
    Step 2: WorkOut the Major Factors Involved  Identify the factors that may be the part of the problem  Write down all the factors on the diagram Instructions Duplicates Commercials Listening
  • 8.
    Step 3: IdentifyPossible Causes  For each of the factors, brainstorm possible causes of the problem that may be related to the factor  Show these possible causes coming off the "bones" of the diagram
  • 10.
    Step 4: Analyzethe Diagram  We have a diagram, that shows all of the possible causes of the problem that we can think of  We can now investigate the most likely causes further