Downloaded 2,169 times


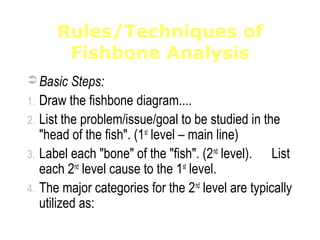
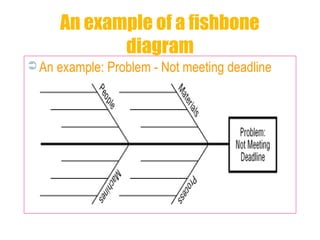
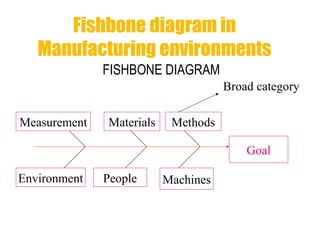
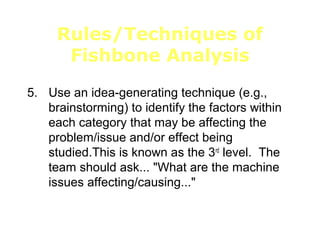
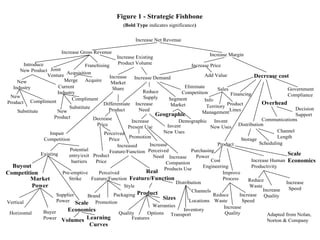
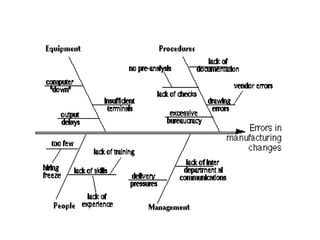
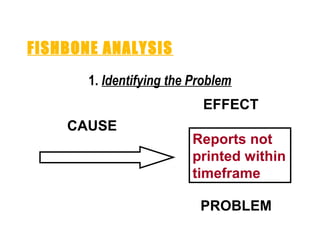
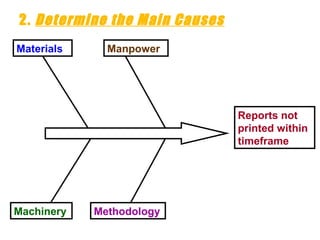
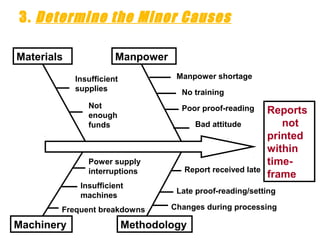
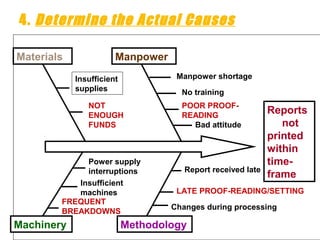
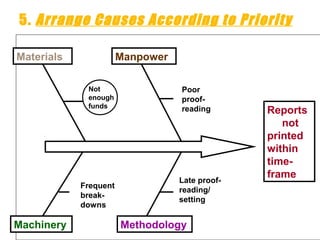

The document discusses fishbone analysis (also known as Ishikawa diagram), which is a tool for systematically analyzing the potential causes of quality, process, or project problems. It provides the following key points: 1. Dr. Kaoru Ishikawa invented the fishbone diagram to systematically analyze the effects and causes that contribute to those effects. 2. The fishbone diagram looks like the skeleton of a fish, with the "head" representing the problem/effect and the "bones" and sub-branches representing categories of causes and specific potential causes. 3. Basic steps for constructing a fishbone diagram include identifying the problem/effect, categorizing potential cause factors, brainstorming specific causes within


