SlideShare a Scribd company logo
Cause-and-Effect Diagrams
CAUSE-AND-EFFECT DIAGRAMS
What
A Cause-and-Effect (Fishbone or Ishikawa) Diagram is a picture composed of lines and
symbols designed to represent a meaningful relationship between an effect and its causes.
Cause-and-Effect Diagrams are used to investigate either a “bad” effect and thus correct
its causes or a “good” effect and thus learn how to continue doing things in a way that
produces good products or service. Cause-and-Effect Diagrams are designed to portray
complex situations so that they may be better understood and to analyze causes of poor or
bad service so that corrective action can be taken.
Causes contributing to the effects are categorized and assigned to major branches of the
diagram. For every effect there are likely to be several major categories of causes.
Frequently these fall into such categories as those related to:
• Machines or Equipment
• Methods/Procedures/Technique
• People/Crew/Team
• Materials/Component/Ingredient
• Measurements or Metrics
• Environment/Climate/Atmosphere
There can be many other ways to categorize the major causes, depending on the problem
or outcome being studied. Each of the major causes will, in turn, have numerous minor
causes or factors. The Cause-and-Effect tool provides a visual display of the sequence
and relationships of the causes—organized into major categories—which contribute to a
problem.
When
Use this tool in a group when you need to identify the possible causes of a problem and
how the causes interact.
Restructuring Associates Inc. © 2008 1
Cause-and-Effect Diagrams
How
• Gather people that have knowledge of, or experience with, the effect you are
studying as well as the processes that produce them. Try to get a diversified
group so that different perspectives are represented.
• Write a summary statement of the problem in a box on the right of the chart with
an arrow across the chart pointing to it.
• Brainstorm the causes of the problem. Everyone should contribute ideas about
possible causes. Remember, list only causes; avoid stating implied solutions such
as “lack of something” where something will fix the problem. The facilitator
writes down the causes as they are suggested.
• Add categories of causes to the diagram by drawing arrows to the main stem of
the diagram and labeling them with the categories. Three to five causes are most
common. Categories will vary depending on the nature of the problem. Some
common categories: materials, people, environment, methods, equipment, and
procedures. Reach agreement on major causes of the problem.
• Break down each of the categories of causes into smaller branches by placing the
brainstormed items on the appropriate branch of the diagram. Draw an arrow to
the larger arrow to show a cause and effect relationship, and write the
brainstormed item next to the line. Some items may be causes for other items on
the brainstormed list and should be drawn to show this relationship. (The arrow
indicates that an item leads to or causes the item it points to.)
• After all brainstormed items are placed on the diagram, analyze the diagram for
underlying root causes. Repeatedly ask "Why?" each item occurs and draw
additional arrows to show causes.
• Rank or prioritize the causes for further study. Pick several that the group thinks
have the greatest impact on the problem or offer the best opportunity for
improvement. Follow up with further study.
• If necessary, assign team members to collect data to clarify what is causing the
problem.
2 Restructuring Associates, Inc. © 2008
Cause-and-Effect Diagrams
CAUSE-AND-EFFECT DIAGRAM
Car Won't
Start
Mechanical Operator
Electrical Fuel System
Steering
Wheel
Locked
Motor
Frozen
Bad
Starter
Over
Heated
No Oil
Flooded
Engine
Not in
Park
Or
Neutral
Wrong
Key
Can't
Turn
Key
Battery
Loose
Connection
Corrosion
Starter
Connection
Cracked
Plug
Wi
Loose
Vapor
Lock
Bad
Fuel
Pump
No
Gas
Water
In
Fuel
Ice
Broken
Fuel
Line
Restructuring Associates Inc. © 2008 3

More Related Content

What's hot

Accident Investigation (2)
Accident Investigation (2)Accident Investigation (2)
Accident Investigation (2)
Moon Girl
 
Continous improvement tools
Continous improvement toolsContinous improvement tools
Continous improvement tools
DEPROCESS
 
Mgt tools and planning prof. moyani
Mgt tools and planning prof. moyaniMgt tools and planning prof. moyani
Mgt tools and planning prof. moyani
Jose Mendez
 
Continuos improvement tools ii
Continuos improvement tools iiContinuos improvement tools ii
Continuos improvement tools ii
DEPROCESS
 
Ishikawa diagram
Ishikawa diagramIshikawa diagram
Ishikawa diagram
kerviy
 
Lfa problem tree analysis
Lfa   problem tree analysisLfa   problem tree analysis
Lfa problem tree analysis
Liris Thomas
 

What's hot (19)

Seven management and planning tools
Seven management and planning tools Seven management and planning tools
Seven management and planning tools
 
Cause and effect diagram
Cause and effect diagramCause and effect diagram
Cause and effect diagram
 
Accident Investigation (2)
Accident Investigation (2)Accident Investigation (2)
Accident Investigation (2)
 
New seven management tools
New seven management toolsNew seven management tools
New seven management tools
 
New 7 Management Tools
New 7 Management ToolsNew 7 Management Tools
New 7 Management Tools
 
Cause and effect analysis
Cause and effect analysisCause and effect analysis
Cause and effect analysis
 
The Seven Management Tools - Total Quality Management
The Seven Management Tools - Total Quality ManagementThe Seven Management Tools - Total Quality Management
The Seven Management Tools - Total Quality Management
 
Developing a problem tree
Developing a problem treeDeveloping a problem tree
Developing a problem tree
 
Continous improvement tools
Continous improvement toolsContinous improvement tools
Continous improvement tools
 
Mgt tools and planning prof. moyani
Mgt tools and planning prof. moyaniMgt tools and planning prof. moyani
Mgt tools and planning prof. moyani
 
New7managementtools ppt
New7managementtools pptNew7managementtools ppt
New7managementtools ppt
 
Continuos improvement tools ii
Continuos improvement tools iiContinuos improvement tools ii
Continuos improvement tools ii
 
D08 Cause and effect
D08 Cause and effectD08 Cause and effect
D08 Cause and effect
 
New seven management tools
New seven management toolsNew seven management tools
New seven management tools
 
Fisbone Diagrams Assgnmnt1
Fisbone Diagrams Assgnmnt1Fisbone Diagrams Assgnmnt1
Fisbone Diagrams Assgnmnt1
 
Tqm old tools
Tqm old toolsTqm old tools
Tqm old tools
 
Ishikawa diagram
Ishikawa diagramIshikawa diagram
Ishikawa diagram
 
Lfa problem tree analysis
Lfa   problem tree analysisLfa   problem tree analysis
Lfa problem tree analysis
 
Basic Quality Control tools
Basic Quality Control toolsBasic Quality Control tools
Basic Quality Control tools
 

Viewers also liked

Erol Savas - Apollo Certificate
Erol Savas - Apollo CertificateErol Savas - Apollo Certificate
Erol Savas - Apollo Certificate
Erol Savas
 
Bfha member application_form
Bfha member application_formBfha member application_form
Bfha member application_form
broadwayflushing
 
Emerging Trends in Contraception
Emerging Trends in ContraceptionEmerging Trends in Contraception
Emerging Trends in Contraception
Linh Dinh
 

Viewers also liked (13)

Quezada daniel metodologia_21_05_2016
Quezada daniel metodologia_21_05_2016Quezada daniel metodologia_21_05_2016
Quezada daniel metodologia_21_05_2016
 
Erol Savas - Apollo Certificate
Erol Savas - Apollo CertificateErol Savas - Apollo Certificate
Erol Savas - Apollo Certificate
 
Rails para programadores Java
Rails para programadores JavaRails para programadores Java
Rails para programadores Java
 
Bfha member application_form
Bfha member application_formBfha member application_form
Bfha member application_form
 
Emerging Trends in Contraception
Emerging Trends in ContraceptionEmerging Trends in Contraception
Emerging Trends in Contraception
 
Ping pong ing gsm
Ping pong ing gsmPing pong ing gsm
Ping pong ing gsm
 
Teo
TeoTeo
Teo
 
January 2016 Tabor Newsletter
January 2016 Tabor NewsletterJanuary 2016 Tabor Newsletter
January 2016 Tabor Newsletter
 
Gen Y ROI - Credit Union Strategies that Work
Gen Y ROI - Credit Union Strategies that WorkGen Y ROI - Credit Union Strategies that Work
Gen Y ROI - Credit Union Strategies that Work
 
Maths club assignment pdf
Maths club assignment pdfMaths club assignment pdf
Maths club assignment pdf
 
Michael Murdoch 2016 CUES Next Top Credit Union Exec Presentation
Michael Murdoch 2016 CUES Next Top Credit Union Exec PresentationMichael Murdoch 2016 CUES Next Top Credit Union Exec Presentation
Michael Murdoch 2016 CUES Next Top Credit Union Exec Presentation
 
Shannon Cahoon 2016 CUES Next Top Credit Union Exec Presentation
Shannon Cahoon 2016 CUES Next Top Credit Union Exec PresentationShannon Cahoon 2016 CUES Next Top Credit Union Exec Presentation
Shannon Cahoon 2016 CUES Next Top Credit Union Exec Presentation
 
Hayley Badeaux 2015 CUES Next Top Credit Union Exec Presentation
Hayley Badeaux 2015 CUES Next Top Credit Union Exec PresentationHayley Badeaux 2015 CUES Next Top Credit Union Exec Presentation
Hayley Badeaux 2015 CUES Next Top Credit Union Exec Presentation
 

Similar to Causeeffect

7qctoolstraining-1811251dwadwd21928.pptx
7qctoolstraining-1811251dwadwd21928.pptx7qctoolstraining-1811251dwadwd21928.pptx
7qctoolstraining-1811251dwadwd21928.pptx
JaspherOcampo1
 
Root Cause Analysis
Root Cause AnalysisRoot Cause Analysis
Root Cause Analysis
johnchuddle
 
Problem solving use a fishbone diagram
Problem solving use a fishbone diagramProblem solving use a fishbone diagram
Problem solving use a fishbone diagram
JohnRicoPanjaitan
 
17053257 implementing-tqm-in-education
17053257 implementing-tqm-in-education17053257 implementing-tqm-in-education
17053257 implementing-tqm-in-education
lostwithabhi
 
17053257 implementing-tqm-in-education
17053257 implementing-tqm-in-education17053257 implementing-tqm-in-education
17053257 implementing-tqm-in-education
lostwithabhi
 
Disclaimer Use of this tool is not mandated by CMS, nor does
Disclaimer Use of this tool is not mandated by CMS, nor does Disclaimer Use of this tool is not mandated by CMS, nor does
Disclaimer Use of this tool is not mandated by CMS, nor does
AlyciaGold776
 
7 New QC Tools.ppt
7 New QC Tools.ppt7 New QC Tools.ppt
7 New QC Tools.ppt
neeru.s
 

Similar to Causeeffect (20)

Quality tools in JUST 2 HOURS !!
Quality tools in JUST 2 HOURS !!Quality tools in JUST 2 HOURS !!
Quality tools in JUST 2 HOURS !!
 
Cause & effect diagrams
Cause & effect diagramsCause & effect diagrams
Cause & effect diagrams
 
Cause & effect diagrams
Cause & effect diagramsCause & effect diagrams
Cause & effect diagrams
 
Cause & Effect Diagrams
Cause & Effect DiagramsCause & Effect Diagrams
Cause & Effect Diagrams
 
Cause & Effect Diagrams
Cause & Effect DiagramsCause & Effect Diagrams
Cause & Effect Diagrams
 
7qctoolstraining-1811251dwadwd21928.pptx
7qctoolstraining-1811251dwadwd21928.pptx7qctoolstraining-1811251dwadwd21928.pptx
7qctoolstraining-1811251dwadwd21928.pptx
 
Root Cause Analysis
Root Cause AnalysisRoot Cause Analysis
Root Cause Analysis
 
7 QC Tools training presentation
7 QC Tools training presentation7 QC Tools training presentation
7 QC Tools training presentation
 
Problem solving use a fishbone diagram
Problem solving use a fishbone diagramProblem solving use a fishbone diagram
Problem solving use a fishbone diagram
 
Quality_Control_Tools.ppt
Quality_Control_Tools.pptQuality_Control_Tools.ppt
Quality_Control_Tools.ppt
 
Seven Statistical tools for Quality Management
Seven Statistical tools for Quality ManagementSeven Statistical tools for Quality Management
Seven Statistical tools for Quality Management
 
17053257 implementing-tqm-in-education
17053257 implementing-tqm-in-education17053257 implementing-tqm-in-education
17053257 implementing-tqm-in-education
 
17053257 implementing-tqm-in-education
17053257 implementing-tqm-in-education17053257 implementing-tqm-in-education
17053257 implementing-tqm-in-education
 
Fish Bone
Fish BoneFish Bone
Fish Bone
 
Disclaimer Use of this tool is not mandated by CMS, nor does
Disclaimer Use of this tool is not mandated by CMS, nor does Disclaimer Use of this tool is not mandated by CMS, nor does
Disclaimer Use of this tool is not mandated by CMS, nor does
 
Fishbone.revised 11.18.13.pdf
Fishbone.revised 11.18.13.pdfFishbone.revised 11.18.13.pdf
Fishbone.revised 11.18.13.pdf
 
Tqm tools
Tqm toolsTqm tools
Tqm tools
 
Process Improvement Tools Daniel Pirzada
Process Improvement Tools Daniel PirzadaProcess Improvement Tools Daniel Pirzada
Process Improvement Tools Daniel Pirzada
 
Quality improvement tools
Quality improvement tools Quality improvement tools
Quality improvement tools
 
7 New QC Tools.ppt
7 New QC Tools.ppt7 New QC Tools.ppt
7 New QC Tools.ppt
 

Recently uploaded

The Future of Autonomous Vehicles | civilthings.com | Detailed information
The Future of Autonomous Vehicles | civilthings.com |  Detailed informationThe Future of Autonomous Vehicles | civilthings.com |  Detailed information
The Future of Autonomous Vehicles | civilthings.com | Detailed information
gettygaming1
 
一比一原版SDSU毕业证圣地亚哥州立大学毕业证成绩单如何办理
一比一原版SDSU毕业证圣地亚哥州立大学毕业证成绩单如何办理一比一原版SDSU毕业证圣地亚哥州立大学毕业证成绩单如何办理
一比一原版SDSU毕业证圣地亚哥州立大学毕业证成绩单如何办理
psavhef
 
一比一原版BC毕业证波士顿学院毕业证成绩单如何办理
一比一原版BC毕业证波士顿学院毕业证成绩单如何办理一比一原版BC毕业证波士顿学院毕业证成绩单如何办理
一比一原版BC毕业证波士顿学院毕业证成绩单如何办理
amvovau
 

Recently uploaded (10)

Wondering if Your Mercedes EIS is at Fault Here’s How to Tell
Wondering if Your Mercedes EIS is at Fault Here’s How to TellWondering if Your Mercedes EIS is at Fault Here’s How to Tell
Wondering if Your Mercedes EIS is at Fault Here’s How to Tell
 
Advanced Technology for Auto Part Industry Inventory Solutions
Advanced Technology for Auto Part Industry Inventory SolutionsAdvanced Technology for Auto Part Industry Inventory Solutions
Advanced Technology for Auto Part Industry Inventory Solutions
 
Why Isn't Your BMW X5's Comfort Access Functioning Properly Find Out Here
Why Isn't Your BMW X5's Comfort Access Functioning Properly Find Out HereWhy Isn't Your BMW X5's Comfort Access Functioning Properly Find Out Here
Why Isn't Your BMW X5's Comfort Access Functioning Properly Find Out Here
 
Tyre Industrymarket overview with examples of CEAT
Tyre Industrymarket overview with examples of CEATTyre Industrymarket overview with examples of CEAT
Tyre Industrymarket overview with examples of CEAT
 
Essential Maintenance Tips For Commercial Vans.
Essential Maintenance Tips For Commercial Vans.Essential Maintenance Tips For Commercial Vans.
Essential Maintenance Tips For Commercial Vans.
 
The Future of Autonomous Vehicles | civilthings.com | Detailed information
The Future of Autonomous Vehicles | civilthings.com |  Detailed informationThe Future of Autonomous Vehicles | civilthings.com |  Detailed information
The Future of Autonomous Vehicles | civilthings.com | Detailed information
 
一比一原版SDSU毕业证圣地亚哥州立大学毕业证成绩单如何办理
一比一原版SDSU毕业证圣地亚哥州立大学毕业证成绩单如何办理一比一原版SDSU毕业证圣地亚哥州立大学毕业证成绩单如何办理
一比一原版SDSU毕业证圣地亚哥州立大学毕业证成绩单如何办理
 
gtyccccccccccccccccccccccccccccccccccccccccccccccccccccccc
gtycccccccccccccccccccccccccccccccccccccccccccccccccccccccgtyccccccccccccccccccccccccccccccccccccccccccccccccccccccc
gtyccccccccccccccccccccccccccccccccccccccccccccccccccccccc
 
一比一原版BC毕业证波士顿学院毕业证成绩单如何办理
一比一原版BC毕业证波士顿学院毕业证成绩单如何办理一比一原版BC毕业证波士顿学院毕业证成绩单如何办理
一比一原版BC毕业证波士顿学院毕业证成绩单如何办理
 
Core technology of Hyundai Motor Group's EV platform 'E-GMP'
Core technology of Hyundai Motor Group's EV platform 'E-GMP'Core technology of Hyundai Motor Group's EV platform 'E-GMP'
Core technology of Hyundai Motor Group's EV platform 'E-GMP'
 

Causeeffect

  • 1. Cause-and-Effect Diagrams CAUSE-AND-EFFECT DIAGRAMS What A Cause-and-Effect (Fishbone or Ishikawa) Diagram is a picture composed of lines and symbols designed to represent a meaningful relationship between an effect and its causes. Cause-and-Effect Diagrams are used to investigate either a “bad” effect and thus correct its causes or a “good” effect and thus learn how to continue doing things in a way that produces good products or service. Cause-and-Effect Diagrams are designed to portray complex situations so that they may be better understood and to analyze causes of poor or bad service so that corrective action can be taken. Causes contributing to the effects are categorized and assigned to major branches of the diagram. For every effect there are likely to be several major categories of causes. Frequently these fall into such categories as those related to: • Machines or Equipment • Methods/Procedures/Technique • People/Crew/Team • Materials/Component/Ingredient • Measurements or Metrics • Environment/Climate/Atmosphere There can be many other ways to categorize the major causes, depending on the problem or outcome being studied. Each of the major causes will, in turn, have numerous minor causes or factors. The Cause-and-Effect tool provides a visual display of the sequence and relationships of the causes—organized into major categories—which contribute to a problem. When Use this tool in a group when you need to identify the possible causes of a problem and how the causes interact. Restructuring Associates Inc. © 2008 1
  • 2. Cause-and-Effect Diagrams How • Gather people that have knowledge of, or experience with, the effect you are studying as well as the processes that produce them. Try to get a diversified group so that different perspectives are represented. • Write a summary statement of the problem in a box on the right of the chart with an arrow across the chart pointing to it. • Brainstorm the causes of the problem. Everyone should contribute ideas about possible causes. Remember, list only causes; avoid stating implied solutions such as “lack of something” where something will fix the problem. The facilitator writes down the causes as they are suggested. • Add categories of causes to the diagram by drawing arrows to the main stem of the diagram and labeling them with the categories. Three to five causes are most common. Categories will vary depending on the nature of the problem. Some common categories: materials, people, environment, methods, equipment, and procedures. Reach agreement on major causes of the problem. • Break down each of the categories of causes into smaller branches by placing the brainstormed items on the appropriate branch of the diagram. Draw an arrow to the larger arrow to show a cause and effect relationship, and write the brainstormed item next to the line. Some items may be causes for other items on the brainstormed list and should be drawn to show this relationship. (The arrow indicates that an item leads to or causes the item it points to.) • After all brainstormed items are placed on the diagram, analyze the diagram for underlying root causes. Repeatedly ask "Why?" each item occurs and draw additional arrows to show causes. • Rank or prioritize the causes for further study. Pick several that the group thinks have the greatest impact on the problem or offer the best opportunity for improvement. Follow up with further study. • If necessary, assign team members to collect data to clarify what is causing the problem. 2 Restructuring Associates, Inc. © 2008
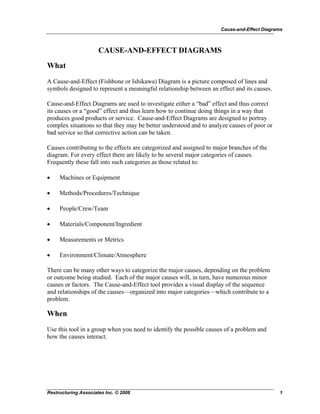
  • 3. Cause-and-Effect Diagrams CAUSE-AND-EFFECT DIAGRAM Car Won't Start Mechanical Operator Electrical Fuel System Steering Wheel Locked Motor Frozen Bad Starter Over Heated No Oil Flooded Engine Not in Park Or Neutral Wrong Key Can't Turn Key Battery Loose Connection Corrosion Starter Connection Cracked Plug Wi Loose Vapor Lock Bad Fuel Pump No Gas Water In Fuel Ice Broken Fuel Line Restructuring Associates Inc. © 2008 3