Downloaded 117 times


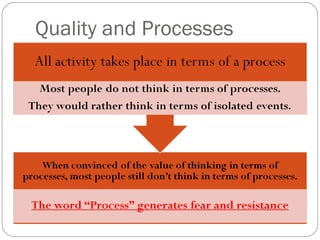

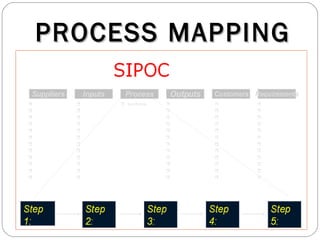


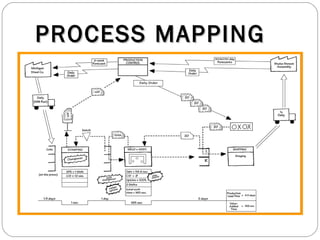
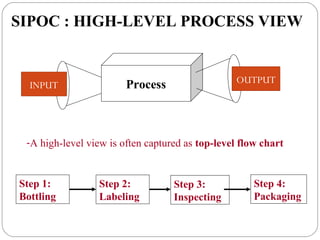


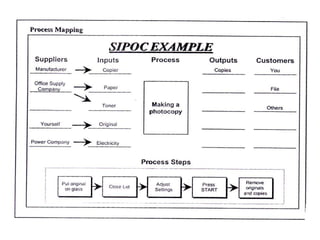


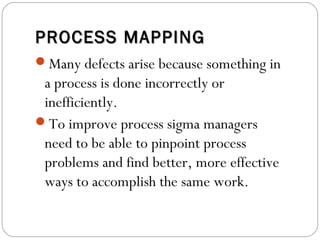


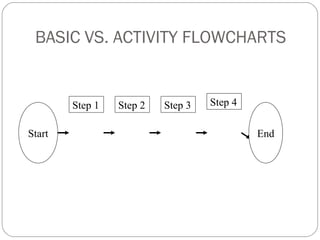


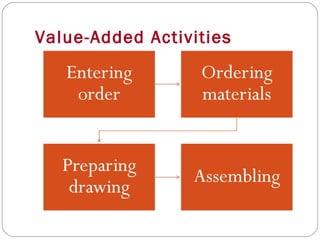


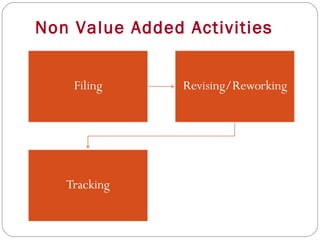
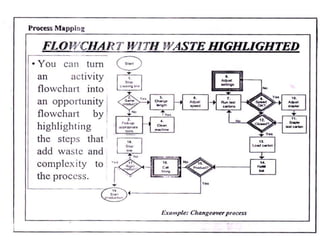


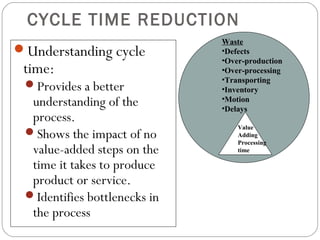


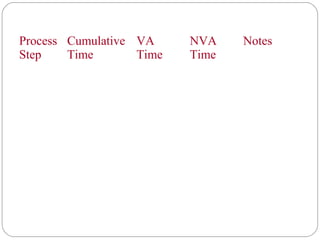


This document discusses quality improvement through process mapping and analysis. It explains that quality is judged based on process output, not individual worker performance. To improve quality, the process itself must be improved. Simply defining a process is not enough - management must make changes and use data to demonstrate improvements. The document then describes process mapping techniques like SIPOC, flowcharts, identifying value-added vs. non-value added steps, measuring cycle time, and bottlenecks.