Downloaded 508 times


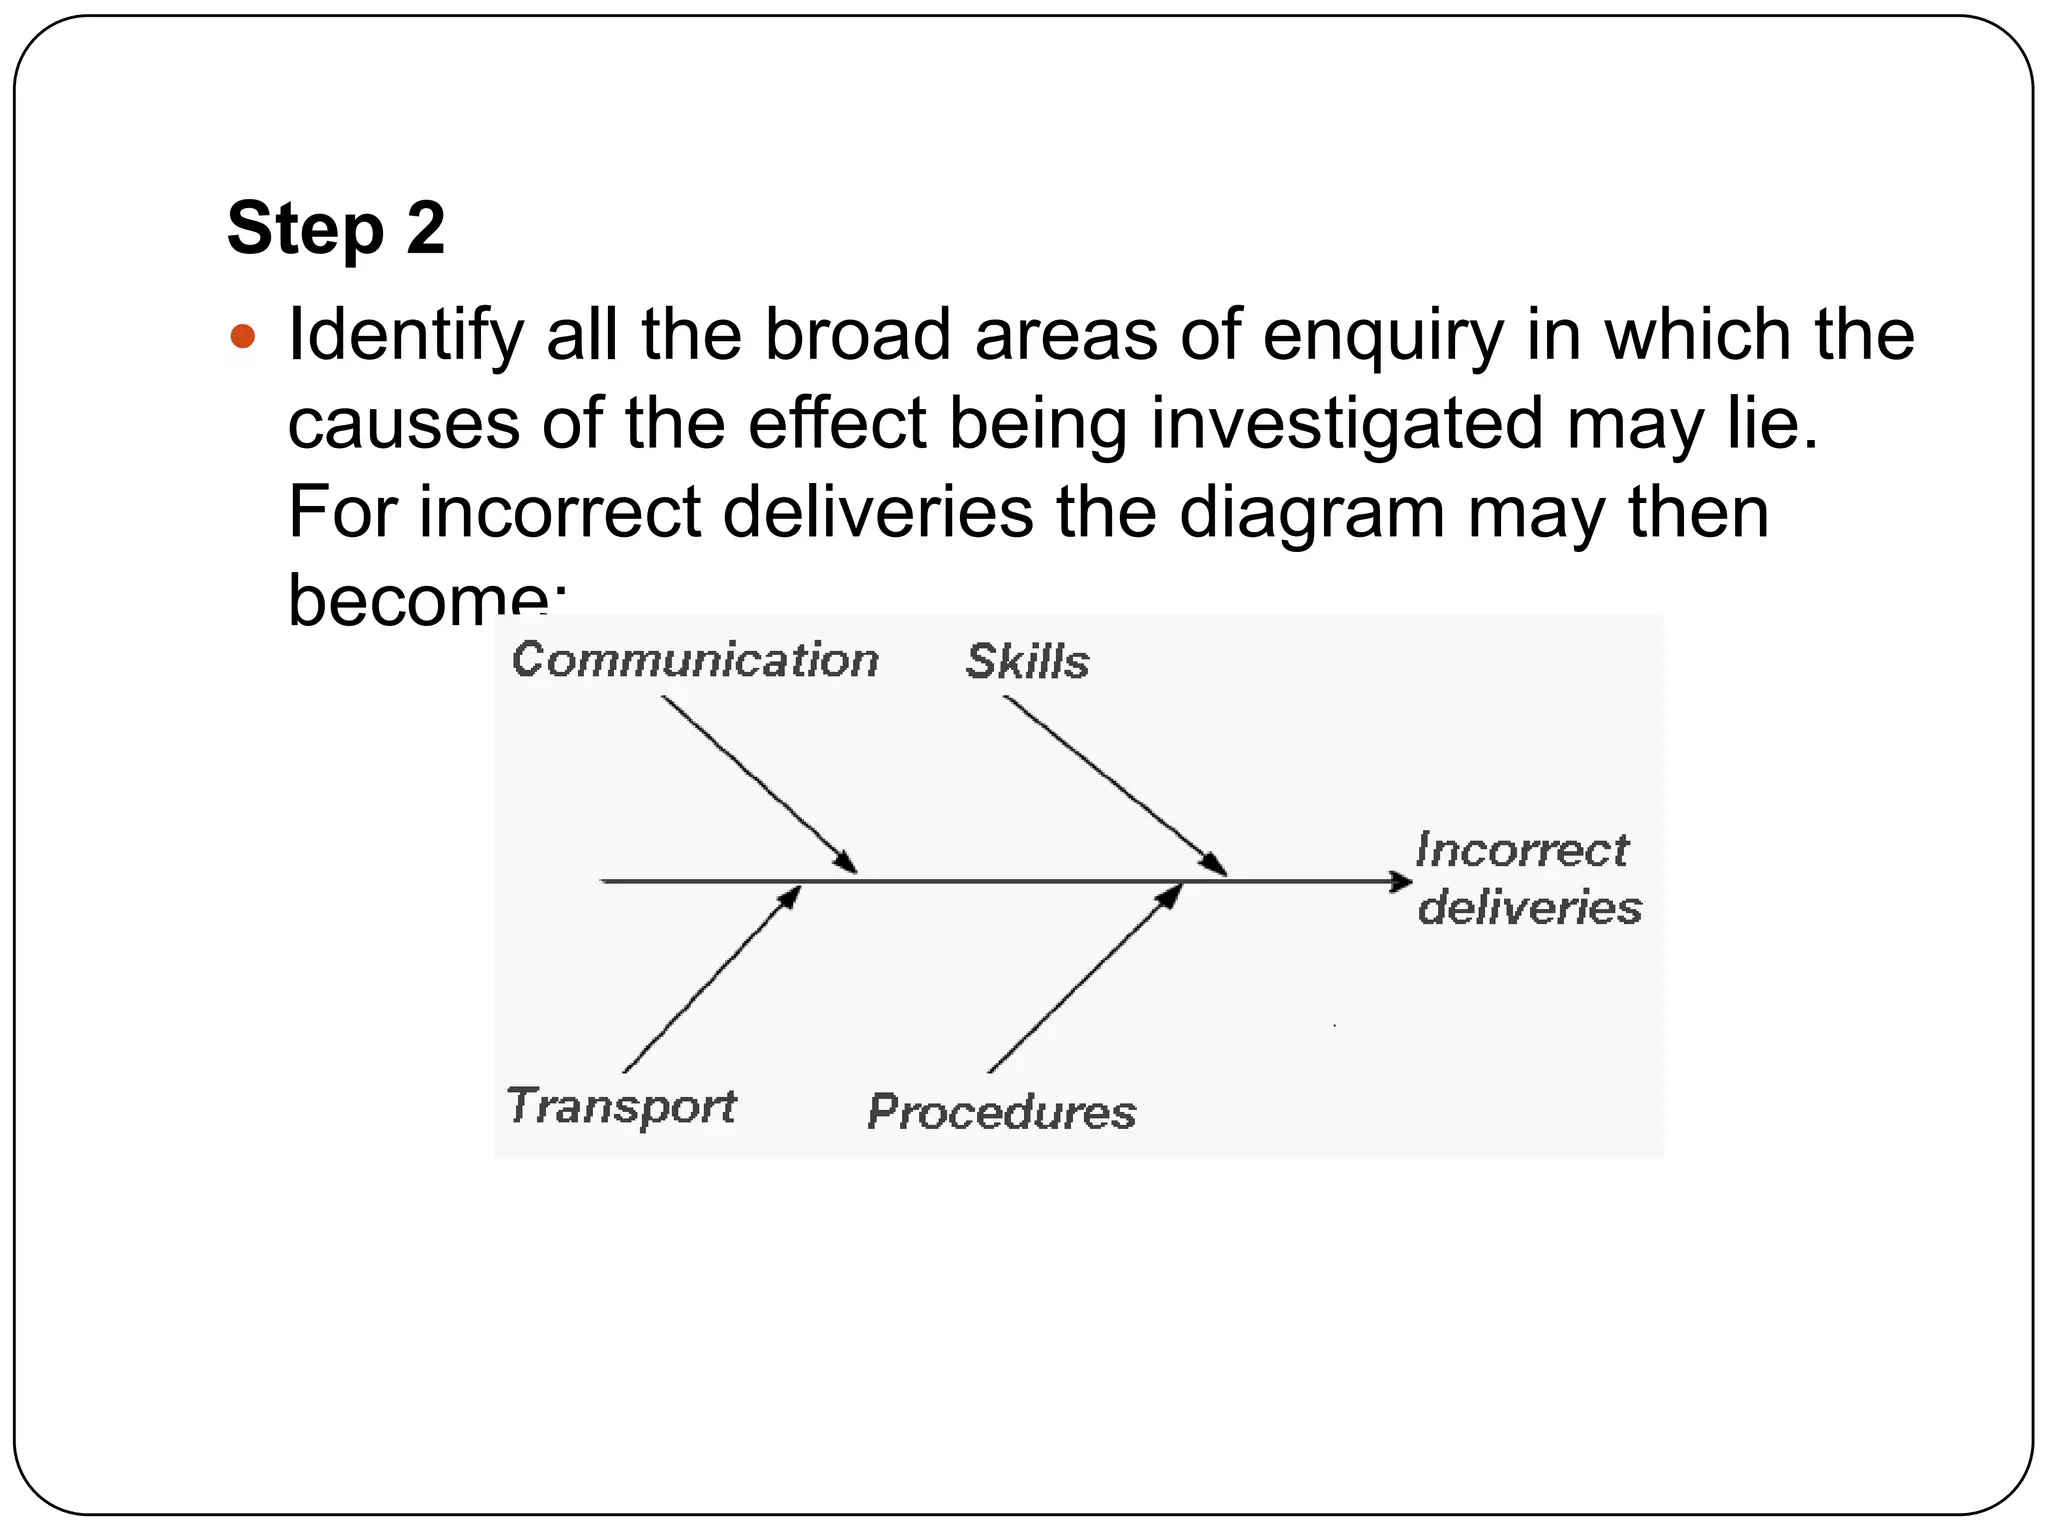


The cause and effect diagram, also known as a fishbone diagram or Ishikawa diagram, was invented in 1943 by Kaoru Ishikawa to help identify potential causes for a problem. It maps out causes in categories related to a problem or effect. The major purpose is to generate a comprehensive list of possible causes through brainstorming to help understand and solve problems. To create one, the effect is written and main categories of causes are connected. Then detailed potential causes are added as branches in each category. Variations include diagrams for production processes or listing causes before structuring them in the diagram.


![7 qc tools training material[1]](https://cdn.slidesharecdn.com/ss_thumbnails/7qctoolstrainingmaterial1-120925054558-phpapp02-thumbnail.jpg?width=640&height=640&fit=bounds)


![Qcl 14-v3 [cause effect diagram-poor placement of students]-[banasthali unive...](https://cdn.slidesharecdn.com/ss_thumbnails/qcl-14-v3causeeffectdiagram-poorplacementofstudentsbanasthaliuniversityanshuverma-150110071924-conversion-gate01-thumbnail.jpg?width=640&height=640&fit=bounds)


![Qcl 14-v3 [cause-effect diagram]-[parinita dwivedi]_[banasthali university]](https://cdn.slidesharecdn.com/ss_thumbnails/qcl-14-v3cause-effectdiagramparinitadwivedibanasthaliuniversity-150117081348-conversion-gate02-thumbnail.jpg?width=640&height=640&fit=bounds)


![Qcl 15-v4 [3]-[banasthali university]_[prabh simran kaur]](https://cdn.slidesharecdn.com/ss_thumbnails/qcl-14-v3cause-effectdiagrampoorplacementbanasthaliuniversityprabhsimrankaur-150113031047-conversion-gate01-thumbnail.jpg?width=640&height=640&fit=bounds)


![QCL- 14-v3 _[cause and effect diag]_[banasthali vidyapith]_[monikakumari]](https://cdn.slidesharecdn.com/ss_thumbnails/qcl-14-v3causeandeffectdiagbanasthaliunivmonikakumari-150119083542-conversion-gate02-thumbnail.jpg?width=640&height=640&fit=bounds)


