Downloaded 397 times


![656
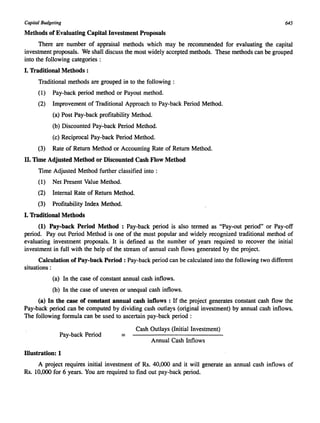
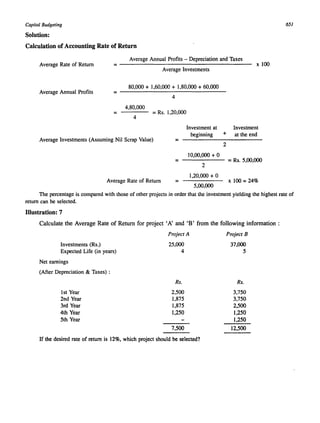
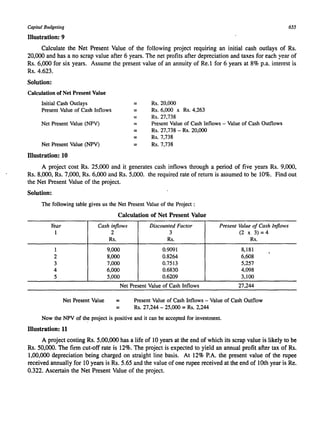
Solution:
A Textbook of Financial Cost and Management Accounting
Calculation of Net Present Value:
Annual Profit after Tax
[
Rs. 5,00,000 ]
Add : Depreciation 5
Cash flows after tax (for year 1 to 10)
Present value factor for 10 years}
at 1~ % - 5.65
Total Present Value (1,50,000 x 5.65)
Cash flow in 10th year (scrap value) 50,000 }
Present value factor in 10th years 0.322
(50,000 x 0.322)
Present value of cash inflow in 10th year
Less: Present value of cash outflows
Net Present Value (NPV) =
Rs.
1,00,000
50,000
1,50,000
8,47,500
16,100
8,63,600
5,00,000
3,63,600
Now the Net Present Value of the project is positive and it can be accepted for investment.
Illustration: 12
MIs. Pandey Ltd. is contemplating to purchase a machine A and B each costing of Rs.5,OO,OOO.
Profits before depreciation are expected as follows :
Year Cash Inflows Discounted Factor
1 Machine A Machine B 10%
Rs. Rs.
1 1,50,000 50,000 0.9092
2 2,00,000 1,50,000 0.8264
3 2,50,000 2,00,000 0.7513
4 1,50,000 3,00,000 0.6830
5 1,00,000 2,00,000 0.6209
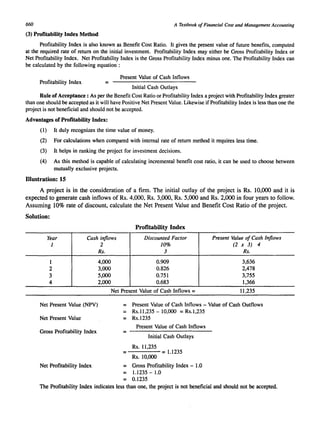
Using a 10% discounted rate indicate which of the machine would be profitable using the Net Present Value
(NPV) method.
Solution:
Year Discounted Machine A Machine B
1 Factor 10% Cash Flow Present Value Cash Flow Present Value
Rs. Rs. Rs. Rs.
0 1.0000 (-)5,00,000 (-)5,00,000 (-)5,00,000 (-)5,00,000
1 0.9091 1,50,000 1,36,365 50,000 45,455
2 0.8264 2,00,000 1,65,280 1,50,000 1.23,960
3 0.7513 2,50,000 1,87,825 2,00,000 1,50,260
4 0.6830 1,50,000 1,02,450 3,00,000 2,04,900
5 0.6209 1,00,000 62,090 2,00,000 1,24,180
8,50,000 6,54,010 9,00,000 6,48,755](https://image.slidesharecdn.com/90088162141chapter29capitalbudgeting-141008112616-conversion-gate01/85/capital_budgeting-15-320.jpg)
![Capital Budgeting
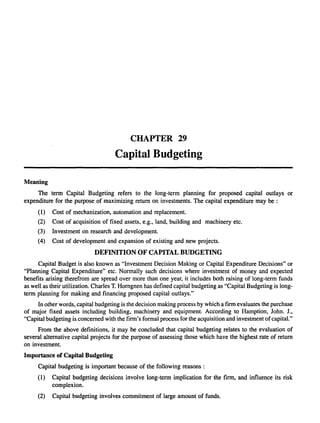
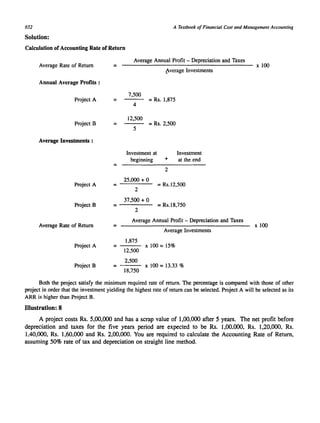
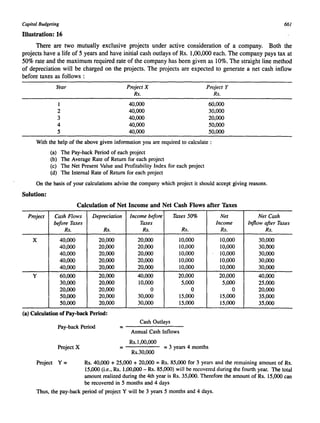
Total Present Value
Less : Cash Outlays
Net Present Value (NPV)
Profitability Index
=
Rs.I,17,670 = = 1.177
Rs.l,OO,OOO
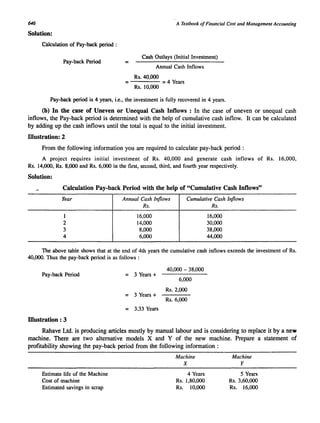
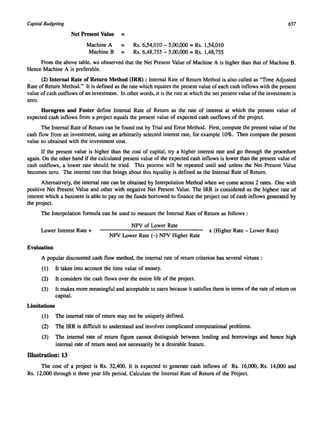
(d) Calculation of Internal Rate of Return (IRR):
1,17,670
1,00,000
17,670
663
IRR is the rate which when applied to discount the cash flow makes the Net Present Value equal to zero. So IRR
of the project X will be :
Project X : There is constant cash inflow of Rs. 30,000 for 5 years. The nearest discount factor for this flow can
be obtained by dividing the cash outlays of Rs. 1,00,000 by Rs. 30,000 which comes to 3.33
(Le., Rs. 1,00,000 + Rs. 30,000).
Referring to the present value of annuity table in the annexure (Table A - 4). We find that the nearest discount
factor on the 5 year row is 3.352 which corresponds to a discount rate of 15%. But since 3.333 is lower than 3.352,
the actual rate should be between 15% and 16%. To obtain the actual rate of discount, the interpretation will be done
as follows:
Present value required
Present value at 15% for }
Rs.30,ooo (Le., 3.352 x 30,000)
Present value @ 16 % for }
Rs.30,ooo (Le., 3274 x 30,000)
The actual rate of discount in this way will be :
= 15%=[t%X
Rs. 1,00,000
1,00,560
98,220
560 ]
2,340
= 15% + 0.24 = 15.24%
Differences
Rs.560 }
Rs.2,340
1%
Project Y : In the case of project Y the cash inflow stream is uneven and so the trial and error'method wiII be
used to find out the actual rate of discount.
Let us begin with 16% rate of discount. The present value will be
Cash Flow
1
Rs.
40,000
25,000
20,000
35,000
35,000
Present Value
Factor at 16%
2
0.862
0.743
0.641
0.552
0.476
Total Present Value =
Present Value
(1 x 2) = 3
Rs.
34,480
18,580
12,820
19,320
16,660
Rs. 1,01,860
So the total present value is higher than the cash outlay, therefore to make it equal to Rs. 1,00,000, higher rate
of discount should be used. Therefore let us calculate the present value at 18% discount rate which read as follows:](https://image.slidesharecdn.com/90088162141chapter29capitalbudgeting-141008112616-conversion-gate01/85/capital_budgeting-22-320.jpg)
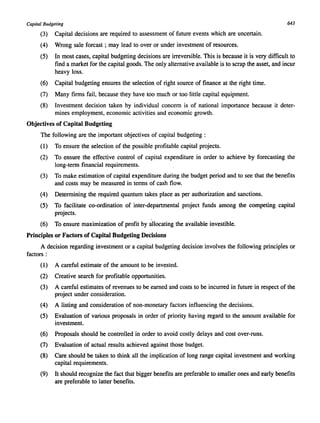
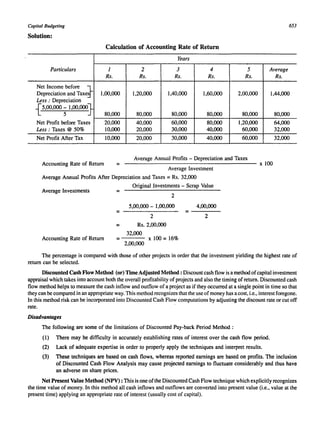
![666
Year
1
2
3
4
5
Project A
30,000
30,000
30,000
30,000
30,000
Cash Inflows
A Textbook of Financial Cost and Managemelll Accoullling
Project B
30,000
40,000
20,000
10,000
5,000
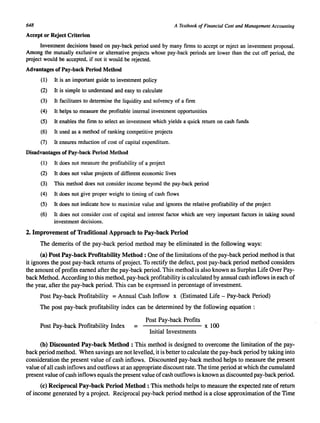
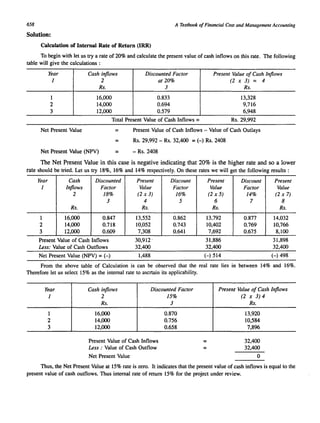
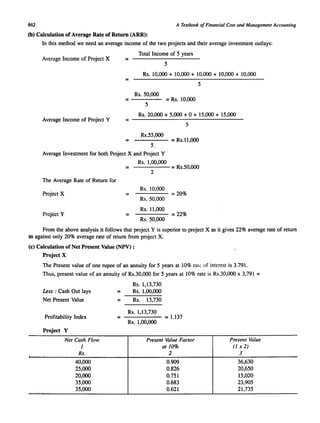
[Ans : Pay-back period: Project A - 3.33 years, Project B - 4 years. Both Project A and Project B are acceptable]
(2) From the following data calculate: (1) Net Present Value (2) Internal Rate of Return and (3) Pay-back Period for the
following projects. Assume a required rate of return of 10% and a 50% tax rate. Firm has a policy of charging depreciation on
diminishing balance method. No capital gain taxes are assumed:
M N
Initial Cash outlay Rs. 1,00,000 Rs. 1,40,000
Salvage Value Nil 20,000
Earning before Depreciation and Taxes :
Year
1 25,000 40,000
2 25,000 40,000
3 25,000 40,000
4 25,000 40,000
5 25,000 40,000
Expected Life 5 years 5 years
(3) A company has to choose one of the following mutually exclusive projects. Both the projects will be depreciated on a
straight line basis. The firm's cost of capital is 10% and the tax rate is 50%. The before tax cash flows are:
(4)
0 J 2 3 4 5
X - Rs. 20,0004,200 4,800 7,000 8,000 2,000
Y - Rs. 15,0004,200 4,500 4,000 5,000 1,000
Which project should the firm accept, if the following criteria are used?
(a) Pay-back Period (b) Internal Rate of Return
(c) Net Present Value (d) Profitability Index
The cash flow streams for four alternative investment A, B, C, and Dare:
Year A B C
0 2,00,000 3,00,000 2,10,000
I 40,000 40,000 80,000
2 40,000 40,000 60,000
3 40,000 40,000 80,000
4 40,000 40,000 60,000
5 40,000 40,000 80,000
6 40,000 30,000 60,000
7 40,000 30,000 40,000
8 40,000 20,000 40,000
9 40,000 20,000 40,000
10 40,.QOO 20,000 40,000
Calculate the (a) Pay-back Period (b) Net Present Value
(d) Profitability Index.
D
3,20,000
2,00,000
20,000
2,00,000
50,000
(c) Internal Rate of Return and
(5) Atlanda Footwear is considering the purchase of a new leather stitching machine to replace an existing machine. The
existing machine has a book value of Rs. 20,000 and a salvage value of Rs. 30,000. It can be used for 5 more years at the end of which
its salvage value would be nil. The new machine cost Rs. 80,000. It is expected to bring an annual saving of Rs. 30,000 in operating
costs. The depreciation rate on both the machines will be 33 113 % on the written down value method. The new machine will fetch a
salvage value of Rs.50,OOO after 5 years. The tax rate for the firm is 60%.
What is the Internal Rate of Return of the replacement proposal?
(6) AVS Ltd is considering the purchase of a new machine for Rs. 1,20,000. It has a life of 4 years and an estimated scrap
value of Rs. 20,000. The machine will generate an extra revenue of Rs. 4,00,000 P.A. and have additional operating cost of Rs.
3,20,000 P.A. The company cost of capital is 20% and tax rate 50%. Should the machine be purchased?
[Ans : Yes, NPV Rs. 23,486]](https://image.slidesharecdn.com/90088162141chapter29capitalbudgeting-141008112616-conversion-gate01/85/capital_budgeting-25-320.jpg)
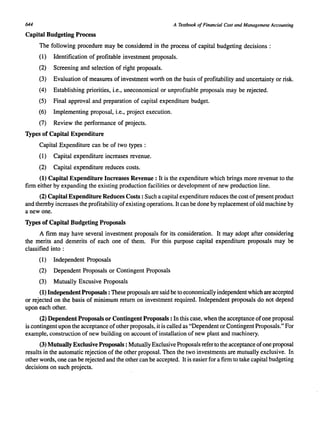
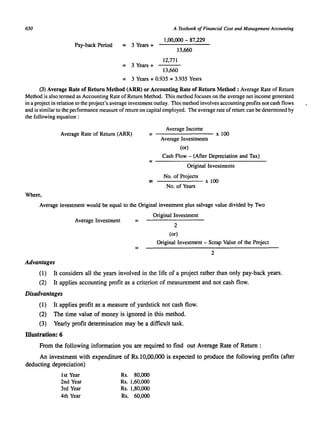
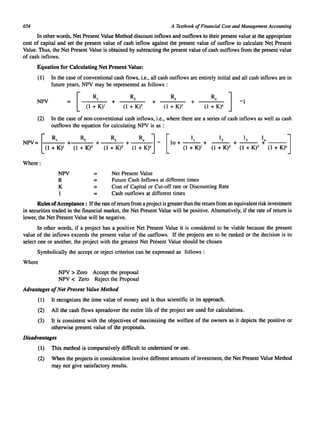
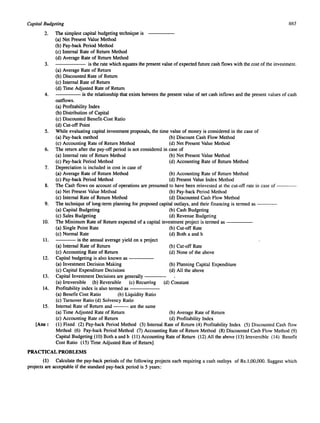
![Capital Budgeting 667
(7) William & Co. has to choose one of the two alternative machines. Calculate the Pay-back Period and suggest the
profitable machine;
Machine X Machine Y
Cost of Machine Rs. 2,00,000 2,50,000
Working Life years 5 5
Profit before tax :
1st Year 60,000 80,000
2nd Year 70,000 1,00,000
3rd Year 80,000 80,000
4th Year 60,000 70,000
5th Year 40,000 60,000
Rate of Income Tax 50% 50%
[Ans : Pay-back period, Machine x - 2.69 years, Y - 2.67 years, Machine y is better]
(8) Following data relate to five independent investment projects :
Projects Initial Outlay Annual Cash Inflows
P 10,00,000 2,50,000
Q 2,40,000 24,000
R 1,84,000 30,000
S 11,500 4,000
T 80,000 12,000
Life in Years
8
15
20
5
10
Assume a 10% required rate of return and a 50% tax rate. Rank these five investment projects according to each of the
following criteria :
(1) Pay-back Period
(2) Accounting Rate of Return
(3) Net Present Value Index
(4) Internal Rate of Return
(9) X Y Z Ltd. Company is considering the purchase of a machine. Two machines P and Q, each costing Rs.50,ooO, are
available. Earning after taxes are expected to be as under:
Year Machine Machine Discount Factor
P Q at /0%
Rs. Rs. Rs.
I 15,000 5,000 0.9091
2 20,000 15,000 0.8264
3 25,000 20,000 0.7513
4 15,000 30,000 0.6830
5 10,000 20,000 0.6209
Evaluate the two alternatives according to NPV method (a discount of 10% is to be used). Which machine should be
selected? Why?
[Ans: Pay-back period P - 2'6 years; Q - 3.33 years; NPV - P - Rs. 15,385; Q 14,865; profitability Index - P - 1,308; Q
- 1,297; P is better.)
(10) (a) A project of Rs. 40,00,000 yielded annually a profit of Rs. 6,00,000 after depreciation) 12~% and is subject to
income tax @ 50%, you are required to calculate pay-back period. (b) No-Project is acceptable unless the yield is 10% cash inflow~
of a certain project along with cash outflows are given below:
Year Outflows
Rs.
o
3,00,000
I
60,000
2
3
4
5
You are required to calculate Net-Present value
[Ans : (a) Pay-back period 5 years. (b) Net present value 17,772.]
Inflows
Rs.
40,000
60,000
1,20,000
1,60,000
60,000
80,000 (being salvage value
at the end of 5 years)](https://image.slidesharecdn.com/90088162141chapter29capitalbudgeting-141008112616-conversion-gate01/85/capital_budgeting-26-320.jpg)
![668 A Textbook of Financial Cost and Management Accounting
(11) SS & Co. Ltd. is considering investing in a project requiring a capital outlay of Rs. 2,00,000. Forecast for annual
income after deprecialion but before tax is as follows :
Year Rs.
1 1,00,000
2 1,00,000
3 8,0000
4 80,000
5 40,000
Depreciation may be taken as 20% on original cost and taxation at 50% of net income. You are required to evaluate the
project according to each of the following methods :
a) Pay-back method
b) Rate of Return on Original Investment method
c) Discounted Cash Flow Method taking cost of capital as 10%
d) Net Present Value Index Method and
e) Internal Rate of Return Method
[Ans : (a) Pay-back period is 2.25 years
(b) Rate of return on original investment Method 20%
(c) Rate of return on average investment method 40%
(d) Discounted cash flow method Rs. 1.08,130
(e) Net present value index 154%
(f) Internal rate of return method 2.5]
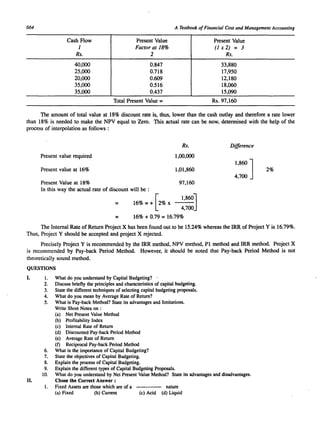
(12) AVS & Co. Ltd. is contemplating the purchase of machine. Two machines P and Q are available; each machine costing
Rs. 5,00,000. In comparing the profitability of the machines, a discount rate of 10% is to be used. Earnings after taxation are expected
to be as under :
Year
1
2
3
4
5
Machine P
Rs.
1,50,000
2,00,000
2,50,000
1,50,000
1,00,000
Cashjlow
Machine Q
Rs.
50,000
1,50,000
2,00,000
3,00,000
2,00,000
Indicate which machine would be more profitable investment using the various methods of ranking investment
proposals.
[Ans: (I) Pay-back period P - 2 'Is years, Q - 3 '/' years; machine P is better.
(2) Return on Investment method
Machine P - 28% : Q - 32%; Machine Q is better
(3) Net Present Value method
Machine P - Rs 1,53,850; Q - Rs. 1,48,650; Machine P is better.)
(13) The life of a machine which costs Rs. 1,20.000 is estimated 5 years. Its salvage value is estimated at Rs. 20,000 at the
end of the fifth year. The earnings after taxes (before depreciation) are estimated as given below;
Year Rs.
1
2
3
4
5
Calculate: (a) Rate of Return on Original Investments
(b) Earnings per (Rupee) unit of investment
(c) Average Rate of Return on Original Investments
(d) Average Rate of Return on Average Investments
[Ans: (a) 158% (b) Rs. 158% (c) 31%
10,000
60,000
90,000
80,000
70,000
(d) 76%]](https://image.slidesharecdn.com/90088162141chapter29capitalbudgeting-141008112616-conversion-gate01/85/capital_budgeting-27-320.jpg)
![Capital Budgeting 669
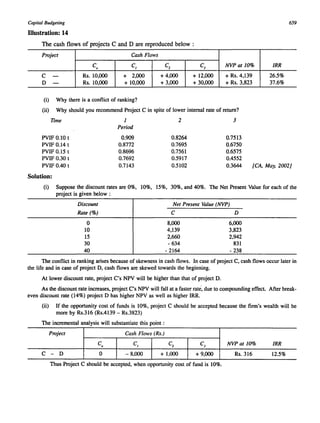
(14) A company has an investment opportunity cashing Rs. 40,000 with the following expected net cash flow (Le., after tax
and before deprecation) :
Year
1
2
3
4
5
6
7
8
9
10
Net· cash flow Rs.
7,000
7,000
7,000
7,000
7,000
8,000
10,000
15,000
10,000
4,000
Using 10% as the cost of capital (rate of discount) determine the following:
(a) Pay-back period
(b) Net present value at 10% discounting factor
(c) Profitability Index at 10% discounting factor
(d) Internal rate of return with the help of 10% discounting factor and 15% discounting factor
[Ans: (a) 5.62 years (b) Rs. 8,961 (c) 1.22 (d) 14.70%]
(IS) Calculate the Pay-back period, Average Rate of Return and Net Present Value for a Project which requires an initial
outlays of Rs. 10,000 and generates year ending cash flows of Rs. 6,000; Rs. 3,000; Rs. 2,000 and Rs. 5,000; and Rs.
5,000 from the end of the first year to the end of fifth year. The required rate of return is 10% and pays tax at 50% rate.
The project has a life of five years and depredated on straight line basis:
Year
1
2
3
4
5
Discounting factor at /0%
0.909
0.826
0.751
0.683
0.621
[Ans: Pay-back period - 3.43 years; ARR - 22%; NPV - 1,768].
000](https://image.slidesharecdn.com/90088162141chapter29capitalbudgeting-141008112616-conversion-gate01/85/capital_budgeting-28-320.jpg)

Capital budgeting refers to the long-term planning process used to evaluate proposed major investments and capital expenditures. It involves evaluating potential capital projects and determining which projects to invest in. The key methods used to evaluate projects include payback period, net present value, internal rate of return, and profitability index. Payback period is a simple and widely used traditional method that measures the time required for the cash inflows from a project to repay the initial cash outlay. However, it ignores cash flows beyond the payback period. More sophisticated discounted cash flow methods like net present value and internal rate of return are better as they consider the timing of all cash flows and investment cost of capital.