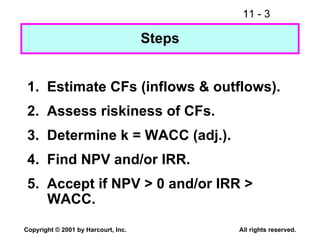
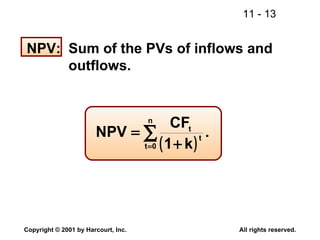
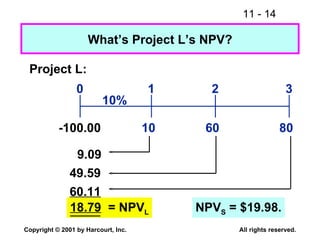
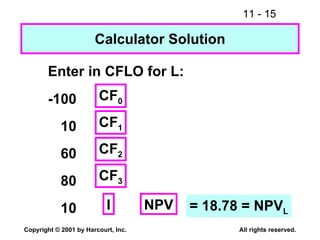
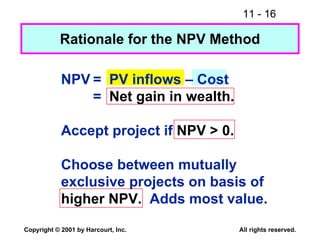
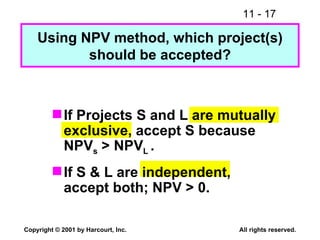
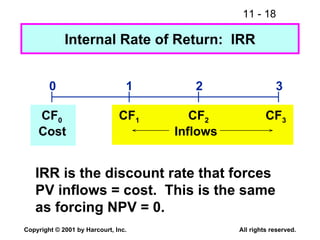
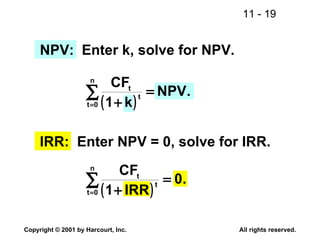
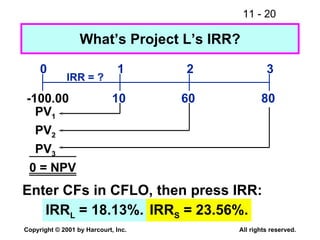
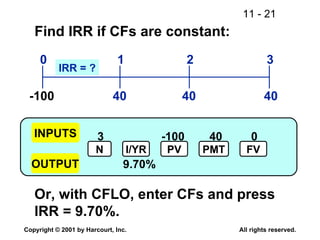
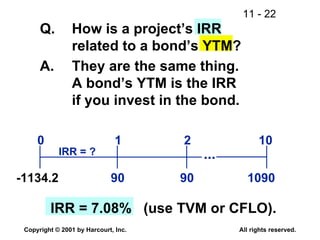
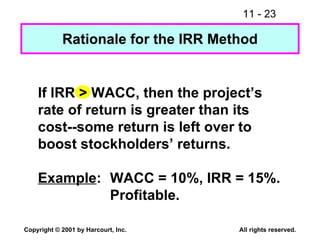
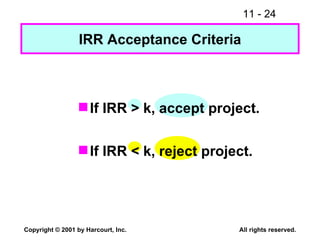
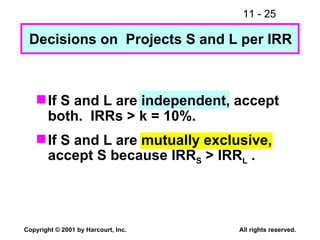
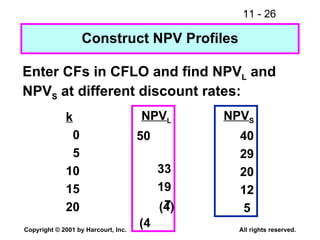
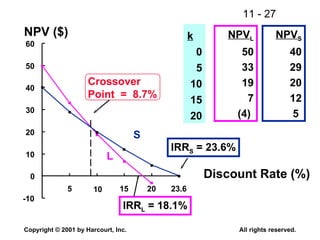
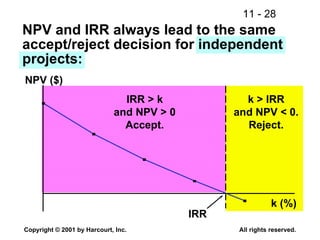
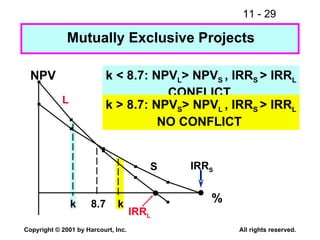
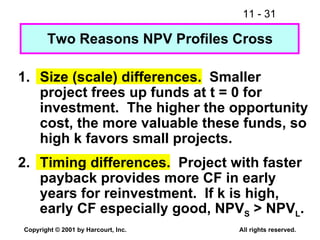
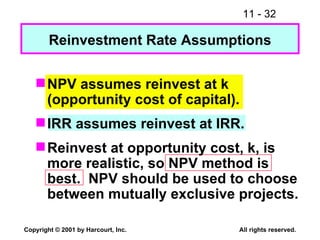
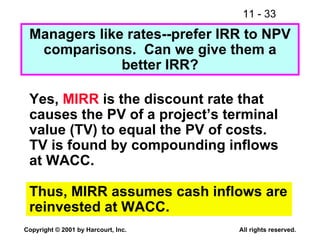
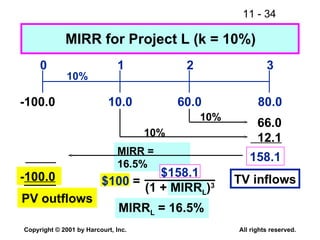
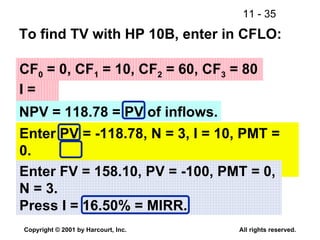
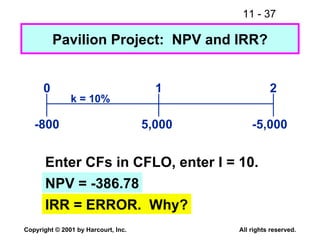
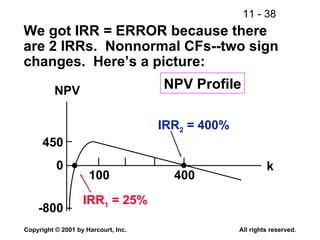
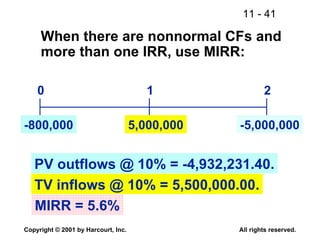
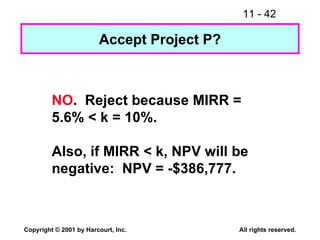
The document discusses capital budgeting and methods for evaluating investment projects such as net present value (NPV) and internal rate of return (IRR). It explains that NPV is the best method for choosing between mutually exclusive projects as it accounts for the time value of money and assumes cash flows are reinvested at the opportunity cost of capital. The document also introduces the modified internal rate of return (MIRR) as an alternative to IRR that makes the same reinvestment rate assumption as NPV.
Capital Budgeting is about how one should evaluate the financing options based on the superior financial performance through mathematical techniques. These techniques have been discussed in the presentation in detail.
ChapterTool KitChapter 10112018 The Basics of Capital BudgetingJinElias52
ChapterTool KitChapter 1011/20/18 The Basics of Capital Budgeting: Evaluating Cash Flows10-1 An Overview of Capital BudgetingCapital budgeting is the process of analyzing projects and deciding which ones to accept.10-2 The First Step in Project AnalysisThe capital budgeting process begins with estimating a project's expected cash flows. We explain this in the next chapter.The next step is to put the estimated cash flows and other inputs (primarily the project's cost of capital) on a time line, as shown below. The figure below also reports evaluation measures, which we explain in the next sections.Figure 10-1Cash Flows and Selected Evaluation Measures for Projects S and L (Millions of Dollars)Panel A: Inputs for Project Cash Flows and Cost of Capital, rINPUTS:r =10%Initial Cost and Expected Cash FlowsYear01234Project S−$10,000$5,300$4,300$1,874$1,500Project L−$10,000$1,600$2,364$2,469$8,400Panel B: Summary of Selected Evaluation MeasuresProject SProject LNet present value, NPV$804.38$1,000.57Internal rate of return, IRR14.7%13.5%Modified IRR, MIRR12.1%12.7%Profitability index, PI1.081.10Payback2.213.42Discounted payback3.213.83Note: Numbers in the figure are shown as rounded values for clarity in reporting. However unrounded values are used for all calculations.10-3 Net Present Value (NPV)To calculate the NPV, we find the present value of the individual cash flows and then sum those discounted cash flows. The sum is the value the project adds to or subtracts from shareholder wealth.Figure 10-2Finding the NPV for Projects S and L (Millions of Dollars)INPUTS:r =10%Initial Cost and Expected Cash FlowsYear01234Project S−$10,000$5,300$4,300$1,874$1,5004,818←← ↵ ↓ ↓ ↓3,554← ← ← ← ← ← ←← ↵ ↓ ↓1,408← ← ← ← ← ← ← ← ← ← ← ← ←← ↵ ↓1,025← ← ← ← ← ← ← ← ← ← ← ← ← ← ← ← ← ← ←← ↵NPVS = $804Long way:
Sum the PVs of the CFs to find NPVInitial Cost and Expected Cash FlowsYear01234Project L−$10,000$1,600$2,364$2,469$8,400NPVL = $1,001Short way: Use Excel's NPV function.
=NPV(B47,C59:F59)+B59Note: Numbers in the figure are shown as rounded values for clarity in reporting. However unrounded values are used for all calculations.10-4 Internal Rate of Return (IRR)The internal rate of return is defined as the discount rate that equates the present value of a project's cash inflows to its outflows. In other words, the internal rate of return is the interest rate that forces NPV to zero. The calculation for IRR can be tedious, but Excel provides an IRR function that merely requires you to access the function and enter the array of cash flows. The IRRs for Project S and L are shown below, along with the data entry for Project S.Figure 10-3Finding the IRR for Projects S and L (Millions of Dollars)INPUTS:Initial Cost and Expected Cash FlowsYear01234Project S−$10,000$5,300$4,300$1,874$1,5004,621.33←← ↵ ↓ ↓ ↓3,269.26← ← ← ← ← ← ...
1. Should we build this plant? CHAPTER 11 The Basics of Capital Budgeting
2.
3.
4.
5. An Example of Mutually Exclusive Projects BRIDGE vs. BOAT to get products across a river.
6. Normal Cash Flow Project: Cost (negative CF) followed by a series of positive cash inflows. One change of signs. Nonnormal Cash Flow Project: Two or more changes of signs. Most common: Cost (negative CF), then string of positive CFs, then cost to close project. Nuclear power plant, strip mine.
7. Inflow (+) or Outflow (-) in Year 0 1 2 3 4 5 N NN - + + + + + N - + + + + - NN - - - + + + N + + + - - - N - + + - + - NN
8. What is the payback period? The number of years required to recover a project’s cost, or how long does it take to get our money back?
9. Payback for Project L (Long: Large CFs in later years) 10 60 0 1 2 3 -100 = CF t Cumulative -100 -90 -30 50 Payback L 2 + 30/80 = 2.375 years 0 100 2.4 80
10. Project S (Short: CFs come quickly) 70 20 50 0 1 2 3 -100 CF t Cumulative -100 -30 20 40 Payback L 1 + 30/ 50 = 1.6 years 100 0 1.6 =
11. Strengths of Payback: 1. Provides an indication of a project’s risk and liquidity. 2. Easy to calculate and understand. Weaknesses of Payback: 1. Ignores the TVM. 2. Ignores CFs occurring after the payback period.
12. Discounted Payback: Uses discounted rather than raw CFs. 10 80 60 0 1 2 3 CF t Cumulative -100 -90.91 -41.32 18.79 Discounted payback 2 + 41.32/ 60.11 = 2.7 years PVCF t -100 -100 10% 9.09 49.59 60.11 = Recover invest. + cap. costs in 2.7 years.
16. Rationale for the NPV Method NPV = PV inflows – Cost = Net gain in wealth. Accept project if NPV > 0. Choose between mutually exclusive projects on basis of higher NPV. Adds most value.
17.
18. Internal Rate of Return: IRR 0 1 2 3 CF 0 CF 1 CF 2 CF 3 Cost Inflows IRR is the discount rate that forces PV inflows = cost. This is the same as forcing NPV = 0.
19. NPV: Enter k, solve for NPV. IRR: Enter NPV = 0, solve for IRR.
20. What’s Project L’s IRR? 10 80 60 0 1 2 3 IRR = ? -100.00 PV 3 PV 2 PV 1 0 = NPV Enter CFs in CFLO, then press IRR: IRR L = 18.13%. IRR S = 23.56%.
21. 40 40 40 0 1 2 3 IRR = ? Find IRR if CFs are constant: -100 Or, with CFLO, enter CFs and press IRR = 9.70%. 3 -100 40 0 9.70% INPUTS OUTPUT N I/YR PV PMT FV
22. 90 1090 90 0 1 2 10 IRR = ? Q. How is a project’s IRR related to a bond’s YTM? A. They are the same thing. A bond’s YTM is the IRR if you invest in the bond. -1134.2 IRR = 7.08% (use TVM or CFLO). ...
23. Rationale for the IRR Method If IRR > WACC, then the project’s rate of return is greater than its cost--some return is left over to boost stockholders’ returns. Example : WACC = 10%, IRR = 15%. Profitable.
24.
25.
26. Construct NPV Profiles Enter CFs in CFLO and find NPV L and NPV S at different discount rates: k 0 5 10 15 20 NPV L 50 33 19 7 (4 NPV S 40 29 20 12 5 (4)
27. -10 0 10 20 30 40 50 60 5 10 15 20 23.6 NPV ($) Discount Rate (%) IRR L = 18.1% IRR S = 23.6% Crossover Point = 8.7% k 0 5 10 15 20 NPV L 50 33 19 7 (4) NPV S 40 29 20 12 5 S L . . . . . . . . . . .
28. NPV and IRR always lead to the same accept/reject decision for independent projects: k > IRR and NPV < 0. Reject. NPV ($) k (%) IRR IRR > k and NPV > 0 Accept.
29. Mutually Exclusive Projects k 8.7 k NPV % IRR S IRR L L S k < 8.7: NPV L > NPV S , IRR S > IRR L CONFLICT k > 8.7: NPV S > NPV L , IRR S > IRR L NO CONFLICT
30. To Find the Crossover Rate 1. Find cash flow differences between the projects. See data at beginning of the case. 2. Enter these differences in CFLO register, then press IRR. Crossover rate = 8.68%, rounded to 8.7%. 3. Can subtract S from L or vice versa, but better to have first CF negative. 4. If profiles don’t cross, one project dominates the other.
31. Two Reasons NPV Profiles Cross 1. Size (scale) differences. Smaller project frees up funds at t = 0 for investment. The higher the opportunity cost, the more valuable these funds, so high k favors small projects. 2. Timing differences. Project with faster payback provides more CF in early years for reinvestment. If k is high, early CF especially good, NPV S > NPV L .
32.
33. Managers like rates--prefer IRR to NPV comparisons. Can we give them a better IRR? Yes, MIRR is the discount rate that causes the PV of a project’s terminal value (TV) to equal the PV of costs. TV is found by compounding inflows at WACC. Thus, MIRR assumes cash inflows are reinvested at WACC.
34. MIRR = 16.5% 10.0 80.0 60.0 0 1 2 3 10% 66.0 12.1 158.1 MIRR for Project L (k = 10%) -100.0 10% 10% TV inflows - 100.0 PV outflows MIRR L = 16.5% $100 = $158.1 (1 + MIRR L ) 3
35. To find TV with HP 10B, enter in CFLO: I = 10 NPV = 118.78 = PV of inflows. Enter PV = -118.78, N = 3, I = 10, PMT = 0. Press FV = 158.10 = FV of inflows. Enter FV = 158.10, PV = -100, PMT = 0, N = 3. Press I = 16.50% = MIRR. CF 0 = 0, CF 1 = 10, CF 2 = 60, CF 3 = 80
36. Why use MIRR versus IRR? MIRR correctly assumes reinvestment at opportunity cost = WACC. MIRR also avoids the problem of multiple IRRs. Managers like rate of return comparisons, and MIRR is better for this than IRR.
37. Pavilion Project: NPV and IRR? 5,000 -5,000 0 1 2 k = 10% -800 Enter CFs in CFLO, enter I = 10. NPV = -386.78 IRR = ERROR. Why?
38. We got IRR = ERROR because there are 2 IRRs. Nonnormal CFs--two sign changes. Here’s a picture: NPV Profile 450 -800 0 400 100 IRR 2 = 400% IRR 1 = 25% k NPV
39. Logic of Multiple IRRs 1. At very low discount rates, the PV of CF 2 is large & negative, so NPV < 0. 2. At very high discount rates, the PV of both CF 1 and CF 2 are low, so CF 0 dominates and again NPV < 0. 3. In between, the discount rate hits CF 2 harder than CF 1 , so NPV > 0. 4. Result: 2 IRRs.
40. Could find IRR with calculator: 1. Enter CFs as before. 2. Enter a “guess” as to IRR by storing the guess. Try 10%: 10 STO IRR = 25% = lower IRR Now guess large IRR, say, 200: 200 STO IRR = 400% = upper IRR
41. When there are nonnormal CFs and more than one IRR, use MIRR: 0 1 2 -800,000 5,000,000 -5,000,000 PV outflows @ 10% = -4,932,231.40. TV inflows @ 10% = 5,500,000.00. MIRR = 5.6%
42. Accept Project P? NO . Reject because MIRR = 5.6% < k = 10%. Also, if MIRR < k, NPV will be negative: NPV = -$386,777.