Download as PDF, PPTX


![Procedurefordrawing the Bode MagnitudePlot:
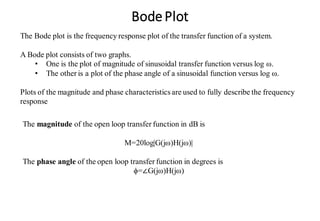
•Convert given TF into frequency domain. (Substitutes=jw in the TF)
•Mark the corner frequency on the semi-log graph paper.
•Tabulate these factors moving from top to bottom in the given sequence.
1. Constantterm K
2. Integral factor 1/(jω)n
3. First order factor (1+jωT) 1
4. Second order or quadratic factor: *{1/(1+(2ζ/ωn)}×(jω)+{(1/ωn
2)}×(jω)2)]1
•Now sketch the line with the help of the corresponding slope of the given
factor. Change the slope at every corner frequency by adding the slope of the
next factor. We will get the magnitude plot.
Procedurefordrawing the Bode Phase Plot:
1.Calculate the phase function adding all the phases of factors.
2.Substitutevarious values to the above function in order to find out the phase
at different points and plot a curve. We will get a phase curve.
• Calculate the phase margin.
• Calculate the gain margin.](https://image.slidesharecdn.com/bodeplotsdr-200420154321/85/Bode-Plots-4-320.jpg)
![Basic Factors-Summary
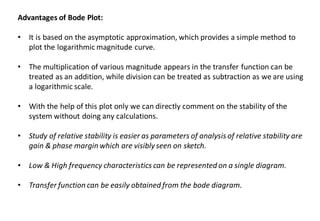
• Constant Term K: This factor has a slope of zero dB per decade. There is no corner
frequency corresponding to this constant term. The phase angle associated with this
constant term is also zero.
•Derivative factor (jω)n: This factor has a slope of 20 × n (where n is any integer) dB
per decade. There is no corner frequency corresponding to this integral factor. The
phase angle associated with this integral factor is 90 × n. (here n is also an integer).
• Integral factor 1/(jω)n: This factor has a slope of -20 × n (where n is any integer)dB
per decade. There is no corner frequency corresponding to this integral factor. The
phase angle associated with this integral factor is -90 × n. (here n is also an integer).
•First order factor (1+jωT): This factor has a slope of 20 dB per decade. The corner
frequency corresponding to this factor is 1/T radian per second. The phase angle
associated with this first factor is tan– 1(ωT).
• First order factor 1/ (1+jωT): This factor has a slope of -20 dB per decade. The
corner frequency corresponding to this factor is 1/T radian pr second. The phase angle
associated with this first factor is -tan– 1(ωT).
• Second order or quadratic factor: [{1/(1+(2ζ/ωn)}×(jω)+{(1/ωn
2)}×(jω)2)]: This
factor has a slope of -40 dB per decade. The corner frequency corresponding to this
factor is ωn radian per second. The phase angle associated with this first factor is](https://image.slidesharecdn.com/bodeplotsdr-200420154321/85/Bode-Plots-8-320.jpg)


![Bode Plot – Example1
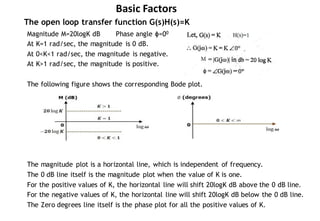
Q. Determine Gain crossover frequency (wgc), Phase crossover frequency(wpc), Gain Margin
and Phase Margin for the following T.F. using Bode plot and also determine the
stability.
G(s) = 20 / [s (1+3s) (1+4s)]
Solution: The sinusoidal T.F. of G(s) is obtained by replacing s by jw in the given T.F
G(jw) = 20/[jw(1+j3w)(1+j4w)]
Corner frequencies:
wc1= 1/4 = 0.25 rad /sec; wc2 = 1/3 = 0.33 rad /sec
Choose a lower frequency and a higher frequency
wl= 0.025 rad/sec (wl < wc1) and
wh = 3.3 rad / sec (wh > wc2)
MAGNITUDE PLOT:
Calculation of Gain (A):
A|wl: A = 20*log [20/0.025] =58.06 dB
A|wc1: A = [(Slope from wl to wc1)* log(wc1/wl)] + Gain (A)|wl
= - 20*log [0.25/0.025]+58.06 = 38.06 dB
A|wc2: A = [(Slope from wc1 to wc2)* log(wc2/wc1)]+Gain(A)|wc1
= - 40*log [0.33/0.25]+38 = 33 dB
A|wh: A = [(Slope from wc2 to wh)* log(wh/wc2)] + Gain (A)|wc2](https://image.slidesharecdn.com/bodeplotsdr-200420154321/85/Bode-Plots-12-320.jpg)
![PHASE PLOT:
Calculation of Phase angle for different values of frequencies :
G(jw) = 20/[jw(1+j3w)(1+j4w)]
= -900-tan-1(3w)–tan-1(4w)
Frequency in rad/sec Phase Angle in Degree
w = 0 = -900
w = 0.025 = -990
w = 0.25 = -1720
w = 0.33 = -1880
w = 3.3 = -2590
w = ∞ = -2700
Bode Plot – Example1](https://image.slidesharecdn.com/bodeplotsdr-200420154321/85/Bode-Plots-13-320.jpg)
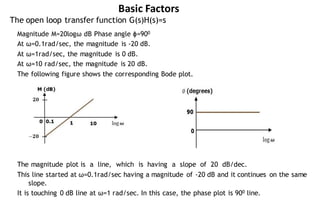
![Fig: Bode Plot for the given transfer function G(s) = 20 / [s (1+3s) (1+4s)]](https://image.slidesharecdn.com/bodeplotsdr-200420154321/85/Bode-Plots-14-320.jpg)
![Bode Plot-Example-1
Gain CrossoverFrequency
The frequencyat whichthe dB magnitudeis Zero.
wgc = 1.1 rad/sec
Phase CrossoverFrequency
The frequencyat whichthe Phase of the system is - 1800
wpc = 0.3 rad/sec
Gain Margin:The gain margin in dB is given by the negativeof dB magnitudeof G(jw) at
phase cross over frequency.
GM = - {20*log [G(jwpc)] = -32 dB
Phase Margin:
PM== 1800+ gc=1800 + (- 2400) = -600
Conclusion:
For this system GM and PM are negativein values.Thereforethe system is unstable.
StabilityAnalysis
Refer Text Book:ControlSystem Engineeringby A. Nagoor Kani](https://image.slidesharecdn.com/bodeplotsdr-200420154321/85/Bode-Plots-15-320.jpg)


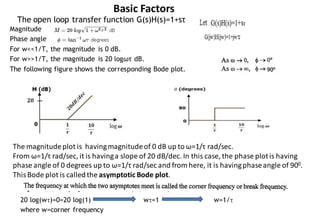
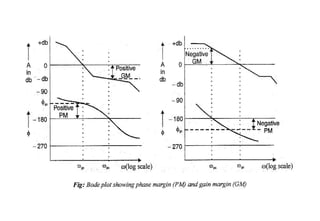
The document discusses Bode plots, which illustrate the frequency response of control systems through magnitude and phase graphs. It outlines the procedures to draw Bode plots, analyze system stability using gain and phase margins, and provides examples of calculating these parameters. Key factors affecting the plots, such as constant, first order, and second order factors, are also explained along with their implications on system stability.