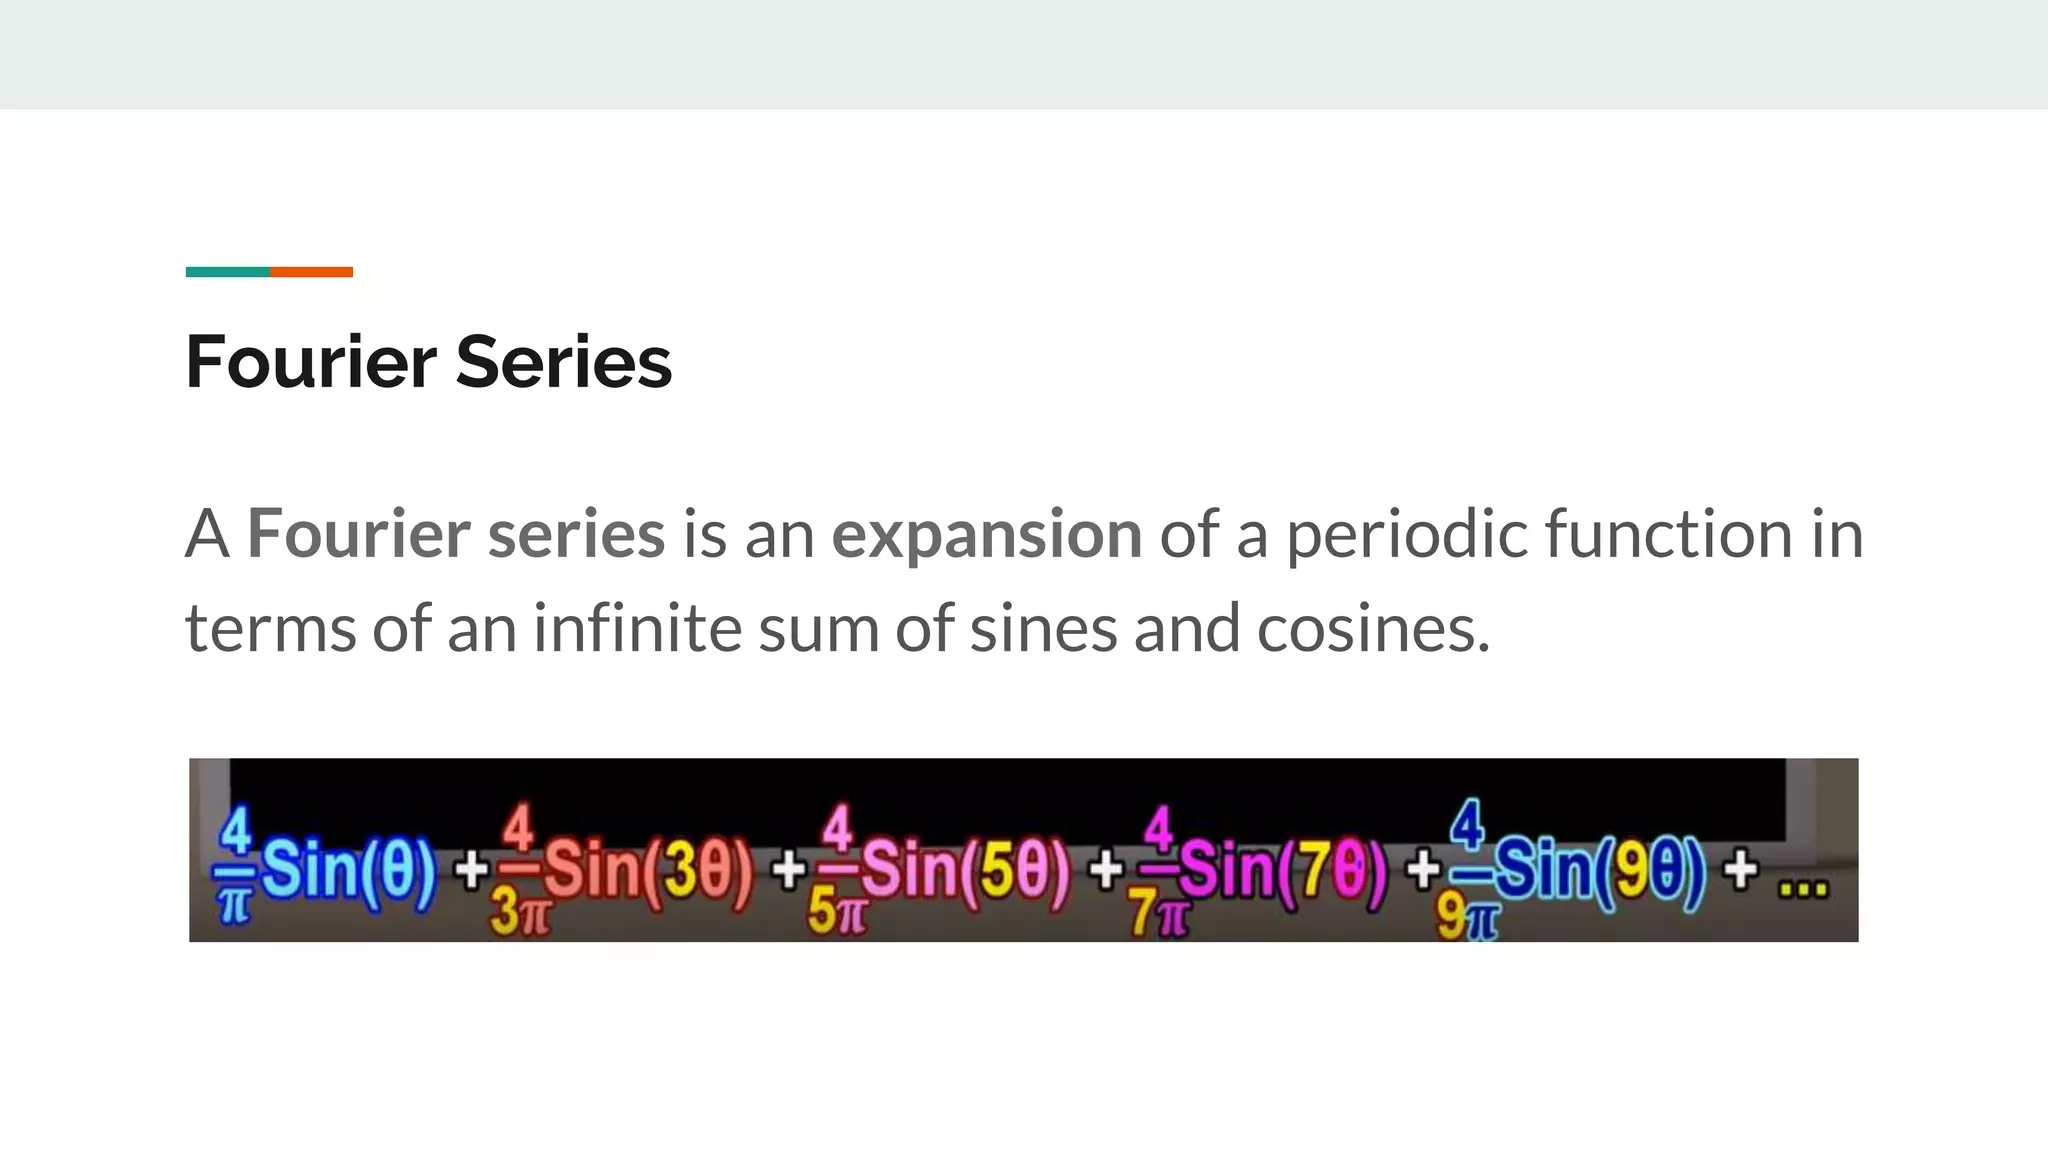
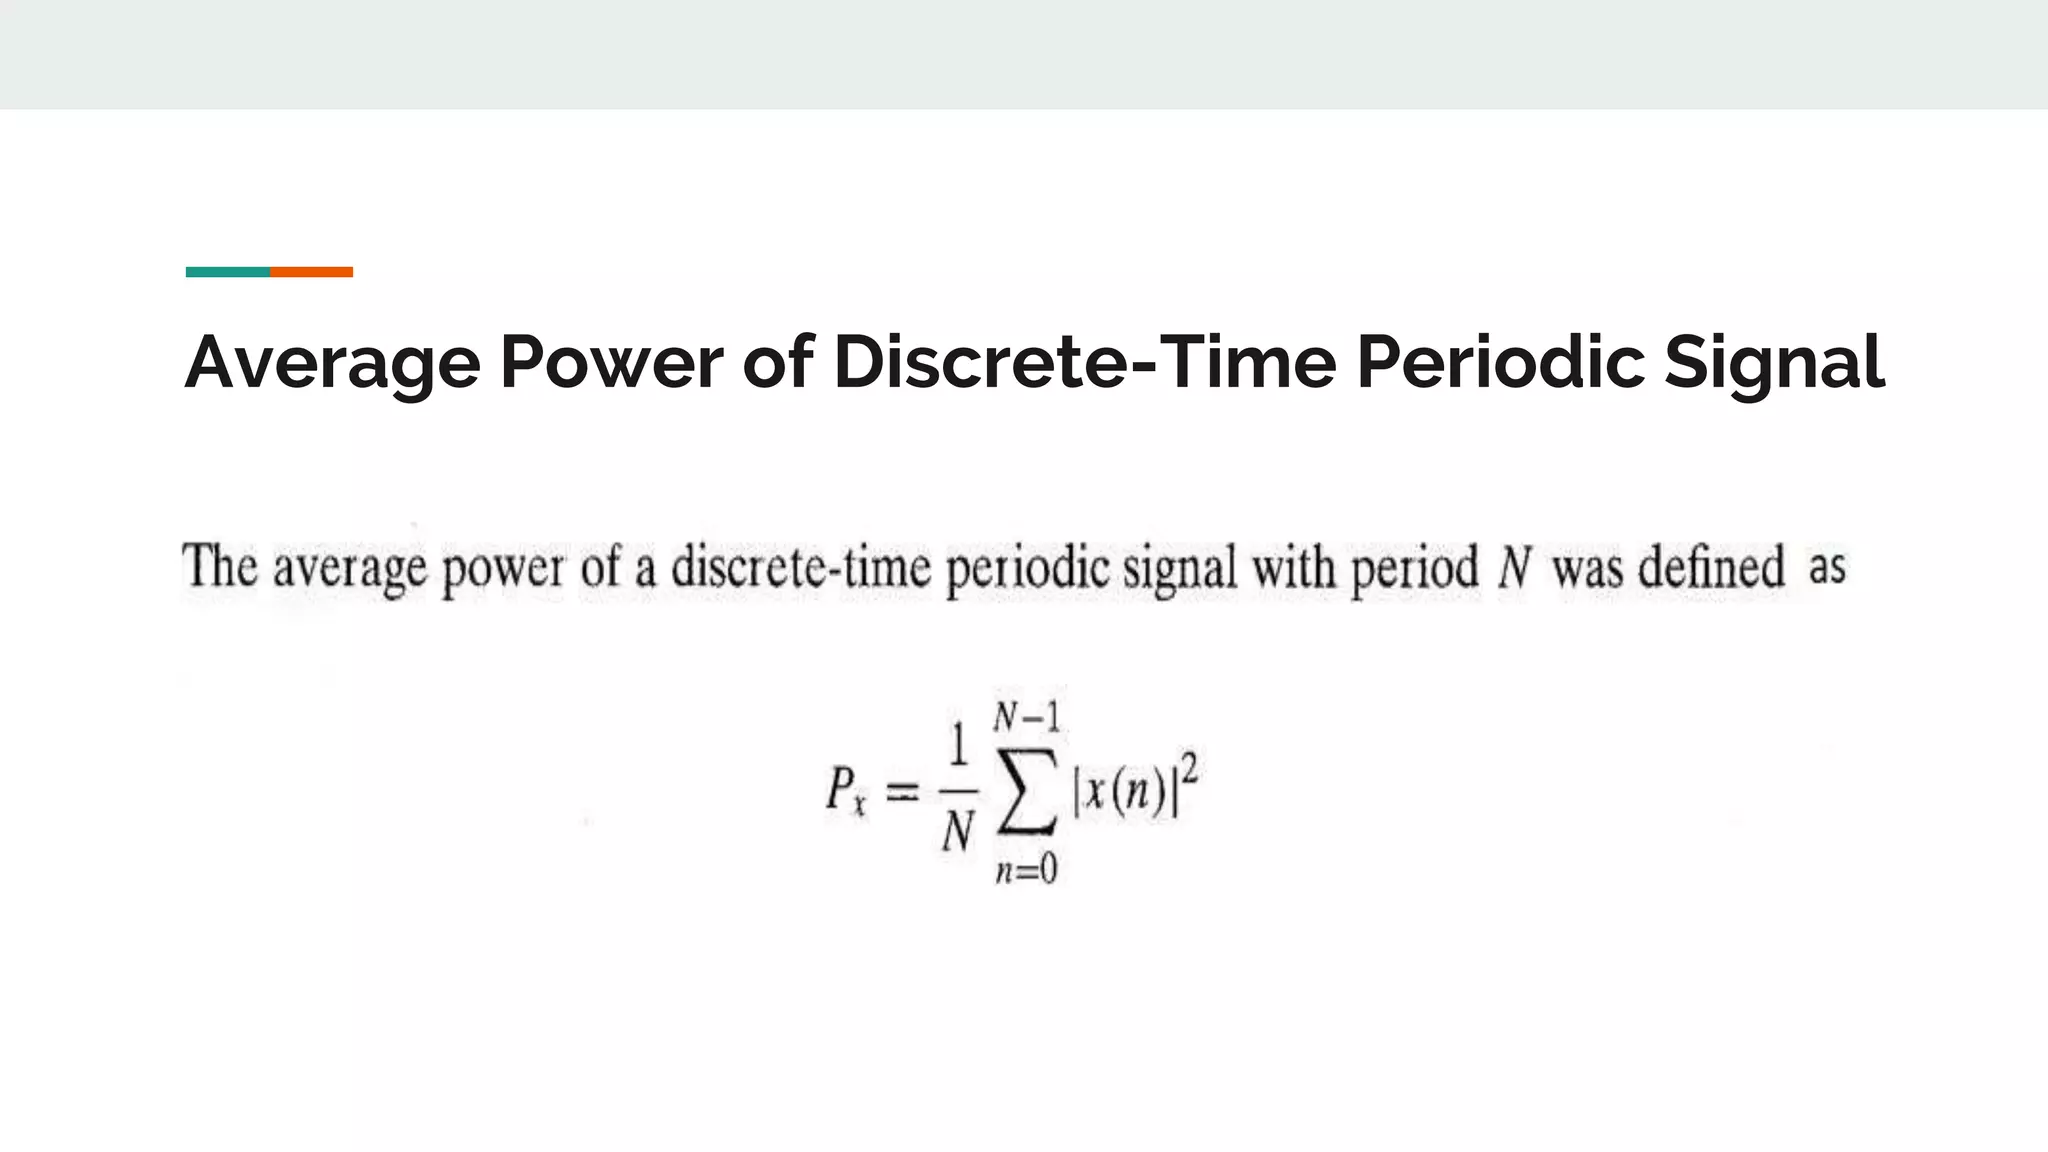
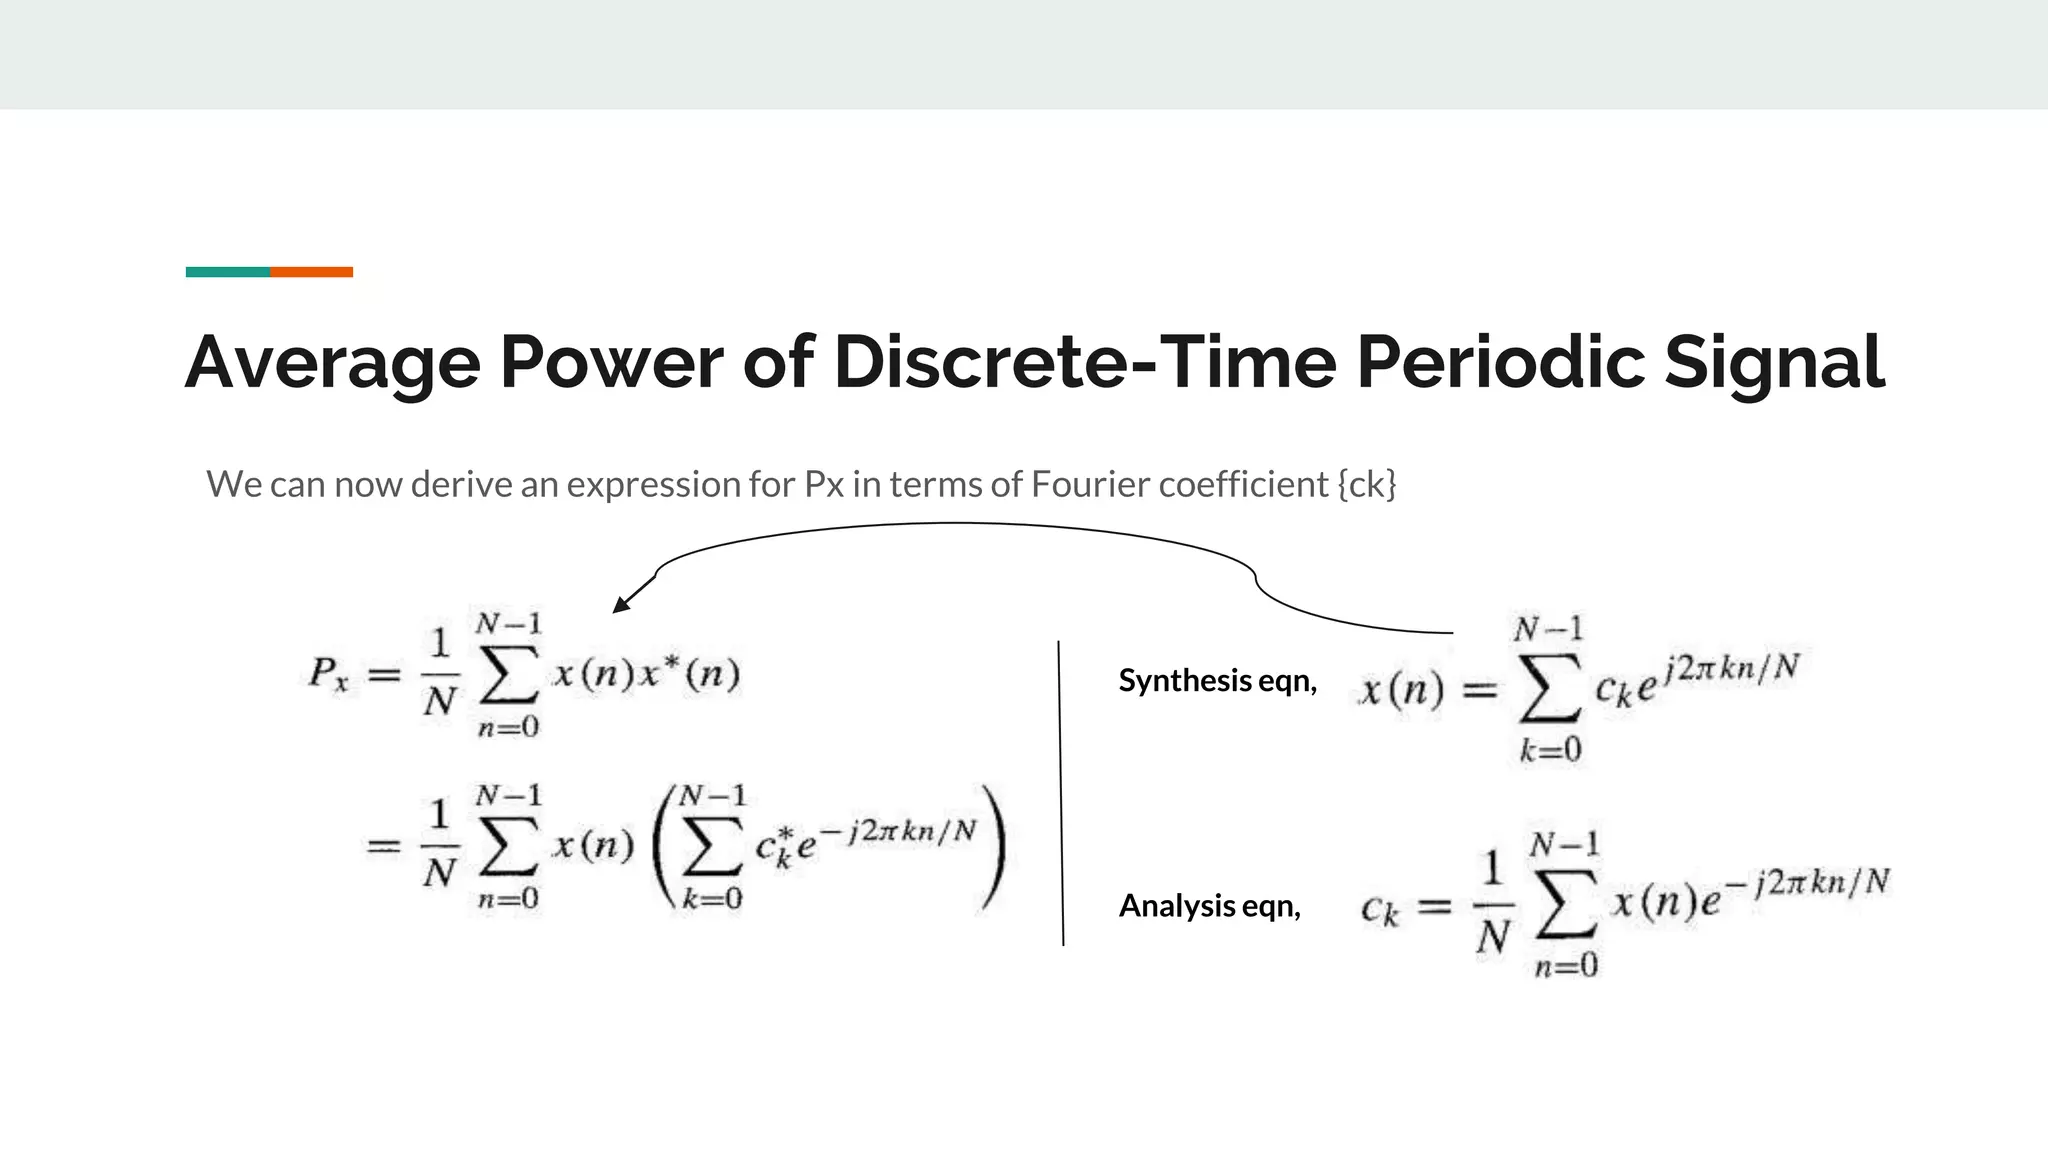
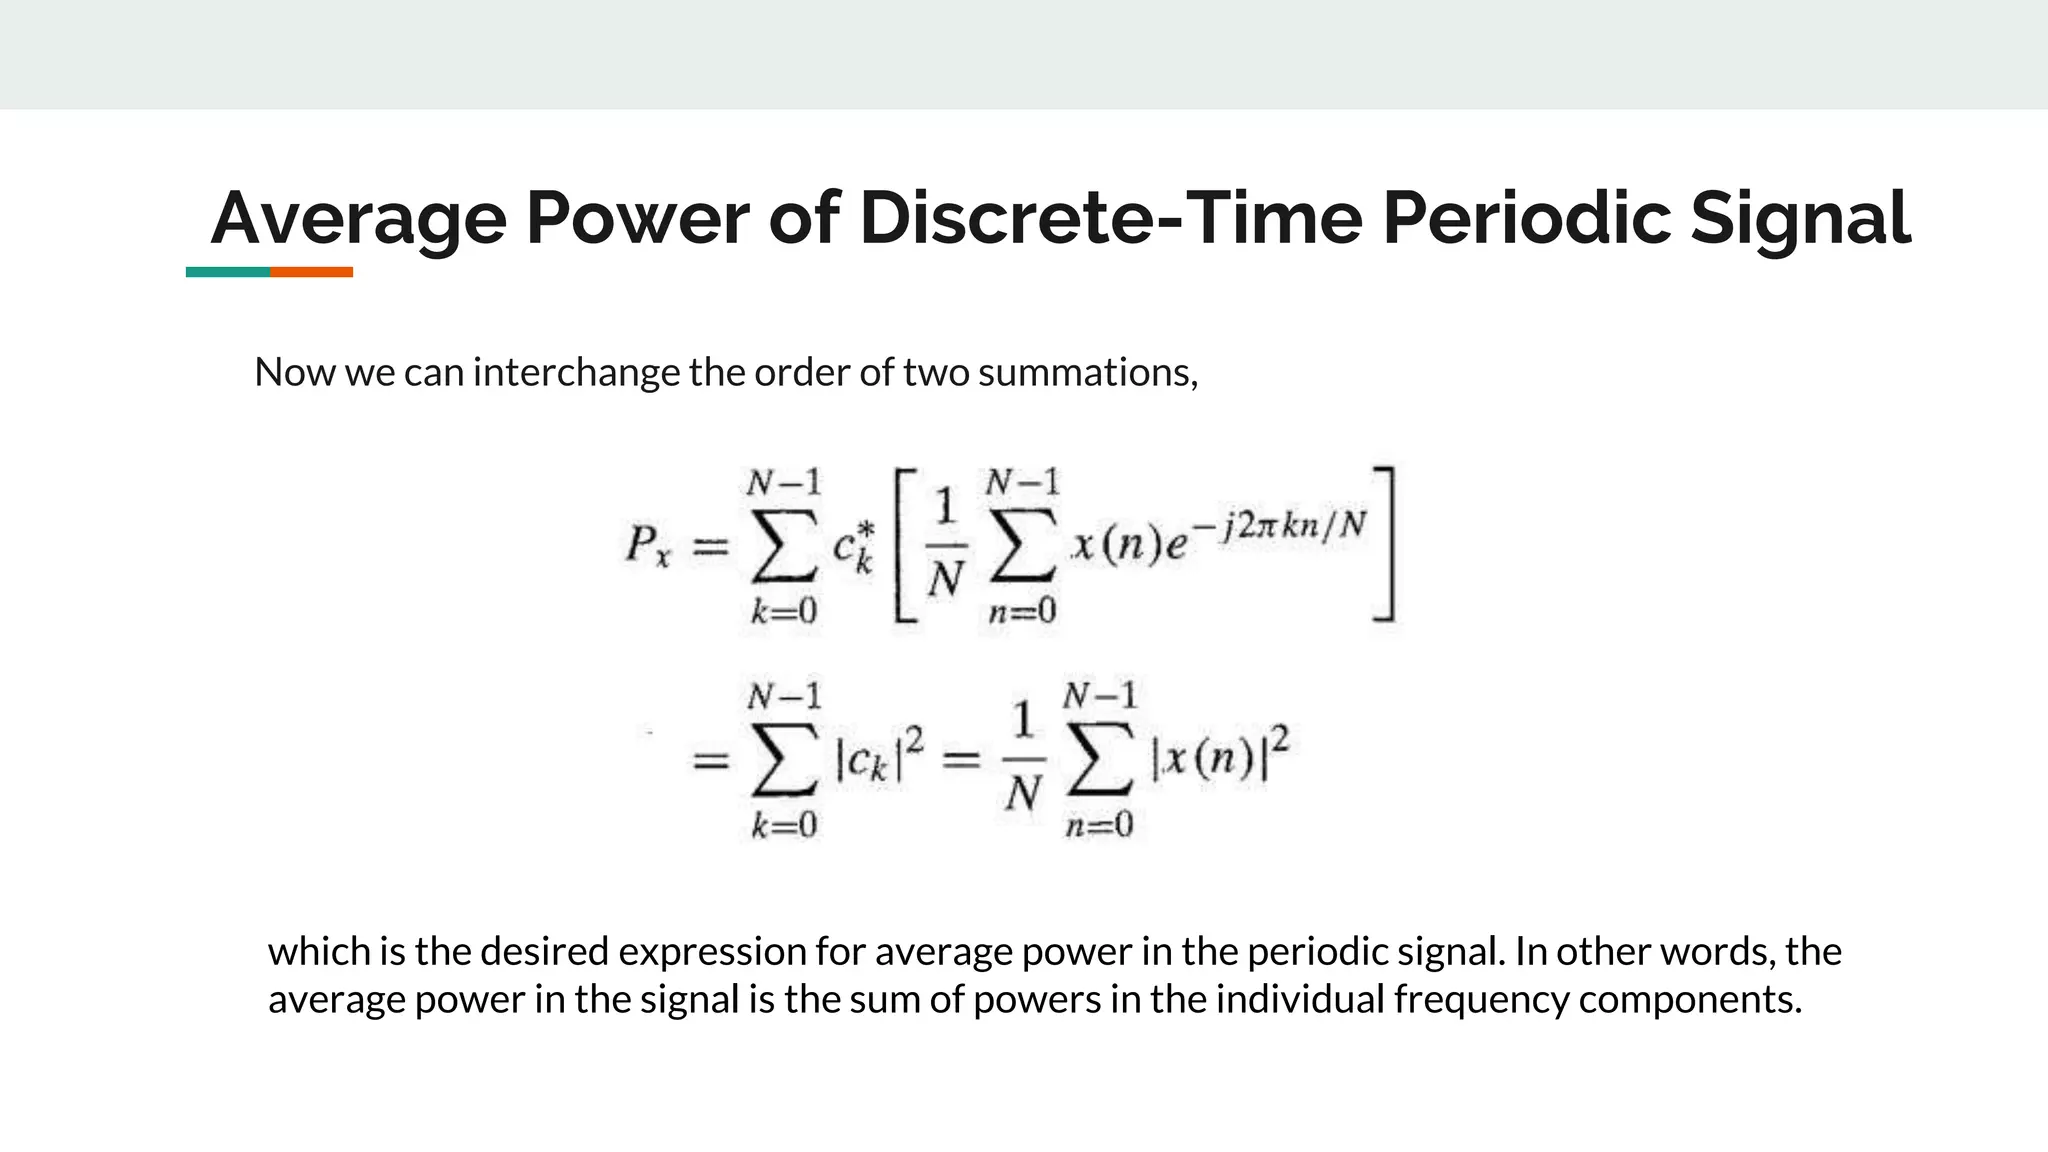
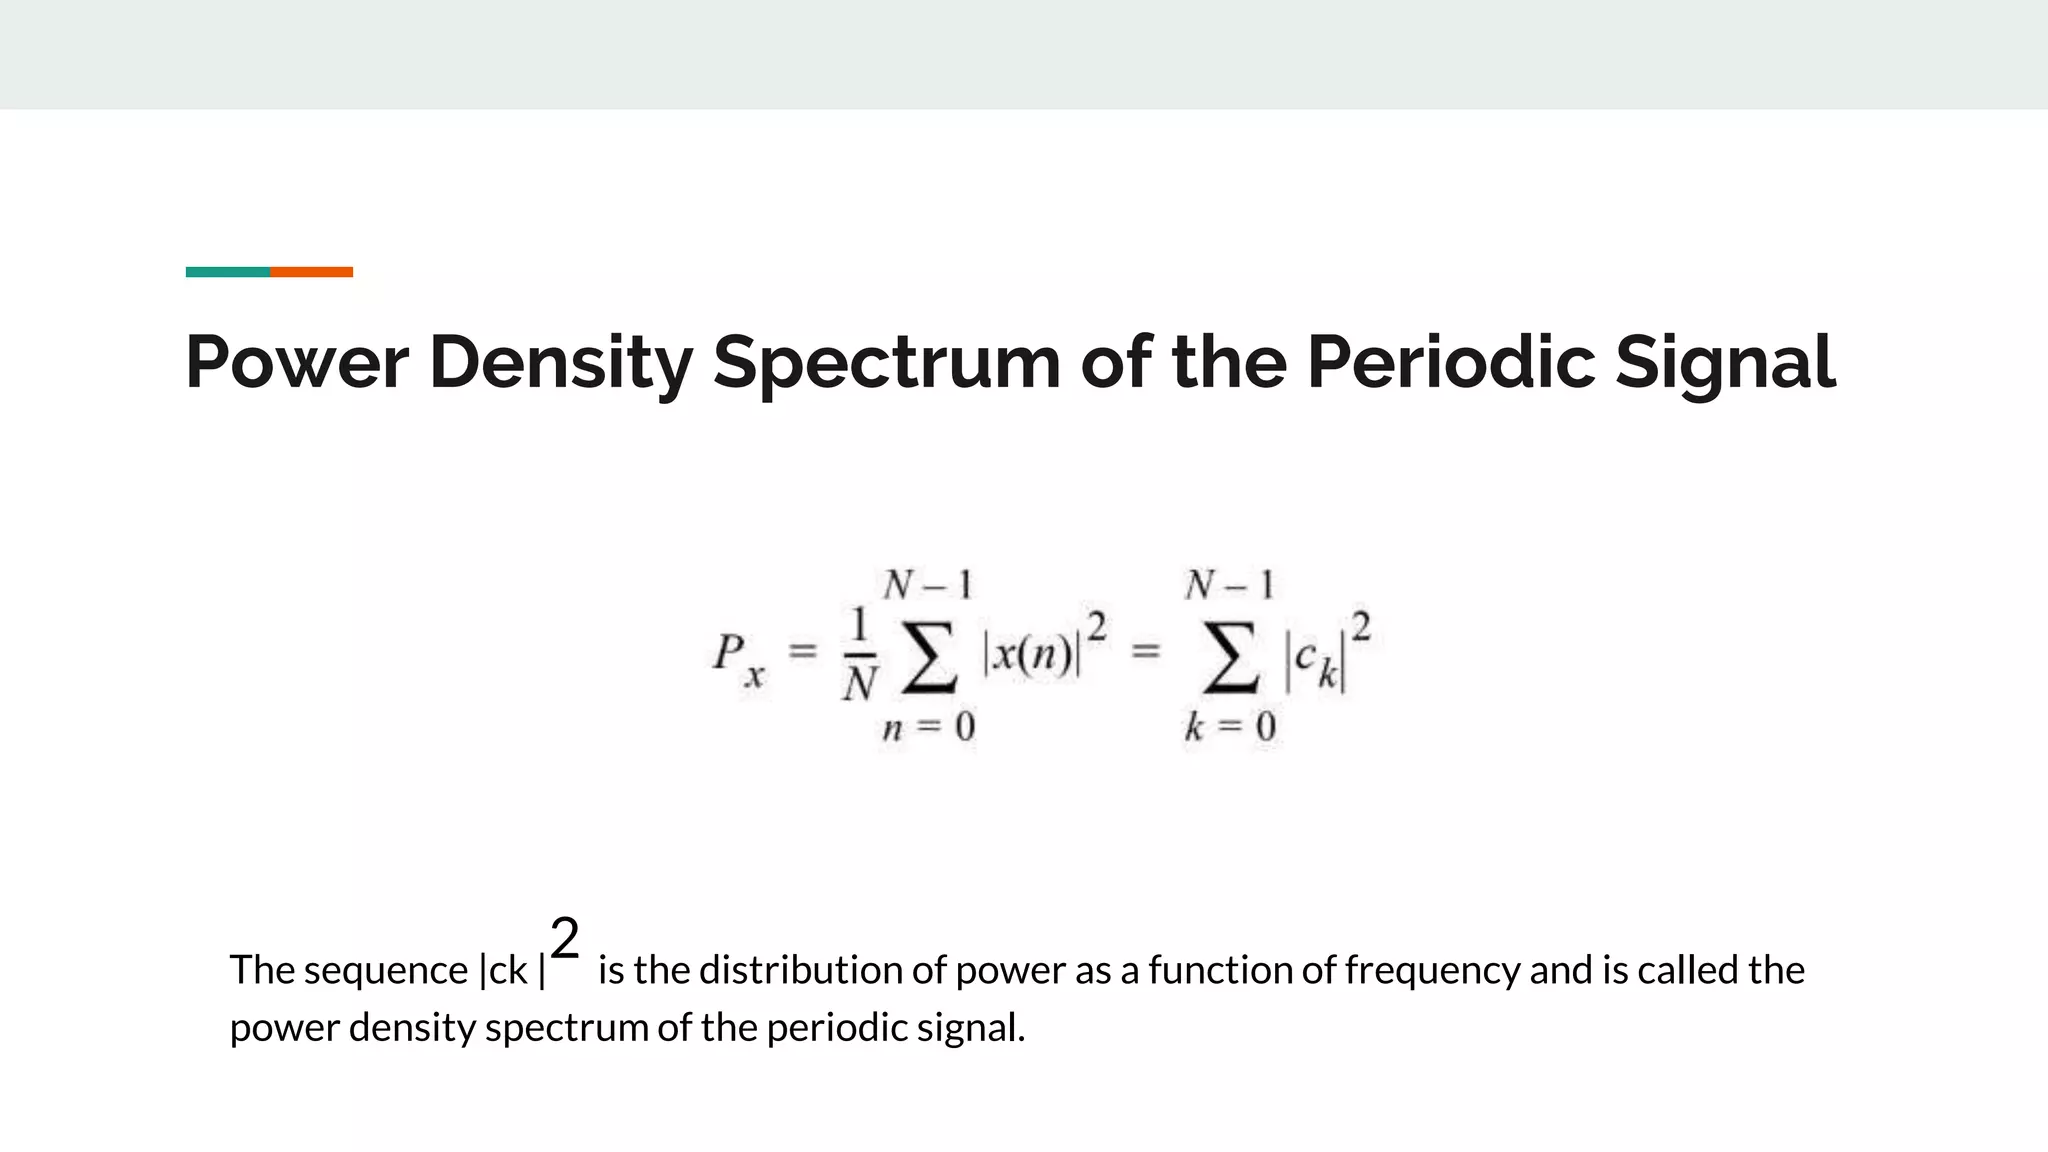
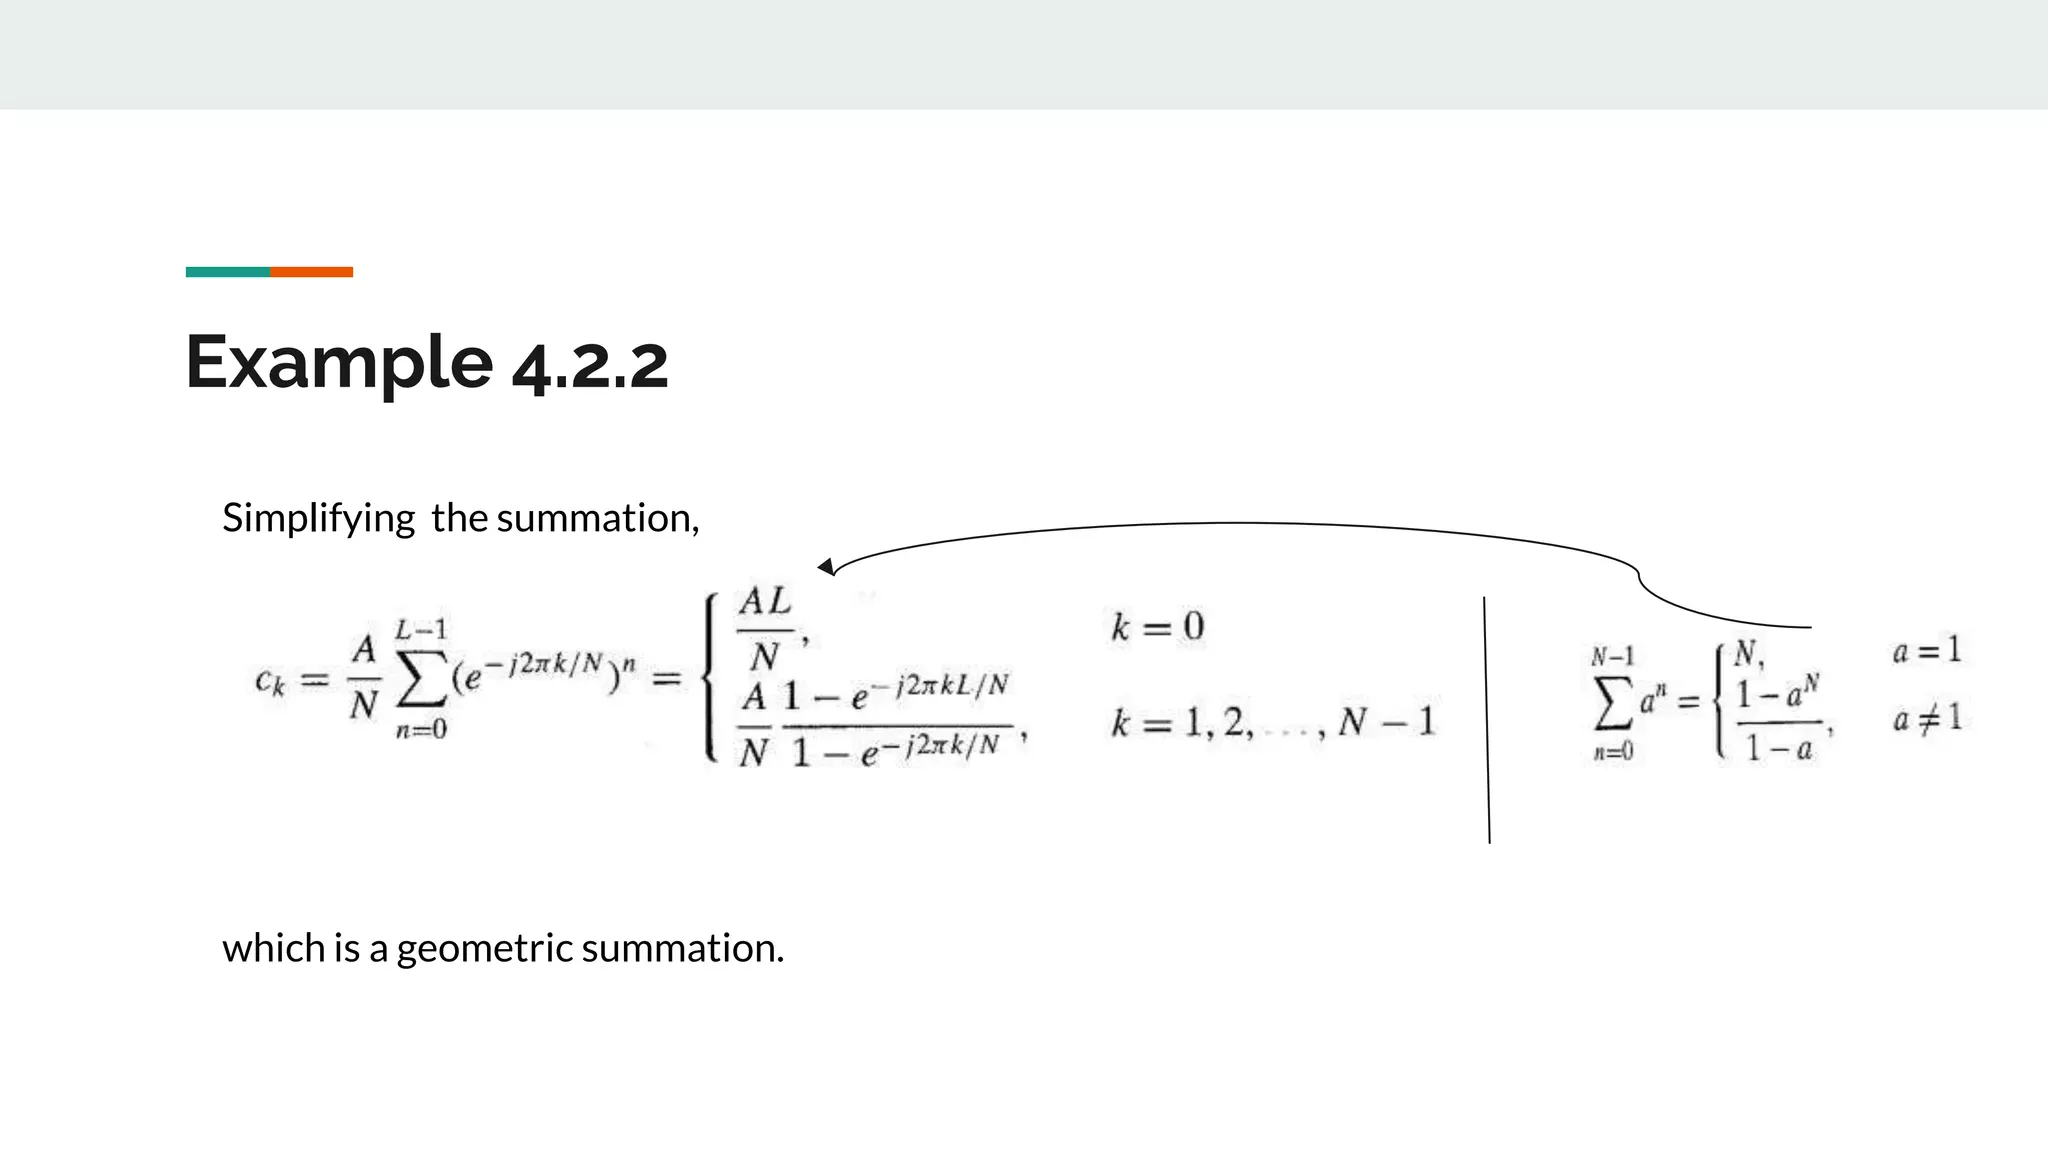
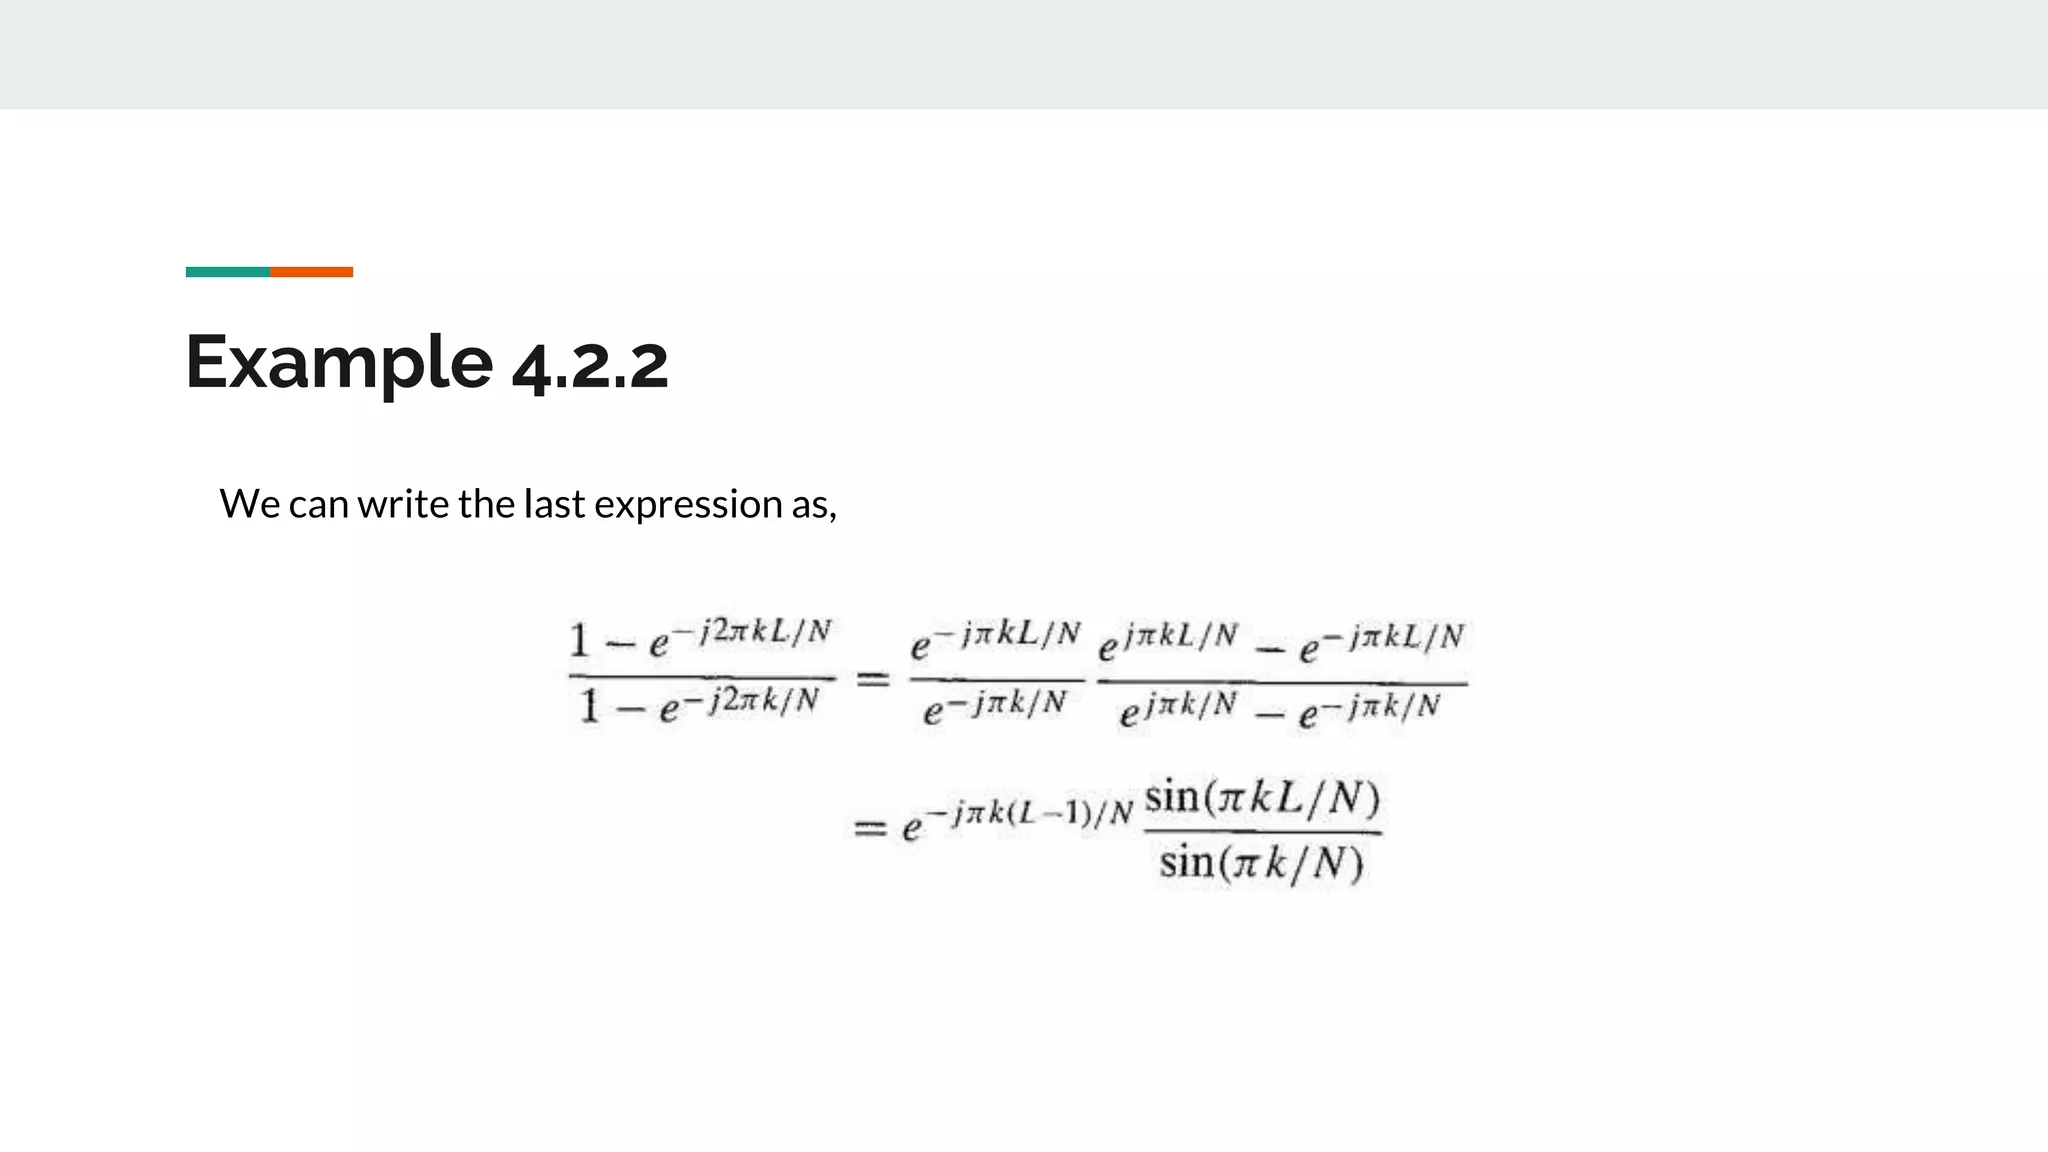
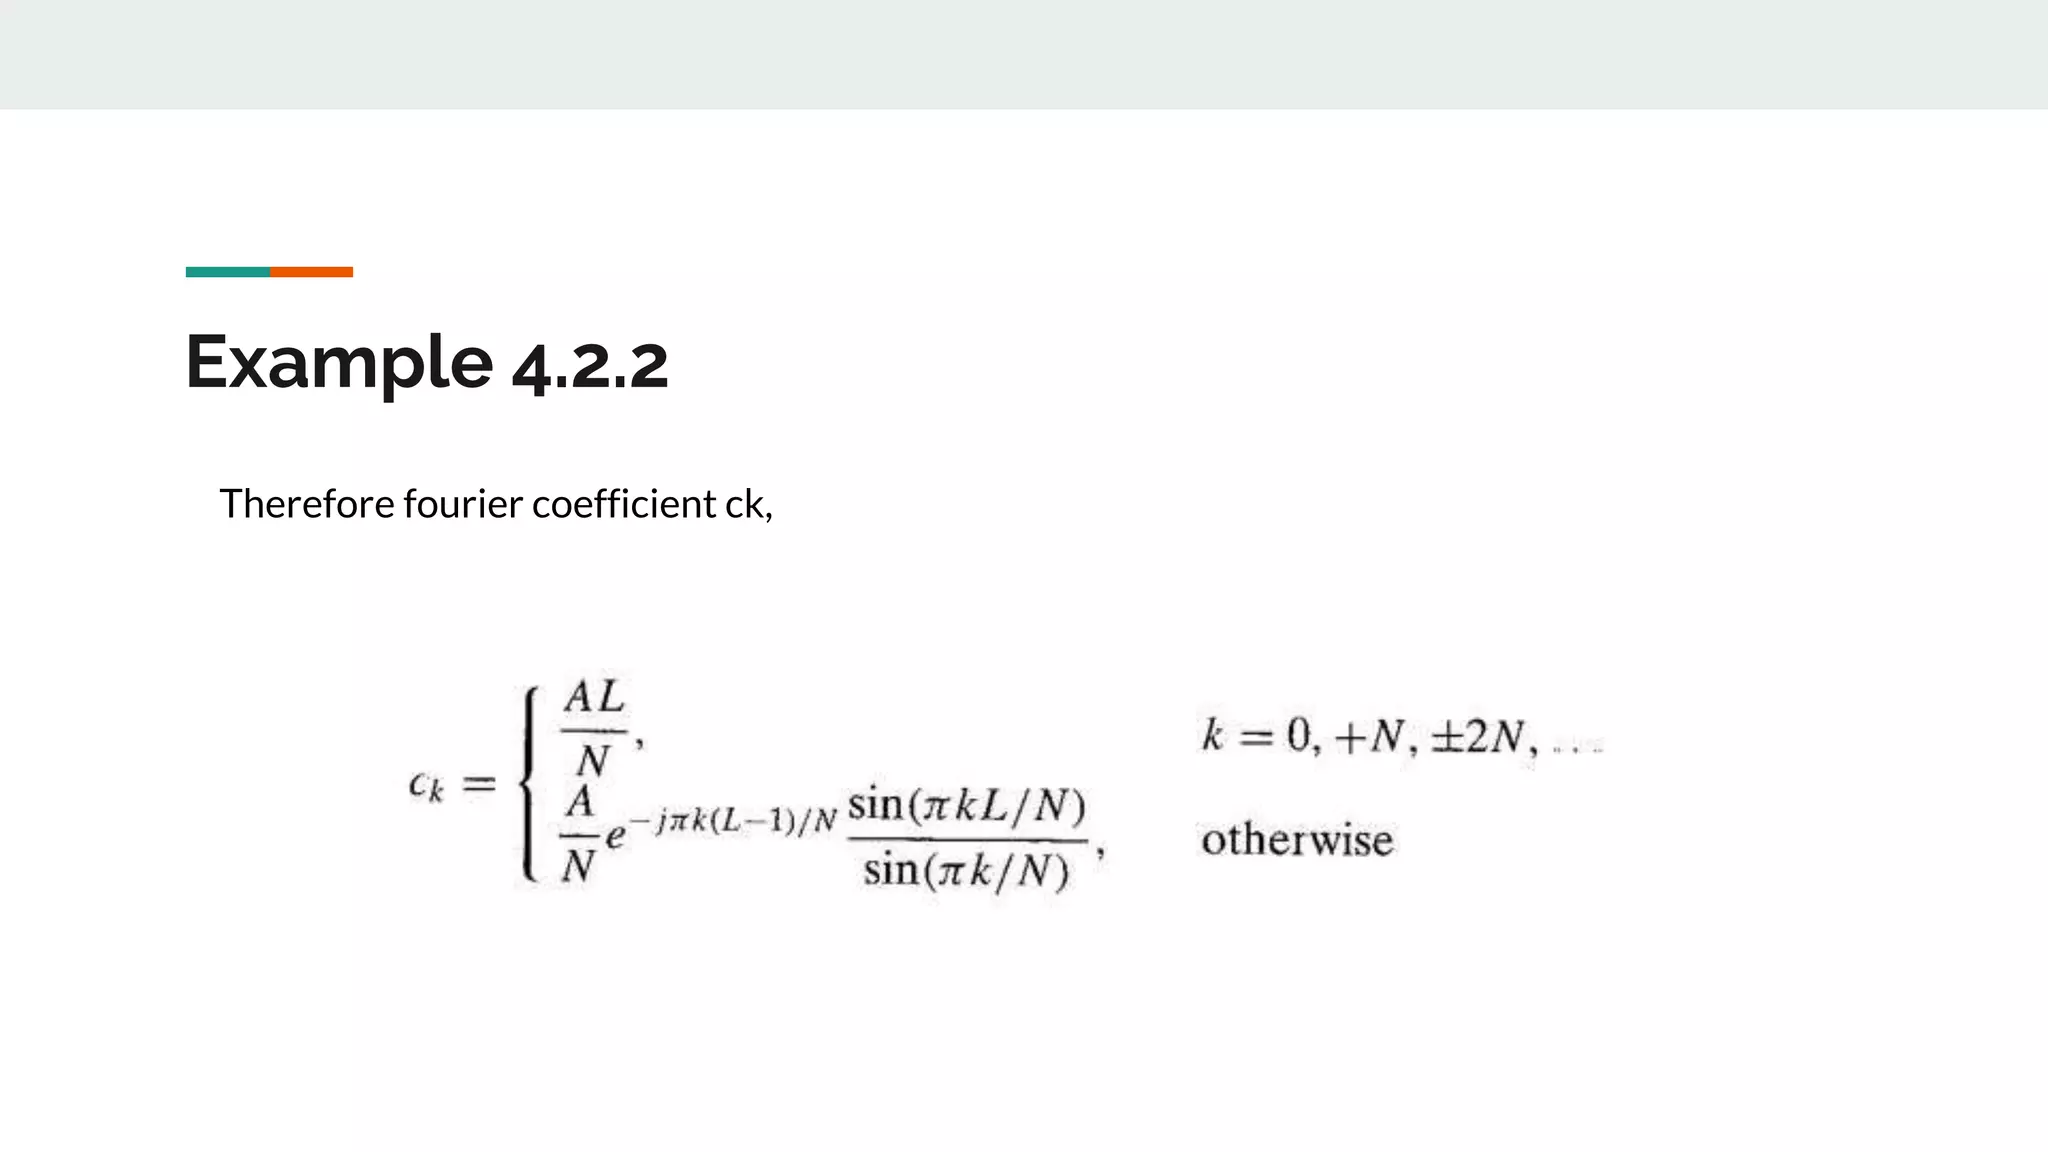
Power Density Spectrum
of Periodic Signals
Group 4
Power Density Spectrum
Definition
The power density spectrum also known as power
spectral density(PSD) shows how the energy of a signal
is distributed. That can allow us to make some decisions
or operations on a considered signal.
Signal Spectrum
By Fourier theory, any waveform can be represented by
a summation of a (possibly infinite) number of sinusoids,
each with a particular amplitude and phase. Such a
representation is referred to as the signal's spectrum(or
it's frequency-domain representation).
Fourier Transform
The Fourier Transform is a tool that breaks a waveform
(a function or signal) into an alternate representation,
characterized by sine and cosines. The Fourier
Transform shows that any waveform can be re-written
as the sum of sinusoidal functions
Fourier Series
A Fourier series is an expansion of a periodic function in
terms of an infinite sum of sines and cosines.
Frequency Spectrum
Frequency spectrum of a signal is the range of
frequencies contained by a signal.
Fig : Visible Light Communication Frequency Spectrum
Frequency Component
A given function or signal can be converted between the
time and frequency domains with a pair of mathematical
operators called a transform. An example is the Fourier
transform, which converts the time function into a sum of
sine waves of different frequencies, each of which
represents a frequency component.
Average Power of Discrete-Time Periodic Signal
We can now derive an expression for Px in terms of Fourier coefficient {ck}
Synthesis eqn,
Analysis eqn,
Average Power of Discrete-Time Periodic Signal
Now we can interchange the order of two summations,
which is the desired expression for average power in the periodic signal. In other words, the
average power in the signal is the sum of powers in the individual frequency components.
Power Density Spectrum of the Periodic Signal
The sequence |ck |
2 is the distribution of power as a function of frequency and is called the
power density spectrum of the periodic signal.
Energy Sequence The energy of a sequence over a single
period is given analogously as:
Example 4.2.2
Determine Fourier series coefficient and power density spectrum of the given periodic signal,
Example 4.2.2
By applying analysis equation of fourier series coefficient,
which is a geometric summation.
Example 4.2.2
Simplifying the summation,
which is a geometric summation.
Example 4.2.2
We can write the last expression as,
Example 4.2.2
Therefore fourier coefficient ck,
Example 4.2.2
The power density spectrum of the periodic signal is,
Thanks!

Power density Spectrum

  • 1.
    Power Density Spectrum ofPeriodic Signals Group 4
  • 2.
  • 3.
    Definition The power densityspectrum also known as power spectral density(PSD) shows how the energy of a signal is distributed. That can allow us to make some decisions or operations on a considered signal.
  • 4.
    Signal Spectrum By Fouriertheory, any waveform can be represented by a summation of a (possibly infinite) number of sinusoids, each with a particular amplitude and phase. Such a representation is referred to as the signal's spectrum(or it's frequency-domain representation).
  • 5.
    Fourier Transform The FourierTransform is a tool that breaks a waveform (a function or signal) into an alternate representation, characterized by sine and cosines. The Fourier Transform shows that any waveform can be re-written as the sum of sinusoidal functions
  • 6.
    Fourier Series A Fourierseries is an expansion of a periodic function in terms of an infinite sum of sines and cosines.
  • 7.
    Frequency Spectrum Frequency spectrumof a signal is the range of frequencies contained by a signal. Fig : Visible Light Communication Frequency Spectrum
  • 8.
    Frequency Component A givenfunction or signal can be converted between the time and frequency domains with a pair of mathematical operators called a transform. An example is the Fourier transform, which converts the time function into a sum of sine waves of different frequencies, each of which represents a frequency component.
  • 9.
    Average Power ofDiscrete-Time Periodic Signal
  • 10.
    Average Power ofDiscrete-Time Periodic Signal We can now derive an expression for Px in terms of Fourier coefficient {ck} Synthesis eqn, Analysis eqn,
  • 11.
    Average Power ofDiscrete-Time Periodic Signal Now we can interchange the order of two summations, which is the desired expression for average power in the periodic signal. In other words, the average power in the signal is the sum of powers in the individual frequency components.
  • 12.
    Power Density Spectrumof the Periodic Signal The sequence |ck | 2 is the distribution of power as a function of frequency and is called the power density spectrum of the periodic signal.
  • 13.
    Energy Sequence Theenergy of a sequence over a single period is given analogously as:
  • 14.
    Example 4.2.2 Determine Fourierseries coefficient and power density spectrum of the given periodic signal,
  • 15.
    Example 4.2.2 By applyinganalysis equation of fourier series coefficient, which is a geometric summation.
  • 16.
    Example 4.2.2 Simplifying thesummation, which is a geometric summation.
  • 17.
    Example 4.2.2 We canwrite the last expression as,
  • 18.
  • 19.
    Example 4.2.2 The powerdensity spectrum of the periodic signal is,
  • 20.