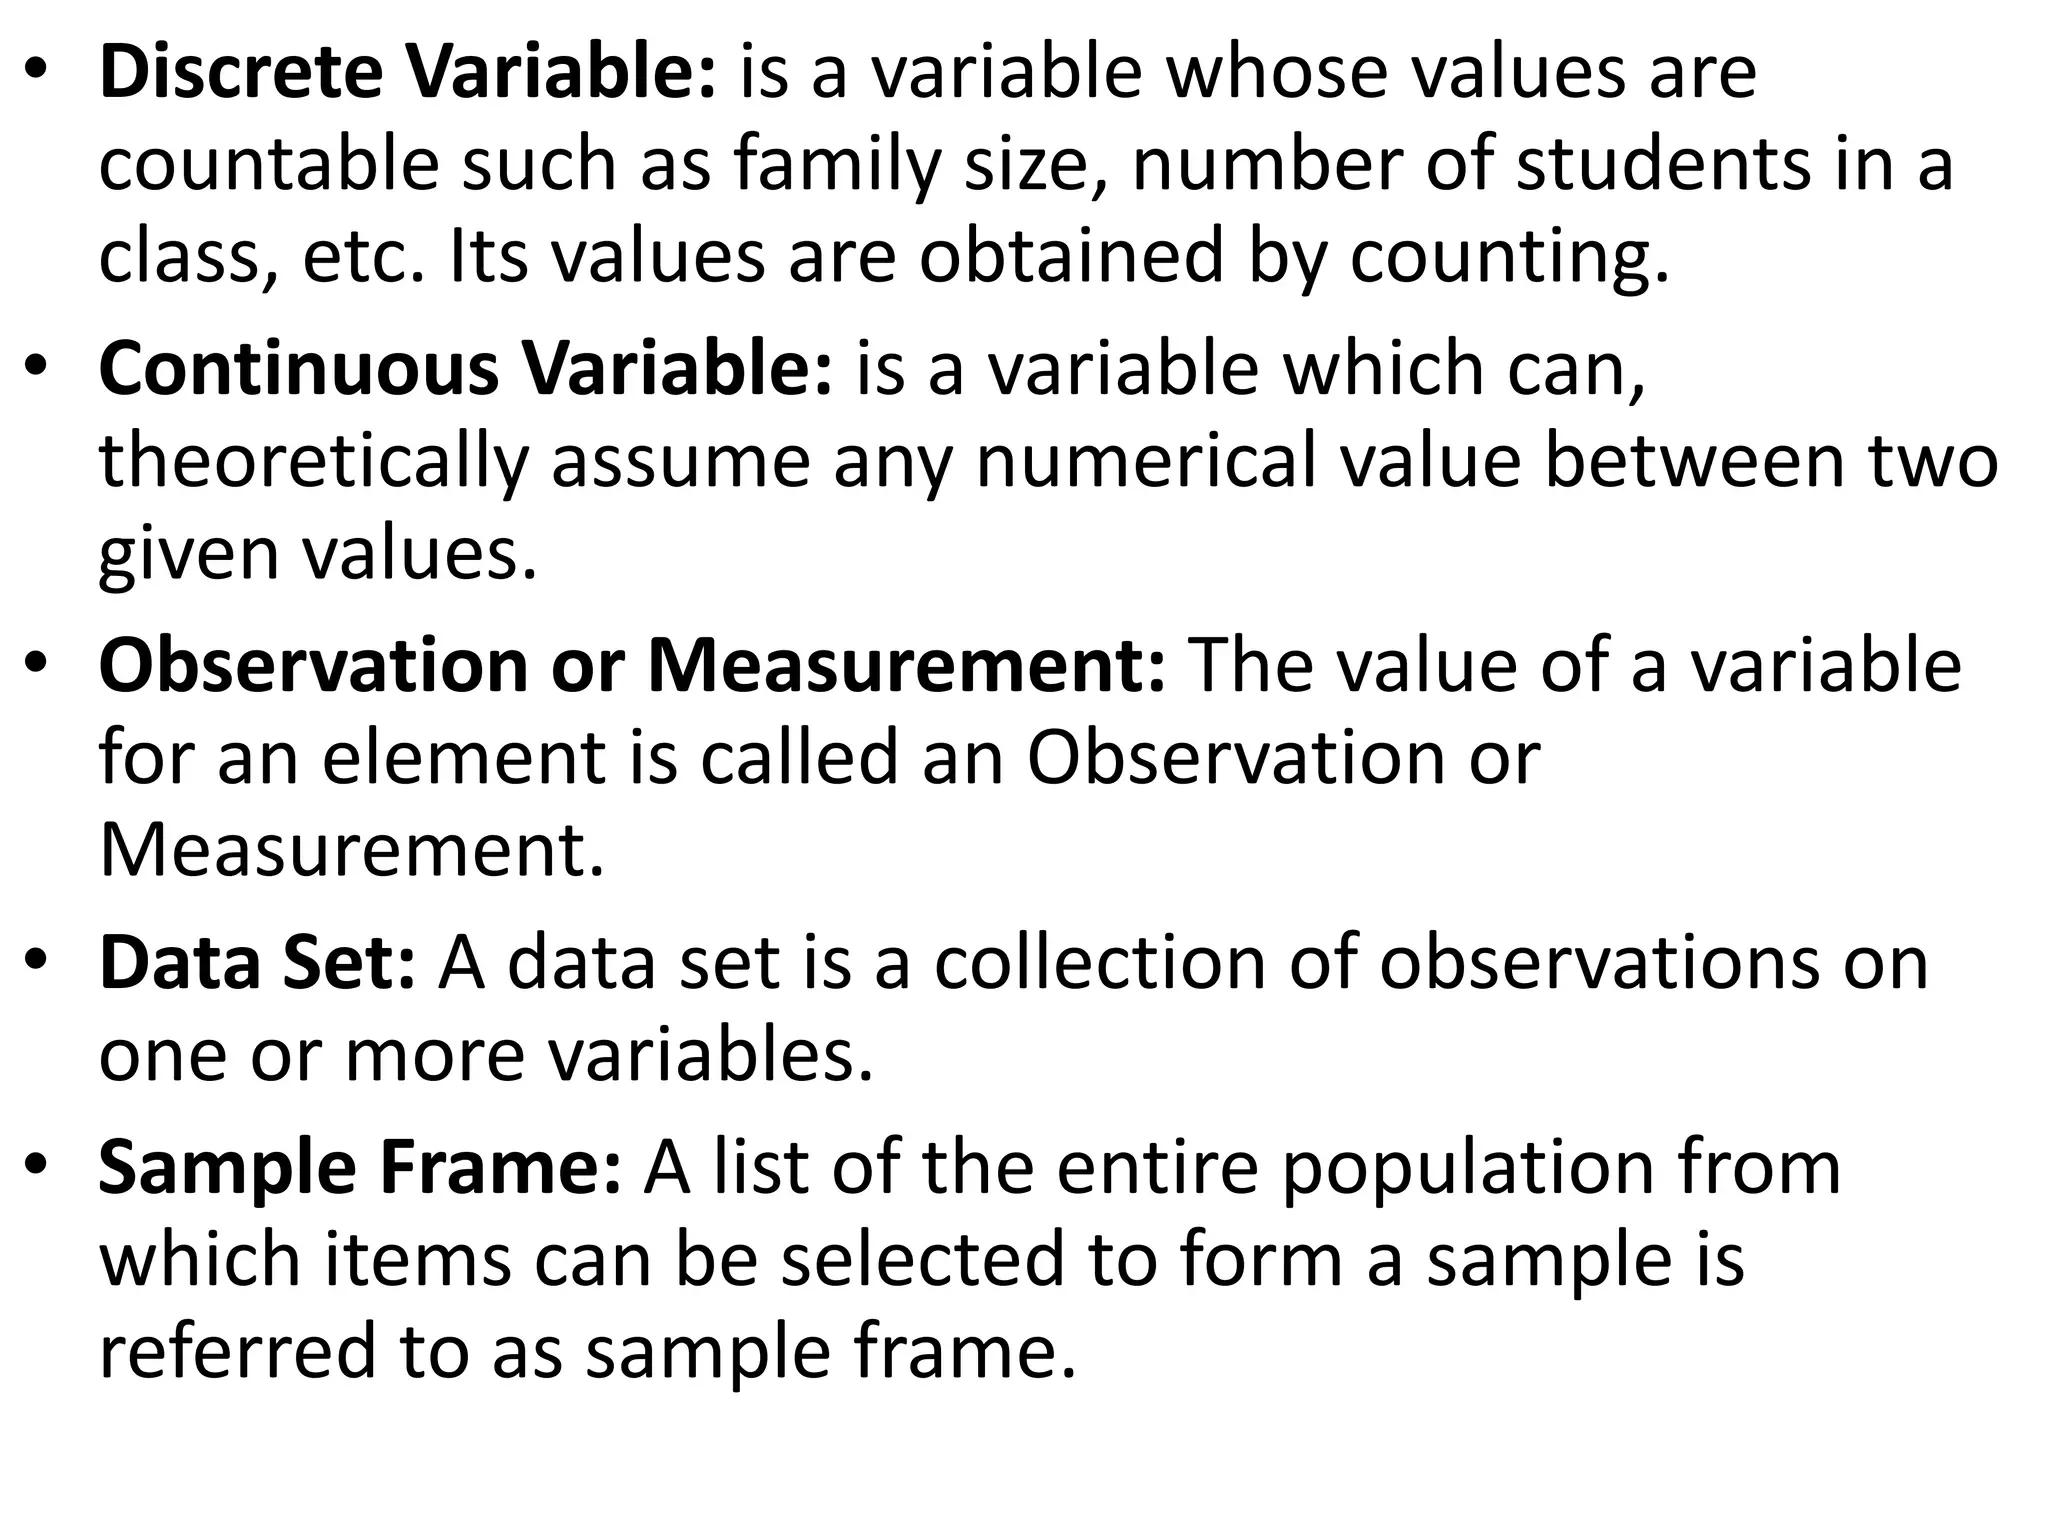
This document provides an introduction and definition of statistics. It discusses statistics in both the plural and singular sense, as numerical data and as a method of study, respectively. It also outlines the basic terminologies in statistics such as data, population, sample, parameters, variables, and scales of measurement. Finally, it discusses the classification and applications of statistics as well as its limitations.
This presentation on Introduction to Statistics helps Engineering students to review the fundamental topics of statistics. It is according tl syllabus of Institute of Engineering (IOE) but is similar to that of almost all the engineering colleges.
Stastistics in Physical Education - SMK.pptxshatrunjaykote
• It is a specific branch of mathematics that deals with analysis of data collected on various population groups
• Statistics involves mathematical abilities more than addition, subtraction, division and multiplication which are repeated many times in a logical fashion.
• for fuller details of statistical tests may refer to Chandha (1992); Vincent (1995); Hopkin et al. (1996); Sincrich et al. (2002); Triola (2002)
• Understanding of basic statistics is indispensable for dealing with the process of evaluation of test and measurement.
• The statistical concepts facilities proper and effective interpretation of test scores or measurements taken by the coach or a physical educator
• While a computer assists the teacher or the coach in saving the huge time needed for enormous calculations, but the meaning of results is made clear only through the understanding of relevant statistical test concepts.
• Tests act as seed to measurements, the statistical tests act as seed to the construction of all other types of tests and are also essential for the testing of validity, reliability and objectivity of all tests.
The information which we can deduce from test and measurement is based on our statistical ability. It is the statistical tools which enable us to do the following important functions:
1. Organize and tabulate date (presentation of facts in a definite form)
2. Analysis data
3. Synthesize data (classification / combination of facts)
4. Compare groups of data
5. Simplification of unwieldy and complex data
6. Proper interpretation of a data
7. testing of hypotheses
8. understand the relationship and association between different parameters, make predications and take decisions.
9. Construction of physical, psychomotor and written tests
10. Evaluation of individual measurements
11. selection of sportsperson
12. Monitoring of training and teaching effects and testing the need for individualization of training and teaching.
13. Meaning: The word “statistics” is a plural form of ‘statistic’. The term statistic is uncommon to that an extent that many of the students of statistics may be unaware of its singular form. The word statistics has been taken from German word ‘statistik’ meaning a political state. Since, facts and figures were required in olden days mainly by kings for their administration. Therefore, in the beginning. It was also known as the ‘Science of Kings’ (Chadha, 1992). Subsequently, its scope has greatly widened and statistics now refers to a huge body of methods, symbols and formulae dealing with phenomena that can be described numerically providing quantitative arrays of information
14. Statistic is numerical value which characterizes a group of scores. For example the average height characterizes the entire sample whose all subjects’ heights have been measured to calculate the average height. A number of such characterizing values refer to the plural form of above mentioned statistic and thus, give rise to the more commonly used
Statistics as a subject (field of study):
Statistics is defined as the science of collecting, organizing, presenting, analyzing and interpreting numerical data to make decision on the bases of such analysis.(Singular sense)
Statistics as a numerical data:
Statistics is defined as aggregates of numerical expressed facts (figures) collected in a systematic manner for a predetermined purpose. (Plural sense) In this course, we shall be mainly concerned with statistics as a subject, that is, as a field of study
The material is consolidated from different sources on the basic concepts of Statistics which could be used for the Visualization an Prediction requirements of Analytics.
I deeply acknowledge the sources which helped me consolidate the material for my students.
CRM 101: What is CRM?
This is a simple definition of CRM.
Customer relationship management (CRM) is a technology for managing all your company’s relationships and interactions with customers and potential customers. The goal is simple: Improve business relationships to grow your business. A CRM system helps companies stay connected to customers, streamline processes, and improve profitability.
When people talk about CRM, they are usually referring to a CRM system, a tool that helps with contact management, sales management, agent productivity, and more. CRM tools can now be used to manage customer relationships across the entire customer lifecycle, spanning marketing, sales, digital commerce, and customer service interactions.
A CRM solution helps you focus on your organization’s relationships with individual people — including customers, service users, colleagues, or suppliers — throughout your lifecycle with them, including finding new customers, winning their business, and providing support and additional services throughout the relationship.
Who is CRM for?
A CRM system gives everyone — from sales, customer service, business development, recruiting, marketing, or any other line of business — a better way to manage the external interactions and relationships that drive success. A CRM tool lets you store customer and prospect contact information, identify sales opportunities, record service issues, and manage marketing campaigns, all in one central location — and make information about every customer interaction available to anyone at your company who might need it.
With visibility and easy access to data, it's easier to collaborate and increase productivity. Everyone in your company can see how customers have been communicated with, what they’ve bought, when they last purchased, what they paid, and so much more. CRM can help companies of all sizes drive business growth, and it can be especially beneficial to a small business, where teams often need to find ways to do more with less.
Here’s why CRM matters to your business.
CRM is the largest and fastest-growing enterprise application software category, and worldwide spending on CRM is expected to reach USD $114.4 billion by the year 2027. If your business is going to last, you need a strategy for the future that’s centered around your customers, and enabled by the right technology. You have targets for sales, business objectives, and profitability. But getting up-to-date, reliable information on your progress can be tricky. How do you translate the many streams of data coming in from sales, customer service, marketing, and social media monitoring into useful business information?
A CRM system can give you a clear overview of your customers. You can see everything in one place — a simple, customizable dashboard that can tell you a customer’s previous history with you, the status of their orders, any outstanding customer service issues, and more. You can even choose to include information
When most people in the industry talk about online or digital reputation management, what they're really saying is Google search and PPC. And it's usually reactive, left dealing with the aftermath of negative information published somewhere online. That's outdated. It leaves executives, organizations and other high-profile individuals at a high risk of a digital reputation attack that spans channels and tactics. But the tools needed to safeguard against an attack are more cybersecurity-oriented than most marketing and communications professionals can manage. Business leaders Leaders grasp the importance; 83% of executives place reputation in their top five areas of risk, yet only 23% are confident in their ability to address it. To succeed in 2024 and beyond, you need to turn online reputation on its axis and think like an attacker.
Key Takeaways:
- New framework for examining and safeguarding an online reputation
- Tools and techniques to keep you a step ahead
- Practical examples that demonstrate when to act, how to act and how to recover
The session includes a brief history of the evolution of search before diving into the roles technology, content, and links play in developing a powerful SEO strategy in a world of Generative AI and social search. Discover how to optimize for TikTok searches, Google's Gemini, and Search Generative Experience while developing a powerful arsenal of tools and templates to help maximize the effectiveness of your SEO initiatives.
Key Takeaways:
Understand how search engines work
Be able to find out where your users search
Know what is required for each discipline of SEO
Feel confident creating an SEO Plan
Confidently measure SEO performance
In this presentation, Danny Leibrandt explains the impact of AI on SEO and what Google has been doing about it. Learn how to take your SEO game to the next level and win over Google with his new strategy anyone can use. Get actionable steps to rank your name, your business, and your clients on Google - the right way.
Key Takeaways:
1. Real content is king
2. Find ways to show EEAT
3. Repurpose across all platforms
Top 3 Ways to Align Sales and Marketing Teams for Rapid GrowthDemandbase
In this session, Demandbase’s Stephanie Quinn, Sr. Director of Integrated and Digital Marketing, Devin Rosenberg, Director of Sales, and Kevin Rooney, Senior Director of Sales Development will share how sales and marketing shapes their day-to-day and what key areas are needed for true alignment.
How to Run Landing Page Tests On and Off Paid Social PlatformsVWO
Join us for an exclusive webinar featuring Mariate, Alexandra and Nima where we will unveil a comprehensive blueprint for crafting a successful paid media strategy focused on landing page testing.With escalating costs in paid advertising, understanding how to maximize each visitor’s experience is crucial for retention and conversion.
This session will dive into the methodologies for executing and analyzing landing page tests within paid social channels, offering a blend of theoretical knowledge and practical insights.
The Pearmill team will guide you through the nuances of setting up and managing landing page experiments on paid social platforms. You will learn about the critical rules to follow, the structure of effective tests, optimal conversion duration and budget allocation.
The session will also cover data analysis techniques and criteria for graduating landing pages.
In the second part of the webinar, Pearmill will explore the use of A/B testing platforms. Discover common pitfalls to avoid in A/B testing and gain insights into analyzing A/B tests results effectively.
Digital marketing is the art and science of promoting products or services using digital channels to reach and engage with potential customers. It encompasses a wide range of online tactics and strategies aimed at increasing brand visibility, driving website traffic, generating leads, and ultimately, converting those leads into customers.
https://nidmindia.com/
Most small businesses struggle to see marketing results. In this session, we will eliminate any confusion about what to do next, solving your marketing problems so your business can thrive. You’ll learn how to create a foundational marketing OS (operating system) based on neuroscience and backed by real-world results. You’ll be taught how to develop deep customer connections, and how to have your CRM dynamically segment and sell at any stage in the customer’s journey. By the end of the session, you’ll remove confusion and chaos and replace it with clarity and confidence for long-term marketing success.
Key Takeaways:
• Uncover the power of a foundational marketing system that dynamically communicates with prospects and customers on autopilot.
• Harness neuroscience and Tribal Alignment to transform your communication strategies, turning potential clients into fans and those fans into loyal customers.
• Discover the art of automated segmentation, pinpointing your most lucrative customers and identifying the optimal moments for successful conversions.
• Streamline your business with a content production plan that eliminates guesswork, wasted time, and money.
How to Use AI to Write a High-Quality Article that Ranksminatamang0021
In the world of content creation, many AI bloggers have drifted away from their original vision, resulting in low-quality articles that search engines overlook. Don't let that happen to you! Join us to discover how to leverage AI tools effectively to craft high-quality content that not only captures your audience's attention but also ranks well on search engines.
Disclaimer: Some of the prompts mentioned here are the examples of Matt Diggity. Please use it as reference and make your own custom prompts.
SEO as the Backbone of Digital MarketingFelipe Bazon
In this talk Felipe Bazon will share how him and his team at Hedgehog Digital share our journey of making C-Levels alike, specially CMOS realize that SEO is the backbone of digital marketing by showing how SEO can contribute to brand awareness, reputation and authority and above all how to use SEO to create more robust global marketing strategies.
Videos are more engaging, more memorable, and more popular than any other type of content out there. That’s why it’s estimated that 82% of consumer traffic will come from videos by 2025.
And with videos evolving from landscape to portrait and experts promoting shorter clips, one thing remains constant – our brains LOVE videos.
So is there science behind what makes people absolutely irresistible on camera?
The answer: definitely yes.
In this jam-packed session with Stephanie Garcia, you’ll get your hands on a steal-worthy guide that uncovers the art and science to being irresistible on camera. From body language to words that convert, she’ll show you how to captivate on command so that viewers are excited and ready to take action.
Come learn how YOU can Animate and Illuminate the World with Generative AI's Explosive Power. Come sit in the driver's seat and learn to harness this great technology.
10 Video Ideas Any Business Can Make RIGHT NOW!
You'll never draw a blank again on what kind of video to make for your business. Go beyond the basic categories and truly reimagine a brand new advanced way to brainstorm video content creation. During this masterclass you'll be challenged to think creatively and outside of the box and view your videos through lenses you may have never thought of previously. It's guaranteed that you'll leave with more than 10 video ideas, but I like to under-promise and over-deliver. Don't miss this session.
Key Takeaways:
How to use the Video Matrix
How to use additional "Lenses"
Where to source original video ideas
First Things First: Building and Effective Marketing Strategy
Too many companies (and marketers) jump straight into activation planning without formalizing a marketing strategy. It may seem tedious, but analyzing the mindset of your targeted audiences and identifying the messaging points most likely to resonate with them is time well spent. That process is also a great opportunity for marketers to collaborate with sales leaders and account managers on a galvanized go-to-market approach. I’ll walk you through the methods and tools we use with our clients to ensure campaign success.
Key Takeaways:
-Recognize the critical role of strategy in marketing
-Learn our approach for building an actionable, effective marketing strategy
-Receive templates and guides for developing a marketing strategy
Most small businesses struggle to see marketing results. In this session, we will eliminate any confusion about what to do next, solving your marketing problems so your business can thrive. You’ll learn how to create a foundational marketing OS (operating system) based on neuroscience and backed by real-world results. You’ll be taught how to develop deep customer connections, and how to have your CRM dynamically segment and sell at any stage in the customer’s journey. By the end of the session, you’ll remove confusion and chaos and replace it with clarity and confidence for long-term marketing success.
Key Takeaways:
• Uncover the power of a foundational marketing system that dynamically communicates with prospects and customers on autopilot.
• Harness neuroscience and Tribal Alignment to transform your communication strategies, turning potential clients into fans and those fans into loyal customers.
• Discover the art of automated segmentation, pinpointing your most lucrative customers and identifying the optimal moments for successful conversions.
• Streamline your business with a content production plan that eliminates guesswork, wasted time, and money.
The digital marketing industry is changing faster than ever and those who don’t adapt with the times are losing market share. Where should marketers be focusing their efforts? What strategies are the experts seeing get the best results? Get up-to-speed with the latest industry insights, trends and predictions for the future in this panel discussion with some leading digital marketing experts.
The Secret to Engaging Modern Consumers: Journey Mapping and Personalization
In today's digital landscape, understanding the customer's journey and delivering personalized experiences are paramount. This masterclass delves into the art of consumer journey mapping, a powerful technique that visualizes the entire customer experience across touchpoints. Attendees will learn how to create detailed journey maps, identify pain points, and uncover opportunities for optimization. The presentation also explores personalization strategies that leverage data and technology to tailor content, products, and experiences to individual customers. From real-time personalization to predictive analytics, attendees will gain insights into cutting-edge approaches that drive engagement and loyalty.
Key Takeaways:
Current consumer landscape; Steps to mapping an effective consumer journey; Understanding the value of personalization; Integrating mapping and personalization for success; Brands that are getting It right!; Best Practices; Future Trends
2. INTRODUCTION
• The word statistics has two meanings. That is we can
define Statistics in two senses.
Statistics defined in plural sense (As a data)
• In this sense, it is equivalent to referring to numerical
facts, figures or statistical data. i.e., the raw data
themselves, like statistics of births, statistics of
students, statistics of imports and exports, etc.
• Statistics defined as a method (Singular Sense)
• The second meaning of statistics refers to the science
or discipline of study.
• In this sense of the word, Statistics is defined as the
science of collecting, presenting, analyzing and
interpreting numerical data to make decisions.
3. Characteristics of statistics
• not all numerical data are statistics.
• Some of the characteristics which numerical data
must possess in order that they may be called
statistics are given below.
– Statistics should be numerically expressed
– They should be aggregates of facts
– They should be collected in a systematic manner
– They should be collected for a predetermined purpose
– They should be placed in relation to each other
– They should be enumerated or estimated according to
reasonable standards of accuracy
– Statistics should be affected to a marked extent by a
multiplicity of causes
• In general it can be said that all statistics are
numerical facts; but not all numerical facts are
statistics.
4. BASIC TERMINOLOGIES IN STATISTICS
1. Data: In Statistics, all conclusions are based on facts and the first
step in any statistical investigation is to collect a set of related
observations from which conclusions may be drawn.
• Such related observations that form the set are known as Data.
• The word data was obtained from the singular Latin word “datum
“to mean fact.
2. Population: The complete collection of individuals, objects, or
measurements that have a characteristic in common or totality
of related observations in a given study is described as a
population.
• The population that is being studied is also called the target
population.
• Population can be finite (limited in its size) or infinite
(unrestricted).
3. Sample: A sub group of the population that will be studied in
detail is called a Sample.
5. 4. Parameters: are statistical measures obtained from a population
data.
These measures may include the mean, variance, standard
deviation, etc. and are denoted by , etc. respectively.
4. Sample Statistic: a number computed from a sample data.
Sample Statistics are denoted by lower case letters of the
alphabet such as -the sample mean, - the sample variance, etc
5. Variable: is a characteristic under study that assumes different
values for different elements and most of the time variables are
denoted by the letters X, Y, Z, etc. Example 1.3: Height, Weight,
Age, Income, Expenditure, Grade, Intelligence, sex, color, etc.
6. Quantitative Variable: is variable that can be expressed
numerically such as height, weight, age, income,
expenditure, grade, family size, number of students in a class,
etc.
7. Qualitative Variable: is variable that cannot assume a numerical
value but can be classified into two or more nonnumeric
categories such as the gender of a person, the language in which
a book is written, hair color, and so on.
6. • Discrete Variable: is a variable whose values are
countable such as family size, number of students in a
class, etc. Its values are obtained by counting.
• Continuous Variable: is a variable which can,
theoretically assume any numerical value between two
given values.
• Observation or Measurement: The value of a variable
for an element is called an Observation or
Measurement.
• Data Set: A data set is a collection of observations on
one or more variables.
• Sample Frame: A list of the entire population from
which items can be selected to form a sample is
referred to as sample frame.
7. 1.4. CLASSIFICATION OF STATISTICS
1. Descriptive Statistics consists of the collection,
organization, presentation and analysis of numerical data.
• It is concerned with describing certain characteristics of
a set of data (usually a sample) – that is, what it is
shaped like, what number the values tend to cluster
(converge) around, how much variation is present in
the data, and so forth.
• In short, Descriptive Statistics describes the nature or
characteristics of data without making conclusion or
generalization.
• Example 1.4: The average age of athletes participated
in London Marathon was 25 years, 80% of the
employees of the company are males, The marks of 50
students in Statistics course are found to range from 30
to 85, etc. are some examples of Descriptive Statistics.
8. 2. Inferential Statistics
• Inferential Statistics is concerned with the process
of drawing conclusions (inferences) about specific
characteristics of a population based on information
obtained from samples, performing hypothesis
testing, determining relationships among variables,
and making predictions.
• Example 1.5: - The result obtained from the
analysis of the income of 100 randomly selected
citizens in Ethiopia suggests that the average per
capita income of a citizen in Ethiopia is 30 Birr.
• The average income of all families in Ethiopia can be
estimated from figures obtained from a few
hundred families.
9. 1.5 STEPS OF STATISTICAL INVESTIGATION
1. Collection of data
2. Organization of data
3. Presentation
4. Analysis of Data
5. Interpretation of data
10. 1. Collection of data
• This is the process of obtaining measurements or
counts and constitutes the first step in statistical
investigation.
• In general, information pertinent to the underlying
investigation is collected.
• Valid conclusions can only result from properly
collected data. i.e., if data are faulty, the
conclusions drawn can never be reliable.
• Hence, utmost care must be exercised in collecting
data because they form the foundation of statistical
analysis
11. 2. Organization of data
• Collected data have to be organized in a suitable form so that
one can have a general understanding of the information
gathered. A large mass of figures that are collected from
surveys frequently need organization
• The first step in organizing a group of data is editing. The
collected data must be edited very carefully so that
omissions, inconsistencies, irrelevant answers and wrong
computations in the returns from a survey may be corrected
or adjusted
• The next step is to classify the data. The purpose of data
classification is to arrange them according to some common
Characteristics possessed by the items constituting the data
• The last step in data organization is tabulation. The purpose
of tabulation is to arrange the data in columns and rows so
that there is absolute clarity in the data presented.
12. 3. Presentation
• The main purpose of data presentation is to facilitate
statistical analysis.
• This can be done by arranging the data using graphs
and diagrams.
4. Analysis of Data
• This is the extraction of summarized and
comprehensible numerical descriptions of the data
where these measures will in turn give a far better
understanding of the nature of the data.
• The purpose of analyzing data is to dig out information
useful for decision making
• The most commonly used methods of statistical
analysis are measures of central tendency, measures of
variation, correlation, regression, estimation and
hypothesis testing
13. 5. Interpretation of data
• Is the task of drawing conclusions from the analysis
of the data and usually involves the formulation of
predictions concerning a large collection of
objects from information available for a small
collection of similar objects.
• This step usually involves decision making about a
large collection of objects (Population) and about
information gathered from a small collection of
similar objects (sample).
• The interpretation of data is a difficult task and
necessitates a high degree of skill and experience.
14. 1.6 APPLICATIONS OF STATISTICS
• The study of statistics has become more popular than ever
during the past three decades or so.
• The increasing availability of computers and statistical soft
ware packages has enlarged the role of statistics as a tool for
empirical research.
• As a result, statistics is used for research in almost all
professions, from medicine to sports, Today college students
in almost all disciplines are required to take at least one
statistics course.
• So the various tools of statistics are being used to solve
problems in everyday life, in research, in marketing, in
planning, in production and quality control, and other areas.
• widely used in all areas of human knowledge and widely
applied in a variety of disciplines such as business, economics
and research.
15. 1.6.1 LIMITATION OF STATISTICS
i. It does not deal with individual values.
ii. It cannot deal with qualitative characteristic.
Statistics deals with quantitative characteristics
iii. Statistical conclusions are not universally true.
iv. Statistical interpretation requires a high degree of
skill and understanding of the subject.
v. Statistics can be misused. Statistics can be used to
establish wrong conclusions and, therefore, can be
used only by experts.
16. 1.6.2 USES OF STATISTICS
To present facts in a definite form
Statistics facilitates comparisons
Statistics gives guidance in the formulation of
suitable policies
Prediction
Statistical methods are very helpful in formulating
and testing hypothesis and to develop new
theories
Statistics in the sciences.
17. 1.7 SCALES OF MEASUREMENT
• Measurement can be defined as the assignment of numbers
to objects and events according to logically acceptable rules.
• The number system is highly logical and offers a multiplicity
of possibilities of further logical manipulations.
• A measurement scale should possess the following attributes
to allow for these logical manipulations
• Magnitude - quantity in which the attribute exists in various
instances of the phenomena.
• Equal intervals - It denotes that the magnitude of the
attribute represented by a unit of measurement on the scale
is equal regardless of where on the scale the unit falls.
• Absolute zero point - Is a value that indicates exists at that
point or nothing at all of the attribute being measured exists.
18. Types of Measurement
• 1. Nominal Scale (Classificatory Scale)
• It refers to the simple classification of objects or
items in to discrete groups which do not bear any
magnitude relations ships to one another.
• “Nominal” stands for “name” of category. The
nominal scale of measurement is used for
qualitative rather than quantitative data: blue,
green, red, male, female; marital status (married,
single, divorced, etc.); professional classification;
geographic classification; and so on.
19. • Ordinal Scale or Ranking Scale
• First it is nominal scale and here data elements may
be ordered according to their relative size or quality.
It means that ordinal scale is first of all, nominal but
most people would agree with the order in which
the categories were placed so, in ordinal scale
inequalities have a meaning the inequality signs ‘<’
or’>’ may assume any meaning like “strong than”,
“softer than”, “weaker than” etc.
• Ordinal scale reflects only magnitude and does not
possess the attribute of equal intervals or an
absolute zero point
20. • Interval Scale
• The interval scale possesses two out of three
important requirements of good measurement
scale i.e., magnitude and equal intervals but lacks
the real or absolute zero point.
• An interval scale is one, which provides equal
intervals from an arbitrary origin. An interval scale
not only orders according to the amount of the
attribute they represent, but also establishes equal
intervals between the units of measure. Equal
differences in the numbers represent equal
differences in the attribute being measured.
21. • Ratio Scale
• The scale of measurement which has all the three
attributes – magnitude, equal intervals and an
absolute zero point- is called a ratio scale addition,
subtraction, multiplication and division of the
numbers are appropriate
• Example 1.12:- All physical measurements, like
height, weight, etc.
- Number of students in various classes.
- Number of books possessed by students of a class, etc.