The document provides an overview of spectrophotometry and different types of spectrophotometers. It discusses how spectrophotometers work by using properties of light and its interaction with substances to determine presence or concentration. The key components of spectrophotometers are described including light sources, monochromators, sample holders, detectors, and reading systems. Different spectrophotometer types are examined such as colorimeters, flame photometers, and their measurement processes.


![ As a basic principle, light is considered to be a form of
electromagnetic energy. In space, it has a constant and universal
velocity [C] of approximately 3 x 10⁸ m/s.
In any other medium (transparent) through which light passes, its
velocity will be slightly lower and can be calculated by the
following equation:
Where:
Vo = Velocity at which light passes through the medium
n = Medium refraction index: whose value oscillates, in general, between 1.0
and 2.5.
9/27/2021 5](https://image.slidesharecdn.com/spectrophotometer2-220904164255-bdbe0655/75/spectrophotometer-2-pdf-5-2048.jpg)


![ The phenomena on which spectrophotometry is based are mainly
absorption and transmission.
In order to understand how, it is necessary to take Beer Lambert’s
law into account.
Beer Lambert’s Law. Also known as Beer’s law or Beer Lambert
Bouguer’s law, it identifies the relationship between the
concentration of the sample and the intensity of light transmitted
through it.
With regard to the law mentioned, there are two implicit
concepts: transmittance [T] and absorbance [A].
9/27/2021 12](https://image.slidesharecdn.com/spectrophotometer2-220904164255-bdbe0655/75/spectrophotometer-2-pdf-12-2048.jpg)
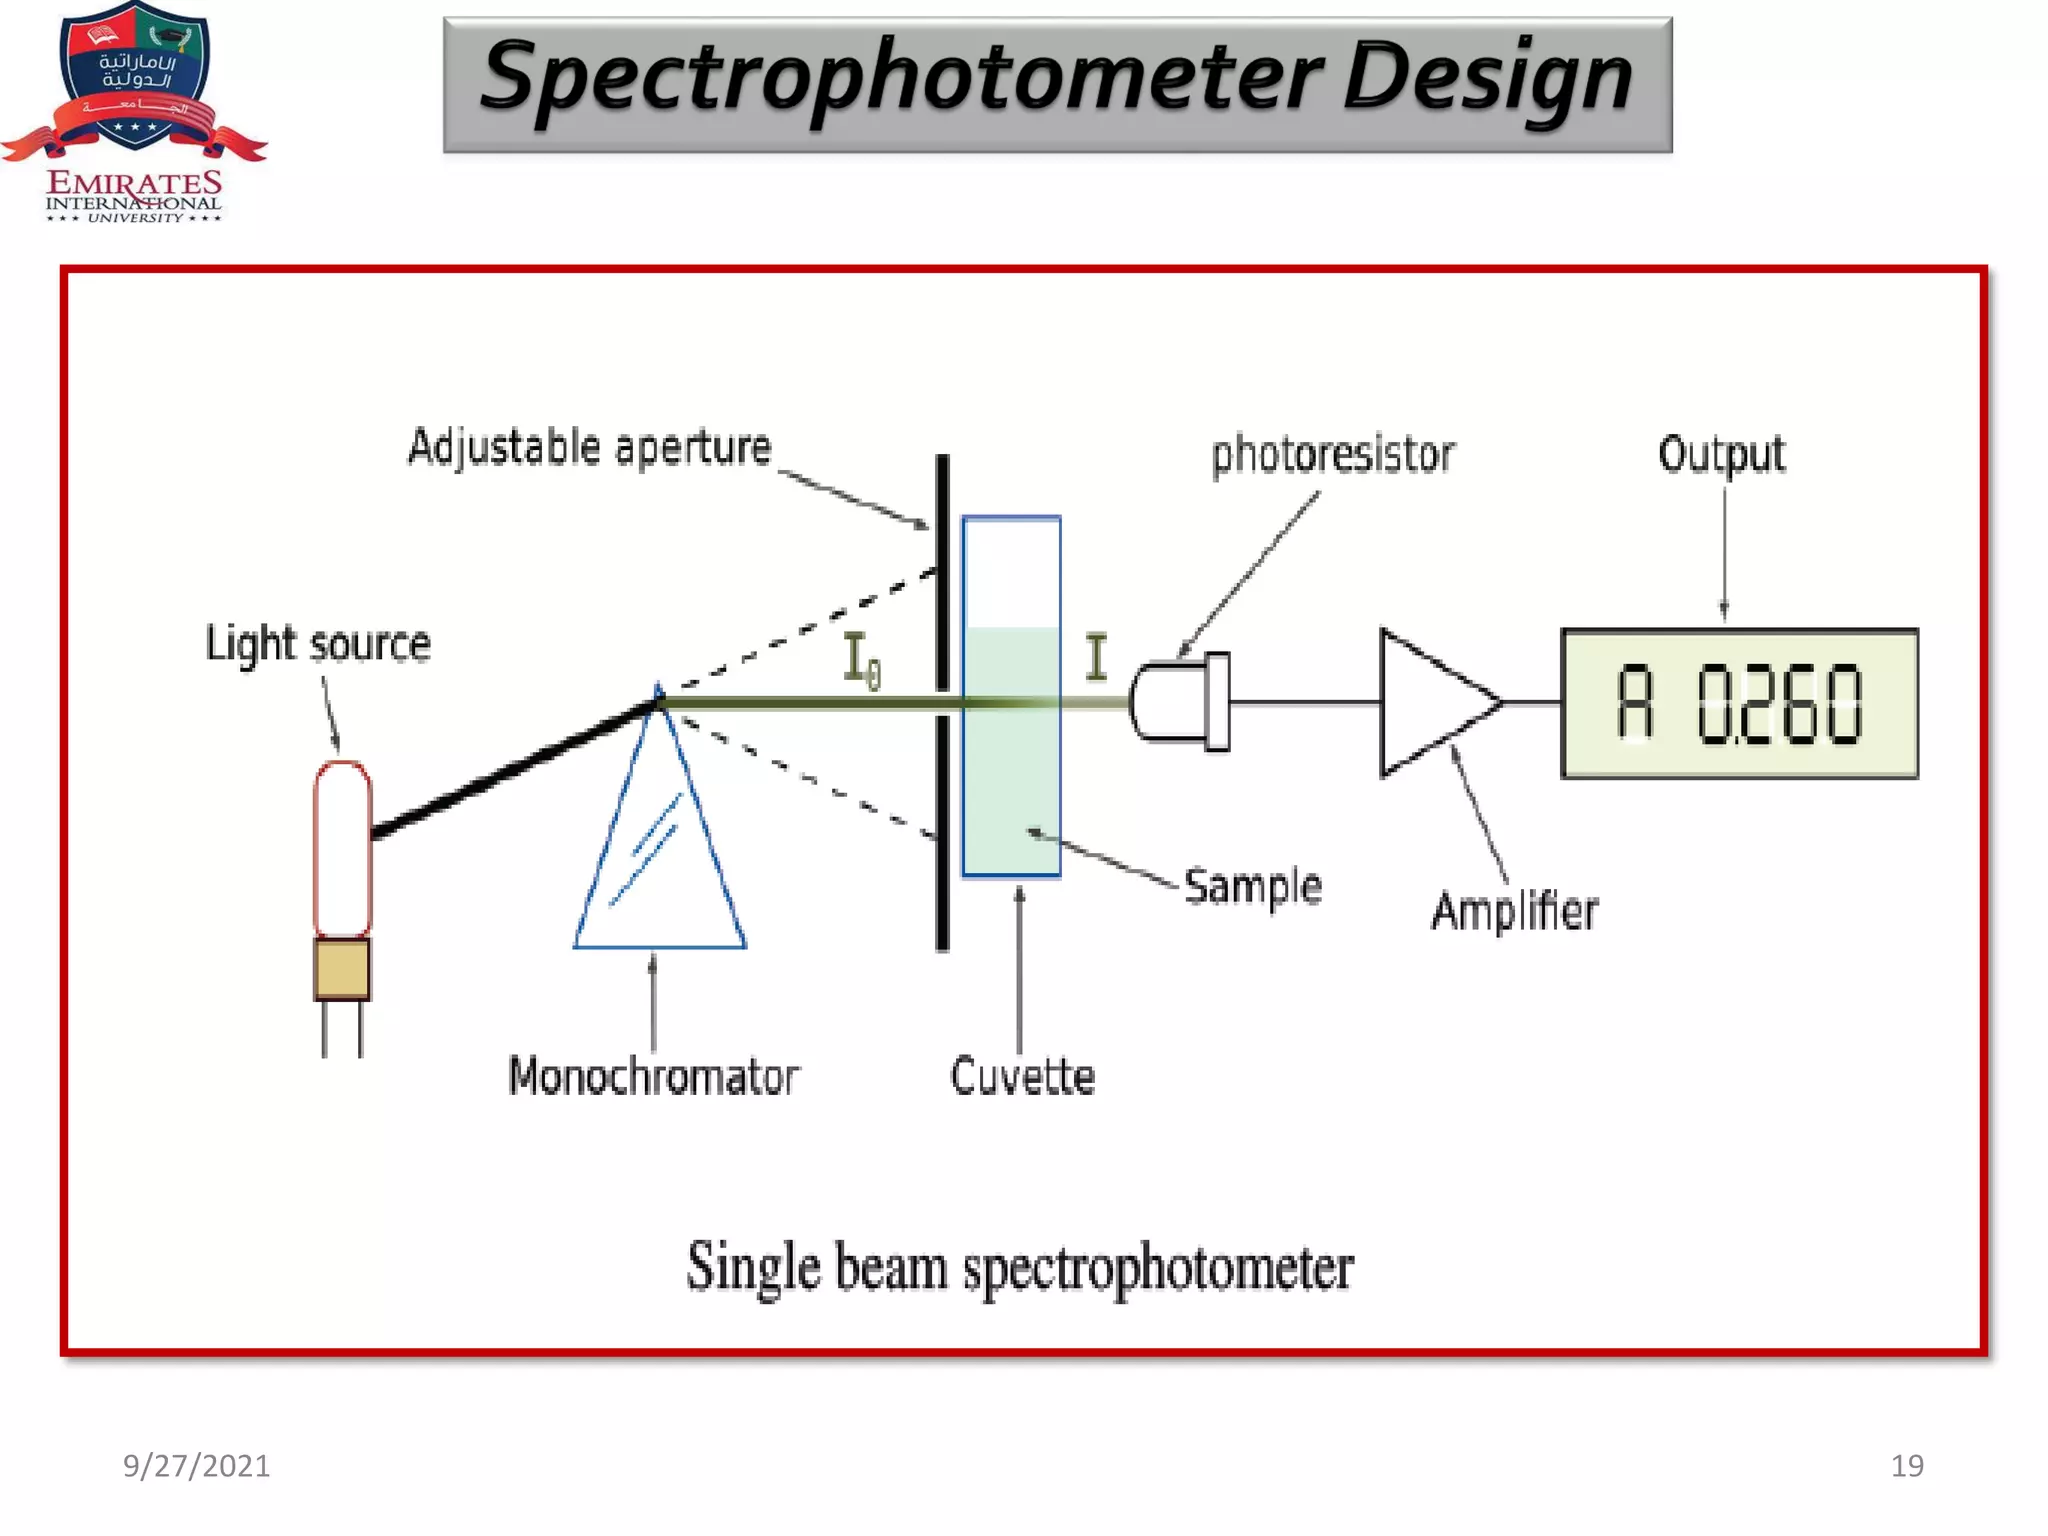
![ The transmittance [T] is the fraction of the incidental light of determined
wavelength passing through the sample.
Where:
It = intensity of the transmitted radiation
Io = intensity of the incidental radiation
The percentage of transmittance [%T] can be expressed by the following
equation:
Absorbance [A] is related to transmittance [T] through the following equation:
9/27/2021 13](https://image.slidesharecdn.com/spectrophotometer2-220904164255-bdbe0655/75/spectrophotometer-2-pdf-13-2048.jpg)
![ The concentration of light absorbing molecules in a sample is proportional to the
absorbance [A] of that sample. It is expressed mathematically as:
Where:
A = Absorbance measured
ε = Molécule absorbance coefficient [liters/moles/cm]
l = Distance of the trajectory traversed (path length) by the light in the
sample
c = Sample concentration [moles/liters]
9/27/2021 14](https://image.slidesharecdn.com/spectrophotometer2-220904164255-bdbe0655/75/spectrophotometer-2-pdf-14-2048.jpg)
![ The graphs demonstrated how absorbance [A] and transmittance [T] vary as a
function of the concentration [C] according to Beer Lambert’s law.
9/27/2021 15
Transmittance graph
Absorbance graph](https://image.slidesharecdn.com/spectrophotometer2-220904164255-bdbe0655/75/spectrophotometer-2-pdf-15-2048.jpg)