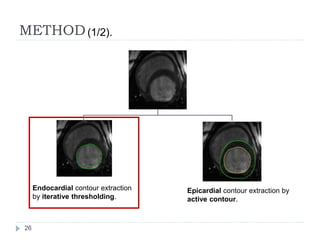
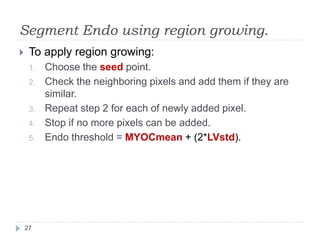
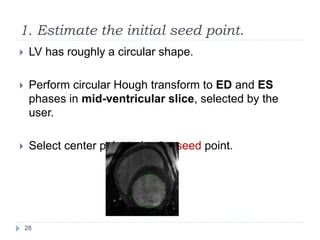
Automatic Left Ventricle Segmentation
Using Iterative Thresholding and an Active Contour
Model With Adaptation on Short-Axis Cardiac MRI
Presented by:
• Basma Gad El Mola
• Maha Saad
Under supervision of :
Prof. Dr. Aliaa Yousef
1
AGENDA
 Scientific and Medical Background
1. What is Image segmentation?
2. Image segmentation Applications
3. Image Segmentation Techniques
4. What is Cardiac anatomy
5. MRI applied on Cardiac
2
AGENDA (Cont.)
 Paper contents
1. Introduction
2. Related Work
3. Automatic LV Segmentation
4. Experiments and Results
5. Conclusion
6. References
3
1- What is Image segmentation
 Segmentation refers to
the process of partitioning
a digital image into
multiple regions (sets of
pixels).
4
2- Image segmentation Applications
 Grouping in vision
determine image regions
figure
ground
separation
group
frames into
slots
5
2- Image segmentation Applications
Iris Recognition
Face
Recognition
Fingerprint
Recognition
 Recognition Tasks
6
2- Image segmentation Applications
 Medical
Imaging
Locate tumors and other
pathologies
Measure tissue volumes Computer-guided surgery
7
3-Image Segmentation Techniques
 Image segmentation depends on lot of factors:
1. Homogeneity of images
2. Texture
3. image content
SO,
 There is no single method which can be considered
good for all type of images.
 And not all methods equally good for a particular
type of image.
8
3-Image segmentation Techniques
 image segmentation approaches divided into
following categories, based on two properties of
image:
1. Detecting Discontinuities
 It means to partition an image based on abrupt changes
in intensity
 this includes image segmentation algorithms like edge
detection.
2. Detecting Similarities
 It means to partition an image into regions that are similar
according to a set of predefined criterion.
 This includes image segmentation algorithms like
Thresholding, region growing, region splitting and
merging.9
3-Image segmentation Techniques
segmentatio
n
Techniques
Edge
detection
Region
growing
Classifiers
Clustering
Method
Region-
based
10
3-Image segmentation Techniques
 Region growing
 Method Description:
Region growing is a technique for extracting a region of the
image that is connected based on some predefined criteria.
This criteria can be based on intensity information and/or
edges in the image
 Limitation:
Its primary disadvantage is that it requires manual in-
traction to obtain the seed point. Thus, for each region that
needs to be extracted, a seed must be planted
3-Image segmentation Techniques
 Classifiers
 Method Description:
Classifiers are known as supervised methods since they
require training data that are manually segmented and then
used as references for automatically segmenting new data.
 Limitation:
A disadvantage of classifiers is that they generally do not
perform any spatial modeling. This weakness has been
addressed in recent work extending classifier methods to
segmenting images that are corrupted by intensity in
homogeneities
3-Image segmentation Techniques
 Clustering Approach
 Method Description:
Assumes that each region in the image forms a separate
cluster in the feature space. Can be generally broken into two
steps(1) categorize the points in the feature space into
clusters;(2)map the clusters back to the spatial domain to
form separate regions
 Limitation:
1. How to determine the number of clusters
3-Image segmentation Techniques
 Method
 Method Description:
Requires that the histogram of an image has a number of
peaks, each corresponds to a region
 Limitation:
(1) Does not work well for an image without any obvious
peaks or with broad and flat valleys.
3-Image segmentation Techniques
 Region-based Approaches
 Method Description:
Group pixels into homogeneous regions. Including region
growing, region splitting, region merging or their
combination
 Limitation:
(1) Are by nature sequential and quite expensive both in
computational time and memory
3-Image segmentation Techniques
 Edge detection approaches
 Method Description:
Based on the detection of discontinuity, normally tries to
locate points with more or less abrupt changes in gray level.
 Limitation:
(1) Does not work well with images in which the edges are
ill-defined or there are too many edges
(2) It is not a trivial job to produce a closed curve or
boundary
4 -What is Cardiac anatomy
17
5-MRI applied on Cardiac
18
Automatic Left Ventricle Segmentation
Using Iterative Thresholding and an Active Contour
Model With Adaptation on Short-Axis Cardiac MRI
19
1. Introduction
 The quantification of myocardial mass and systolic
function is performed for cardiac diagnose.
 Medical Images used for measure cardiac function:
( MRI – CT – Ultrasound – X-Ray - SPECT)
 An Automatic LV segmentation algorithm for cardiac
cine MRI images using Iterative Thresholding and an
Active Contour Model with Adaptation (ITHACA) is
presented.
 We measured the blood volume and the
myocardial mass of the LV using our ITHACA
segmentation algorithm & compared this to
manual tracing and the commercially available
MASS analysis software.
20
2-Related Work
 cardiac LV segmentation methods using MRI
can be categorized as follows:
1. Traditional segmentation
2. Graph-based segmentation
3. Active shape model (ASM)
4. Level-set algorithm
 Much research has been performed in LV
segmentation. Each algorithm has tradeoffs
among time complexity, inter- or intra-
operator variation, and accuracy in clinical
practice. These algorithms have not
segmented PTMs in detail.
21
2-Related Work
1) Traditional Segmentation Algorithms
 Such as (Thresholding – Region growing – Edge-detection –
Clustering)
 These algorithms require significant user-interaction to segment
LV.
 So, They have been combined with other segmentation
techniques to minimize User-intervention
 These Algorithms works will for mid-ventricle slices of LV, but
have problems in basal and apical slices
 They also unable to segment the detailed papillary and trabecular
muscles(PTMs)
2-Related Work
2) Graph-based segmentation algorithms
 create a graph with an assigned cost in each
pixel or node
 Then find a minimum cost path using graph-
searching algorithms
 These methods are unable to accurately
segment complex cardiac structures such as
PTMs
 have difficulties in the basal and apical slices
2-Related Work
3) Active shape model (ASM)
 ACMs segment objects through energy minimization
of internal forces such as rigidity and elasticity, and
external forces such as edges.
 Contour initiation is critical to the success of ACM
segmentation.
 ACMs have difficulty with low contrast images.
 It impose high computational costs for iterative
procedures.
 Have limitations in extracting the details of PTMs
2-Related Work
4) Level-set algorithm
 well-established method to segment objects in noisy
data
 has difficulty in determining the stopping term,
requires strong initialization of segmenting objects.
 Have high computational costs.
 In summary, much research has been performed in
LV segmentation. Each algorithm has tradeoffs
among time complexity, inter- or intra-operator
variation, and accuracy in clinical practice. These
algorithms have not segmented PTMs in detail
METHOD
Endocardial contour extraction
by iterative thresholding.
Epicardial contour extraction by
active contour.
(1/2).
26
Segment Endo using region growing.
 To apply region growing:
1. Choose the seed point.
2. Check the neighboring pixels and add them if they are
similar.
3. Repeat step 2 for each of newly added pixel.
4. Stop if no more pixels can be added.
5. Endo threshold = MYOCmean + (2*LVstd).
27
1. Estimate the initial seed point.
 LV has roughly a circular shape.
 Perform circular Hough transform to ED and ES
phases in mid-ventricular slice, selected by the
user.
 Select center point to be the seed point.
28
2. Mean and Standard Deviation of
Blood Signal Estimation
 Edge-based region-growing from the seed point is
applied to find LV region that is nearly full-blood.
 The mean and standard deviation of this region is
calculated(LVmean, LVstd).
29
3. Myoc Signal Intensity Estimation.
 Successive lower-bound threshold-based region-growing is
applied.
with same seed point of step 1.
 Threshold = LVmean /i
 Start at i =1 then i increments by 0.1 each iteration.
 Sudden increase threshold is one standard deviation away from
MYOCmean30
4. Endo Segmentation.
 Apply region growing to Segment Endo with:
 Seed point = center of image’s circular Hough transform
 Threshold = MYOCmean + (2*LVstd).
31
5. Remaining images segmentation.
 A seed propagation technique is applied for remaining
images.
 By examining an 11 × 11 pixel window, whose center is the
center of gravity of the segmented LV region in the previous
image.
 The pixel with the lowest energy is chosen as the seed point.
 Repeat step 2,3 and 4 for remaining images.
32
6. LV Volume Measurement
 The total blood volume of the segmented LV is
calculated from:
 x is intensity.
 h(x) is the histogram.
 w(x) is the weighting function used for calculating
partial voxel effects.
33
METHOD
Endocardial contour extraction
by iterative thresholding.
Epicardial contour extraction by
active contour.
(2/2).
34
Active Contour Model (Snake).
 Introduced by Kass and Terzopoulos in 1987.
 Based on energy minimization.
 Energy minimization are used to compute the
equilibrium configuration.
 The final position of the contour will have a minimum
energy (Emin).
35
Snake energy.
EElastic
EBlending
EExternal
ESnake
EConstraintsEInternal
36
1. Circular Map Generation.
 Since the LV has roughly a circular shape
37
2. Edge Information Extraction and Filtering.
 Use the Canny edge extractor to extract edges.
 Edge information that comes from the endocardial
region is filtered out.
38
3.1. Modified External Force .
 If a contour is seeded in zero gradient, areas, there
will be no sufficient external force to move the
contour.
 Gradients less than threshold are set to the closest
values (along increasing radius) greater than the
threshold.
39
3.2. Movement Constraint Definition.
1. The contour is initialized at the endocardial border.
2. The initialized contour should move iteratively in
the direction of increasing radius r.
3. To constraint contour movement
MYOCmax = MYOCmean + 2* LVstd.
Due to intensity variation of myocardium
MYOCmin = MYOCmean * 0.4 Regions
of signal intensity over or below MYOCmin.
40
4. Active Contour Model Segmentation.
 The contour only moves in the radial direction .
 Stops if it meets the movement constraint.
 The average difference between contour points
before and after each iteration is calculated .
 Iteration is stopped if the average difference is below
0.01 pixels, which means that the internal and
external energy is minimized.
41
5. Epicardial Contour Updating and
Coordinate Transform).
 Epicardial contour can have zigzag patterns, a low-
pass filter is applied to make it smooth.
 Then, the epicardial contour is transformed to
Cartesian domain again.
42
EXPERIMENTS AND RESULTS.
 Data was acquired from 38 patients (15 males, their
age: 52.4 ±15.1 years).
 The LV was imaged in 610 slices, 2028 phases.
 A total of 339 images were segmented by ITHACA
then results compared to both manual tracing and
the commercial MASS software.
 Manual tracing was performed by an experienced
physician.
43
EXPERIMENTS AND RESULTS Cont...
Metric Manual tracing ITHACA segmentation MASS software
Blood
volume
144.5 mL ±50.0 141.6 mL ±48.7 164.5 mL ±55.1
Myocardial
mass
128.1 ± 50.9 g 128.9 ± 49.0 g 129.1 ± 57.5 g
Manual intervention ITHACA segmentation MASS software
At some basal-most
slices
4.7% 5.0%
Generating endocardial
contour in most apical
slices
Doesn’t require Requires manual
intervention
Generating epicardial
contour
1.5% 51.6%
44
CONCLUSION.
 ITHACA is a new algorithm introduced to
automatically segment LV.
 Iterative Thresholding is used to identify the
Endocardial then ACM is used to identify the
Epicardial.
 ITHACA provided substantial improvement over the
commercial MASS software in LV segmentation.
 Future work will consider automation at basal slices.
45
REFERENCES:
 H. Lee , N. Codella , M. Cham , J. Weinsaft and Y. Wang "Automatic
left ventricle segmentation using iterative thresholding and active
contour model with adaptation on short-axis cardiac MRI", IEEE
Trans. Biomed. Eng., vol. 57, no. 4, pp.905 -913 2010
 N. Codella, J. W. Weinsaft, M. D. Cham, M. Janik, M. R. Prince, and
Y. Wang, “Left ventricle: Automated segmentation by using
myocardial effusion threshold reduction and intra-voxel computation
atMR imaging,” Radiology, vol. 248, no. 3, pp. 1004–1012, Sep.
2008.
 AbhishekChandale,Divakarsingh “ Comparative Study of
Different Technique for Medical Image Segmentation: A Survey”, vol.
11,No. 1,pp. 2196-2174,Sep.2013
 Rajeshwar Dass, Priyanka, Swapna Devi” Image Segmentation
Techniques”, IJECT Vol. 3, Issue 1, Jan. - March 2012
46
47

Automatic left ventricle segmentation

  • 1.
    Automatic Left VentricleSegmentation Using Iterative Thresholding and an Active Contour Model With Adaptation on Short-Axis Cardiac MRI Presented by: • Basma Gad El Mola • Maha Saad Under supervision of : Prof. Dr. Aliaa Yousef 1
  • 2.
    AGENDA  Scientific andMedical Background 1. What is Image segmentation? 2. Image segmentation Applications 3. Image Segmentation Techniques 4. What is Cardiac anatomy 5. MRI applied on Cardiac 2
  • 3.
    AGENDA (Cont.)  Papercontents 1. Introduction 2. Related Work 3. Automatic LV Segmentation 4. Experiments and Results 5. Conclusion 6. References 3
  • 4.
    1- What isImage segmentation  Segmentation refers to the process of partitioning a digital image into multiple regions (sets of pixels). 4
  • 5.
    2- Image segmentationApplications  Grouping in vision determine image regions figure ground separation group frames into slots 5
  • 6.
    2- Image segmentationApplications Iris Recognition Face Recognition Fingerprint Recognition  Recognition Tasks 6
  • 7.
    2- Image segmentationApplications  Medical Imaging Locate tumors and other pathologies Measure tissue volumes Computer-guided surgery 7
  • 8.
    3-Image Segmentation Techniques Image segmentation depends on lot of factors: 1. Homogeneity of images 2. Texture 3. image content SO,  There is no single method which can be considered good for all type of images.  And not all methods equally good for a particular type of image. 8
  • 9.
    3-Image segmentation Techniques image segmentation approaches divided into following categories, based on two properties of image: 1. Detecting Discontinuities  It means to partition an image based on abrupt changes in intensity  this includes image segmentation algorithms like edge detection. 2. Detecting Similarities  It means to partition an image into regions that are similar according to a set of predefined criterion.  This includes image segmentation algorithms like Thresholding, region growing, region splitting and merging.9
  • 10.
  • 11.
    3-Image segmentation Techniques Region growing  Method Description: Region growing is a technique for extracting a region of the image that is connected based on some predefined criteria. This criteria can be based on intensity information and/or edges in the image  Limitation: Its primary disadvantage is that it requires manual in- traction to obtain the seed point. Thus, for each region that needs to be extracted, a seed must be planted
  • 12.
    3-Image segmentation Techniques Classifiers  Method Description: Classifiers are known as supervised methods since they require training data that are manually segmented and then used as references for automatically segmenting new data.  Limitation: A disadvantage of classifiers is that they generally do not perform any spatial modeling. This weakness has been addressed in recent work extending classifier methods to segmenting images that are corrupted by intensity in homogeneities
  • 13.
    3-Image segmentation Techniques Clustering Approach  Method Description: Assumes that each region in the image forms a separate cluster in the feature space. Can be generally broken into two steps(1) categorize the points in the feature space into clusters;(2)map the clusters back to the spatial domain to form separate regions  Limitation: 1. How to determine the number of clusters
  • 14.
    3-Image segmentation Techniques Method  Method Description: Requires that the histogram of an image has a number of peaks, each corresponds to a region  Limitation: (1) Does not work well for an image without any obvious peaks or with broad and flat valleys.
  • 15.
    3-Image segmentation Techniques Region-based Approaches  Method Description: Group pixels into homogeneous regions. Including region growing, region splitting, region merging or their combination  Limitation: (1) Are by nature sequential and quite expensive both in computational time and memory
  • 16.
    3-Image segmentation Techniques Edge detection approaches  Method Description: Based on the detection of discontinuity, normally tries to locate points with more or less abrupt changes in gray level.  Limitation: (1) Does not work well with images in which the edges are ill-defined or there are too many edges (2) It is not a trivial job to produce a closed curve or boundary
  • 17.
    4 -What isCardiac anatomy 17
  • 18.
    5-MRI applied onCardiac 18
  • 19.
    Automatic Left VentricleSegmentation Using Iterative Thresholding and an Active Contour Model With Adaptation on Short-Axis Cardiac MRI 19
  • 20.
    1. Introduction  Thequantification of myocardial mass and systolic function is performed for cardiac diagnose.  Medical Images used for measure cardiac function: ( MRI – CT – Ultrasound – X-Ray - SPECT)  An Automatic LV segmentation algorithm for cardiac cine MRI images using Iterative Thresholding and an Active Contour Model with Adaptation (ITHACA) is presented.  We measured the blood volume and the myocardial mass of the LV using our ITHACA segmentation algorithm & compared this to manual tracing and the commercially available MASS analysis software. 20
  • 21.
    2-Related Work  cardiacLV segmentation methods using MRI can be categorized as follows: 1. Traditional segmentation 2. Graph-based segmentation 3. Active shape model (ASM) 4. Level-set algorithm  Much research has been performed in LV segmentation. Each algorithm has tradeoffs among time complexity, inter- or intra- operator variation, and accuracy in clinical practice. These algorithms have not segmented PTMs in detail. 21
  • 22.
    2-Related Work 1) TraditionalSegmentation Algorithms  Such as (Thresholding – Region growing – Edge-detection – Clustering)  These algorithms require significant user-interaction to segment LV.  So, They have been combined with other segmentation techniques to minimize User-intervention  These Algorithms works will for mid-ventricle slices of LV, but have problems in basal and apical slices  They also unable to segment the detailed papillary and trabecular muscles(PTMs)
  • 23.
    2-Related Work 2) Graph-basedsegmentation algorithms  create a graph with an assigned cost in each pixel or node  Then find a minimum cost path using graph- searching algorithms  These methods are unable to accurately segment complex cardiac structures such as PTMs  have difficulties in the basal and apical slices
  • 24.
    2-Related Work 3) Activeshape model (ASM)  ACMs segment objects through energy minimization of internal forces such as rigidity and elasticity, and external forces such as edges.  Contour initiation is critical to the success of ACM segmentation.  ACMs have difficulty with low contrast images.  It impose high computational costs for iterative procedures.  Have limitations in extracting the details of PTMs
  • 25.
    2-Related Work 4) Level-setalgorithm  well-established method to segment objects in noisy data  has difficulty in determining the stopping term, requires strong initialization of segmenting objects.  Have high computational costs.  In summary, much research has been performed in LV segmentation. Each algorithm has tradeoffs among time complexity, inter- or intra-operator variation, and accuracy in clinical practice. These algorithms have not segmented PTMs in detail
  • 26.
    METHOD Endocardial contour extraction byiterative thresholding. Epicardial contour extraction by active contour. (1/2). 26
  • 27.
    Segment Endo usingregion growing.  To apply region growing: 1. Choose the seed point. 2. Check the neighboring pixels and add them if they are similar. 3. Repeat step 2 for each of newly added pixel. 4. Stop if no more pixels can be added. 5. Endo threshold = MYOCmean + (2*LVstd). 27
  • 28.
    1. Estimate theinitial seed point.  LV has roughly a circular shape.  Perform circular Hough transform to ED and ES phases in mid-ventricular slice, selected by the user.  Select center point to be the seed point. 28
  • 29.
    2. Mean andStandard Deviation of Blood Signal Estimation  Edge-based region-growing from the seed point is applied to find LV region that is nearly full-blood.  The mean and standard deviation of this region is calculated(LVmean, LVstd). 29
  • 30.
    3. Myoc SignalIntensity Estimation.  Successive lower-bound threshold-based region-growing is applied. with same seed point of step 1.  Threshold = LVmean /i  Start at i =1 then i increments by 0.1 each iteration.  Sudden increase threshold is one standard deviation away from MYOCmean30
  • 31.
    4. Endo Segmentation. Apply region growing to Segment Endo with:  Seed point = center of image’s circular Hough transform  Threshold = MYOCmean + (2*LVstd). 31
  • 32.
    5. Remaining imagessegmentation.  A seed propagation technique is applied for remaining images.  By examining an 11 × 11 pixel window, whose center is the center of gravity of the segmented LV region in the previous image.  The pixel with the lowest energy is chosen as the seed point.  Repeat step 2,3 and 4 for remaining images. 32
  • 33.
    6. LV VolumeMeasurement  The total blood volume of the segmented LV is calculated from:  x is intensity.  h(x) is the histogram.  w(x) is the weighting function used for calculating partial voxel effects. 33
  • 34.
    METHOD Endocardial contour extraction byiterative thresholding. Epicardial contour extraction by active contour. (2/2). 34
  • 35.
    Active Contour Model(Snake).  Introduced by Kass and Terzopoulos in 1987.  Based on energy minimization.  Energy minimization are used to compute the equilibrium configuration.  The final position of the contour will have a minimum energy (Emin). 35
  • 36.
  • 37.
    1. Circular MapGeneration.  Since the LV has roughly a circular shape 37
  • 38.
    2. Edge InformationExtraction and Filtering.  Use the Canny edge extractor to extract edges.  Edge information that comes from the endocardial region is filtered out. 38
  • 39.
    3.1. Modified ExternalForce .  If a contour is seeded in zero gradient, areas, there will be no sufficient external force to move the contour.  Gradients less than threshold are set to the closest values (along increasing radius) greater than the threshold. 39
  • 40.
    3.2. Movement ConstraintDefinition. 1. The contour is initialized at the endocardial border. 2. The initialized contour should move iteratively in the direction of increasing radius r. 3. To constraint contour movement MYOCmax = MYOCmean + 2* LVstd. Due to intensity variation of myocardium MYOCmin = MYOCmean * 0.4 Regions of signal intensity over or below MYOCmin. 40
  • 41.
    4. Active ContourModel Segmentation.  The contour only moves in the radial direction .  Stops if it meets the movement constraint.  The average difference between contour points before and after each iteration is calculated .  Iteration is stopped if the average difference is below 0.01 pixels, which means that the internal and external energy is minimized. 41
  • 42.
    5. Epicardial ContourUpdating and Coordinate Transform).  Epicardial contour can have zigzag patterns, a low- pass filter is applied to make it smooth.  Then, the epicardial contour is transformed to Cartesian domain again. 42
  • 43.
    EXPERIMENTS AND RESULTS. Data was acquired from 38 patients (15 males, their age: 52.4 ±15.1 years).  The LV was imaged in 610 slices, 2028 phases.  A total of 339 images were segmented by ITHACA then results compared to both manual tracing and the commercial MASS software.  Manual tracing was performed by an experienced physician. 43
  • 44.
    EXPERIMENTS AND RESULTSCont... Metric Manual tracing ITHACA segmentation MASS software Blood volume 144.5 mL ±50.0 141.6 mL ±48.7 164.5 mL ±55.1 Myocardial mass 128.1 ± 50.9 g 128.9 ± 49.0 g 129.1 ± 57.5 g Manual intervention ITHACA segmentation MASS software At some basal-most slices 4.7% 5.0% Generating endocardial contour in most apical slices Doesn’t require Requires manual intervention Generating epicardial contour 1.5% 51.6% 44
  • 45.
    CONCLUSION.  ITHACA isa new algorithm introduced to automatically segment LV.  Iterative Thresholding is used to identify the Endocardial then ACM is used to identify the Epicardial.  ITHACA provided substantial improvement over the commercial MASS software in LV segmentation.  Future work will consider automation at basal slices. 45
  • 46.
    REFERENCES:  H. Lee, N. Codella , M. Cham , J. Weinsaft and Y. Wang "Automatic left ventricle segmentation using iterative thresholding and active contour model with adaptation on short-axis cardiac MRI", IEEE Trans. Biomed. Eng., vol. 57, no. 4, pp.905 -913 2010  N. Codella, J. W. Weinsaft, M. D. Cham, M. Janik, M. R. Prince, and Y. Wang, “Left ventricle: Automated segmentation by using myocardial effusion threshold reduction and intra-voxel computation atMR imaging,” Radiology, vol. 248, no. 3, pp. 1004–1012, Sep. 2008.  AbhishekChandale,Divakarsingh “ Comparative Study of Different Technique for Medical Image Segmentation: A Survey”, vol. 11,No. 1,pp. 2196-2174,Sep.2013  Rajeshwar Dass, Priyanka, Swapna Devi” Image Segmentation Techniques”, IJECT Vol. 3, Issue 1, Jan. - March 2012 46
  • 47.

Editor's Notes

  • #11 Edge detection approaches Method Description: Based on the detection of discontinuity, normally tries to locate points with more or less abrupt changes in gray level. Usually classified into two categories: sequential and parallel Limitation: Does not work well with images in which the edges are ill-defined or there are too many edges It is not a trivial job to produce a closed curve or boundary Less immune to noise than other techniques, e.g., and clustering Region growing Method Description: Region growing is a technique for extracting a region of the image that is connected based on some predefined criteria. This criteria can be based on intensity information and/or edges in the image Limitation: Its primary disadvantage is that it requires manual in-traction to obtain the seed point. Thus, for each region that needs to be extracted, a seed must be planted Classifiers Method Description: Classifiers are known as supervised methods since they require training data that are manually segmented and then used as references for automatically segmenting new data. Limitation: A disadvantage of classifiers is that they generally do not perform any spatial modeling. This weakness has been addressed in recent work extending classifier methods to segmenting images that are corrupted by intensity in homogeneities Clustering Approach Method Description: Assumes that each region in the image forms a separate cluster in the feature space. Can be generally broken into two steps categorize the points in the feature space into clusters; map the clusters back to the spatial domain to form separate regions Limitation: How to determine the number of clusters Features are often image dependent and how to select features so as to obtain satisfactory segmentation results remains unclear Does not utilize spatial Information Method Method Description: Requires that the histogram of an image has a number of peaks, each corresponds to a region Limitation: Does not work well for an image without any obvious peaks or with broad and flat valleys. Does not consider the spatial details, so cannot guarantee that the segmented regions are contiguous Region-based Approaches Method Description: Group pixels into homogeneous regions. Including region growing, region splitting, region merging or their combination Limitation: Are by nature sequential and quite expensive both in computational time and memory Region growing has inherent dependence on the selection of seed region and the order in which pixels and regions are examined.
  • #21 Cardiac disease is the leading cause of death todays. To diagnose a variety of cardiac pathologies ,The quantification of myocardial mass and systolic function is routinely performed in the clinical setting cardiac function quantification require taking images by using : Magnetic Resonance Imaging (MRI) computed tomography (CT) Ultrasound X-ray Single photon emission computed tomography (SPECT) MRI Advantages: the lack of ionizing radiation exposure The lack of nephrotoxic contrast injection the lack of geometric assumptions during volume measurements The left ventricle (LV) is segmented to estimate: Stroke volume ejection fraction myocardial mass To segment the Endocardium :the threshold is determined iteratively by detecting the effusion into surrounding structures. To detect the Epicardial contour and the myocardium (Myoc) the active contour model (ACM) is applied.
  • #22 Traditional Segmentation Algorithms Such as (Thresholding – Region growing – Edge-detection – Clustering) These algorithms require significant user-interaction to segment LV. So, They have been combined with other segmentation techniques to minimize User-intervention. These Algorithms works well for mid-ventricle slices of LV, but have problems in basal and apical slices. They also unable to segment the detailed papillary and trabecular muscles(PTMs). Graph-based segmentation algorithms create a graph with an assigned cost in each pixel or node. Then find a minimum cost path using graph-searching algorithms. These methods are unable to accurately segment complex cardiac structures such as PTMs. have difficulties in the basal and apical slices. Active shape model (ASM) ACMs segment objects through energy minimization of internal forces such as rigidity and elasticity, and external forces such as edges. Contour initiation is critical to the success of ACM segmentation. ACMs have difficulty with low contrast images. It impose high computational costs for iterative procedures. Have limitations in extracting the details of PTMs. Level-set algorithm well-established method to segment objects in noisy data has difficulty in determining the stopping term, requires strong initialization of segmenting objects. Have high computational costs.
  • #28  Since the absolute threshold Myocmean + n × LVstd is larger than the intensity of the PTM area, the presented algorithm excludes the PTM areas. • How do we choose the seed(s) in practice ? - It depends on the nature of the problem. - If targets need to be detected using infrared images for example, choose the brightest pixel(s). - Without a-priori knowledge, compute the histogram and choose the gray-level values corresponding to the strongest peaks • How do we choose the similarity criteria (predicates)? - The homogeneity predicate can be based on any characteristic of the regions in the image such as * average intensity * variance * color * texture * motion * shape Size Edge based region growing   first the edges of the image are detected using any optimum edge operator. Then the edge region is detected. Edge region is defined as the place where the region growing seeds will be selected. Therefore the edge region should surround the single pixel edges derived by an edge operator. Then a region size comparing is done. Very small regions are removed from edge region are removed instead of merging. Thus the effect of noise is completely eliminated. When this is done, the image is segmented in two kinds of areas, one is edge region and another is homogeneous region. In this work first edge detection is performed, then edge region detection and then seeded region growing.
  • #30  Edge-based region growth (eight-connected two-dimensional)
  • #31 Use the same seed used in the second step. Initially start with threshold = Blmean and measure volume Then decrease threshold and measure volume untill sudden increase in volume accure  i = μb/threshold starts at 1.0 and increments by 0.1 each iteration and V is volume. The discontinuity of volume growth during increasing iis used to measure the threshold at which region growth has penetrated the myocardium with segmentation corresponding to mean divided by threshold at (d) 3.0 and (e) 3.1 arbitrary units
  • #32 Since the absolute threshold Myocmean + n × LVstd is larger than the intensity of the PTM area, the presented algorithm excludes the PTM areas.
  • #33 where p is the evaluated pixel position, Inew(p) is the intensity of the evaluated pixel, pCoG is the center-of-gravity of Lvregion in the previous image, w = 11is thewindow width in number of voxels, and σprev and μprev is the mean and standard deviation of LVregion in the previous image. The first term of the equation penalizes pixels that are far away from the current seed point, and the second term penalizes pixels that deviate from the current blood intensity mean.
  • #37 ACM 1) Initialization process 2) Deformation process 3) Termination * the ACM deformation stops when all the snaxels cannot find new better locations in the neighboring pixels. Nevertheless, if some snaxels oscillate or shifted along the boundary, the ACM might enter an infinity loop. Therefore, the definition of more managed and specific criterion for the ACM termination is required E internal Depends on the intrinsic properties of the curve E elastic The curve is treated as an elastic rubber band possessing elastic potential energy. It discourages stretching by introducing tension, Responsible for shrinking of the contour. E bending bending energy tries to smooth out the curve Bending energy is minimum for a circle. E External It is derived from the image. it assumes its smaller values at the features of interest, such as boundaries.  giving low values when the regularized gradient around the contour position reaches its peak value. E constraints Some systems allowed for user interaction to guide the snakes, not only in initial placement but also in their energy terms can be used to interactively guide the snakes towards or away from particular features.
  • #38 http://stackoverflow.com/questions/12924598/examples-to-convert-image-to-polar-coordinates-do-it-explicitly-want-a-slick-m (x, y) Cartesian image coordinates are converted to (radius r, radian θ) polar coordinates the center of the polar mapping is the center-of-mass from the endocardial region in Section III
  • #40 The threshold used in this study was 0.03
  • #41  This prior knowledge can be used to condition the external force for effectively moving the contour in the following manner.
  • #45 volume measured from the MASS software was substantially higher than that from manual tracing due to the inclusion of PTMs in the LV blood by the MASS software.