Download as PDF, PPTX
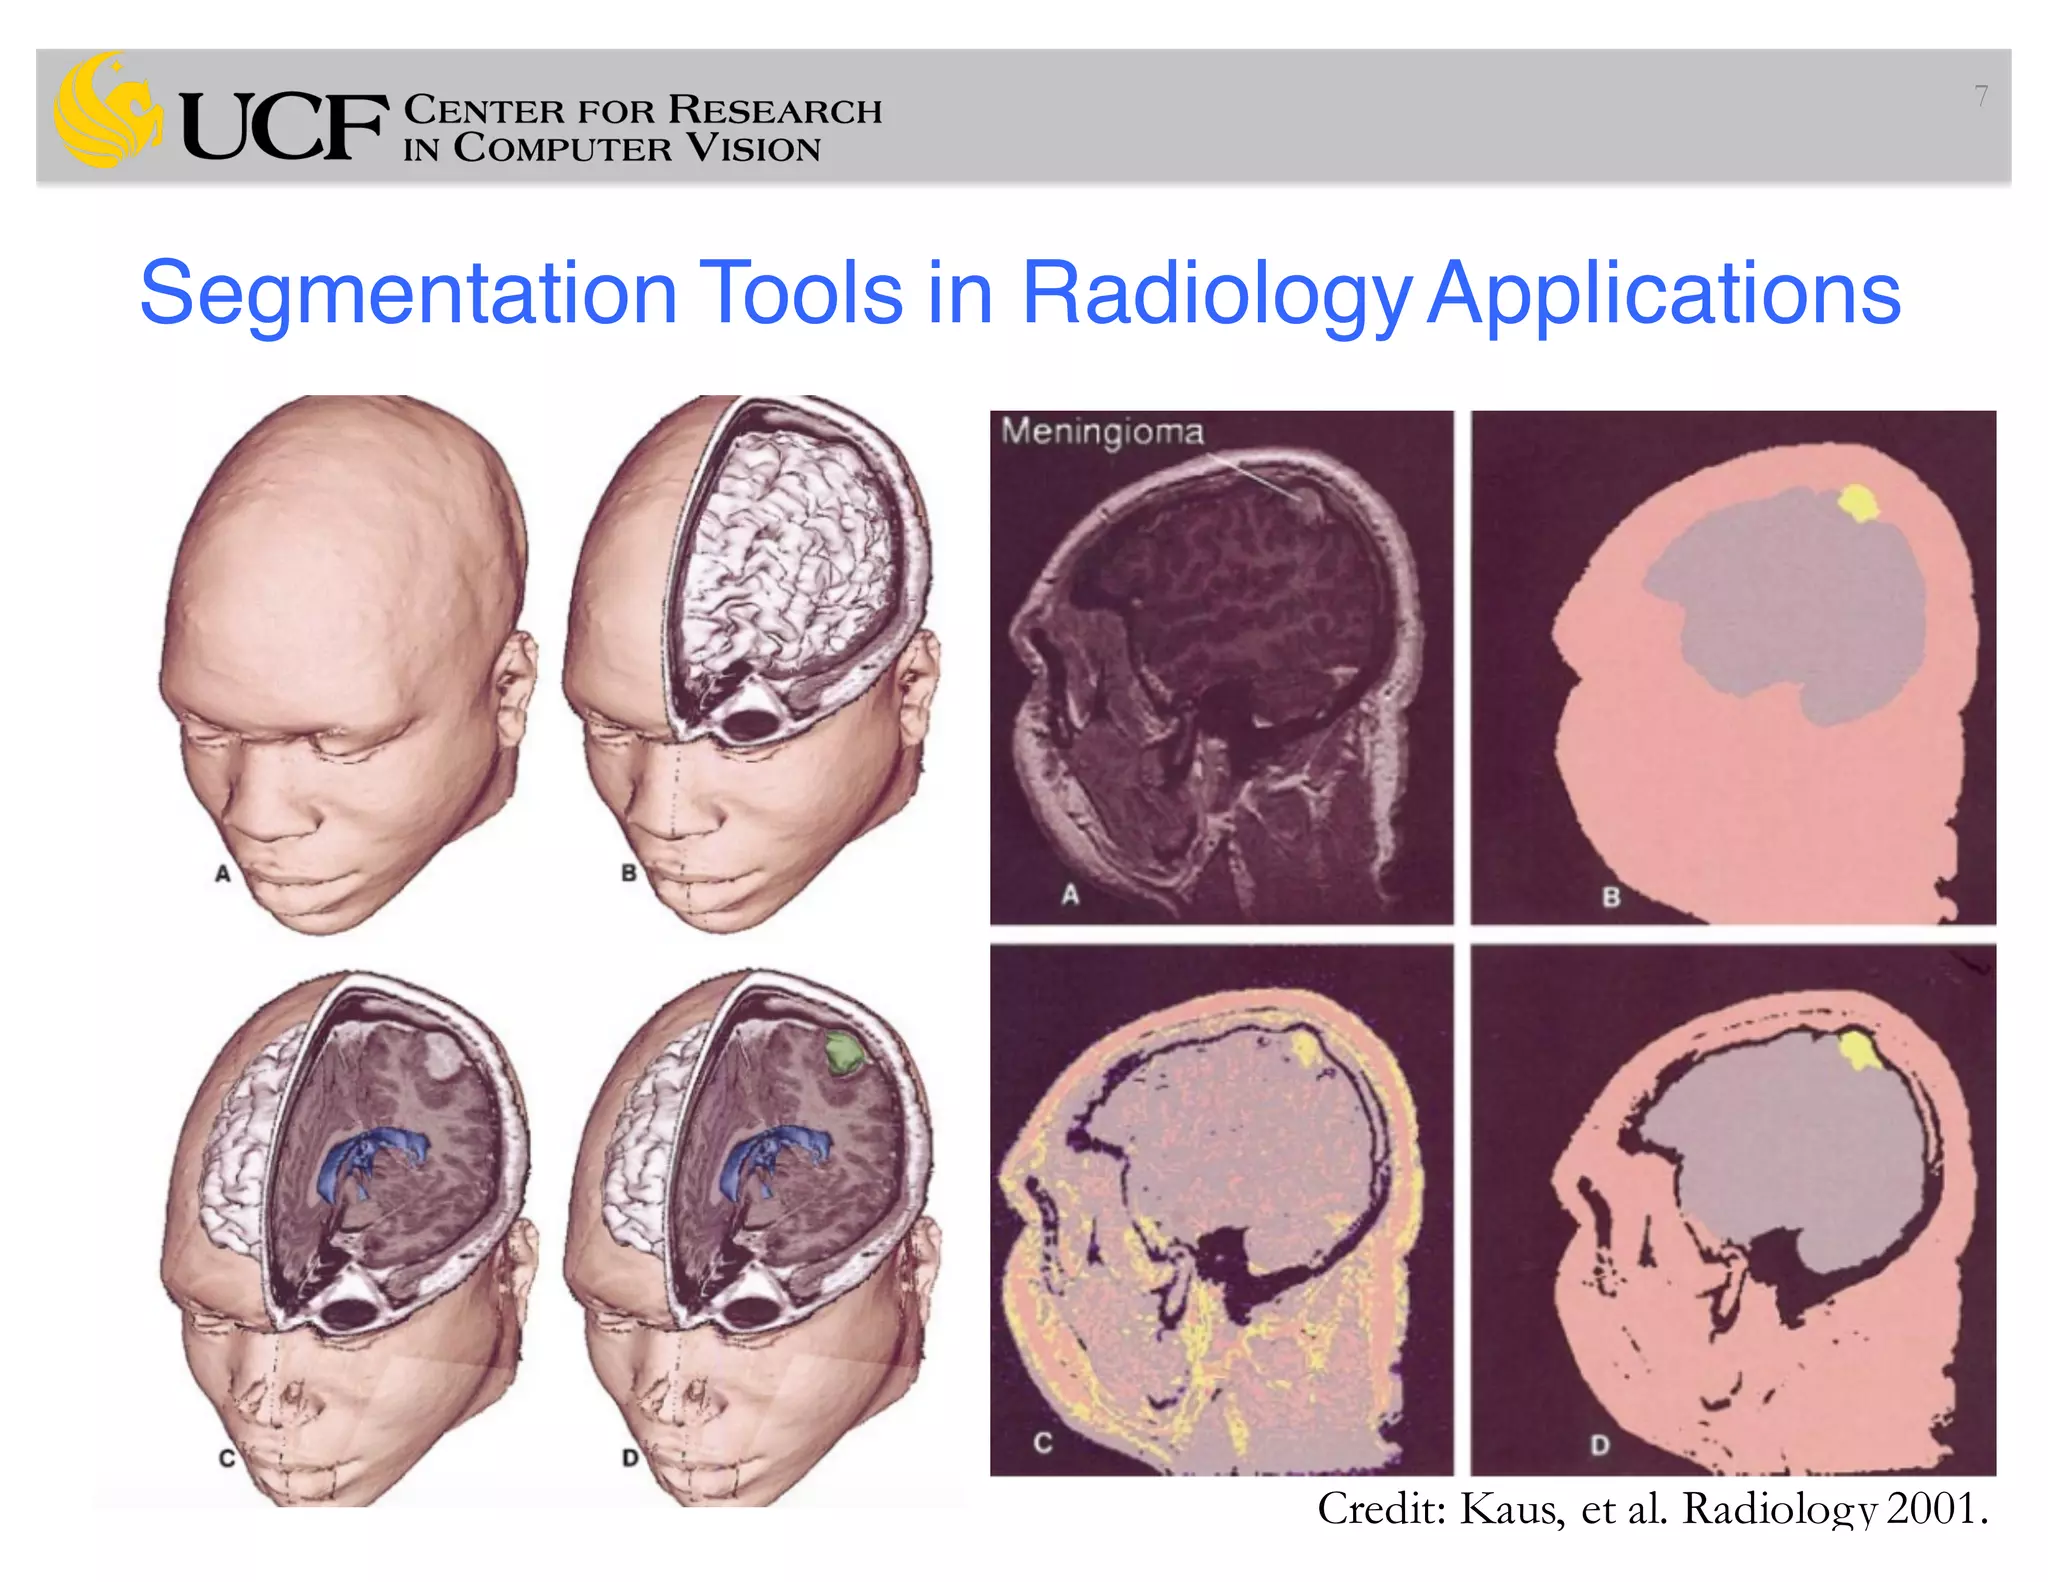
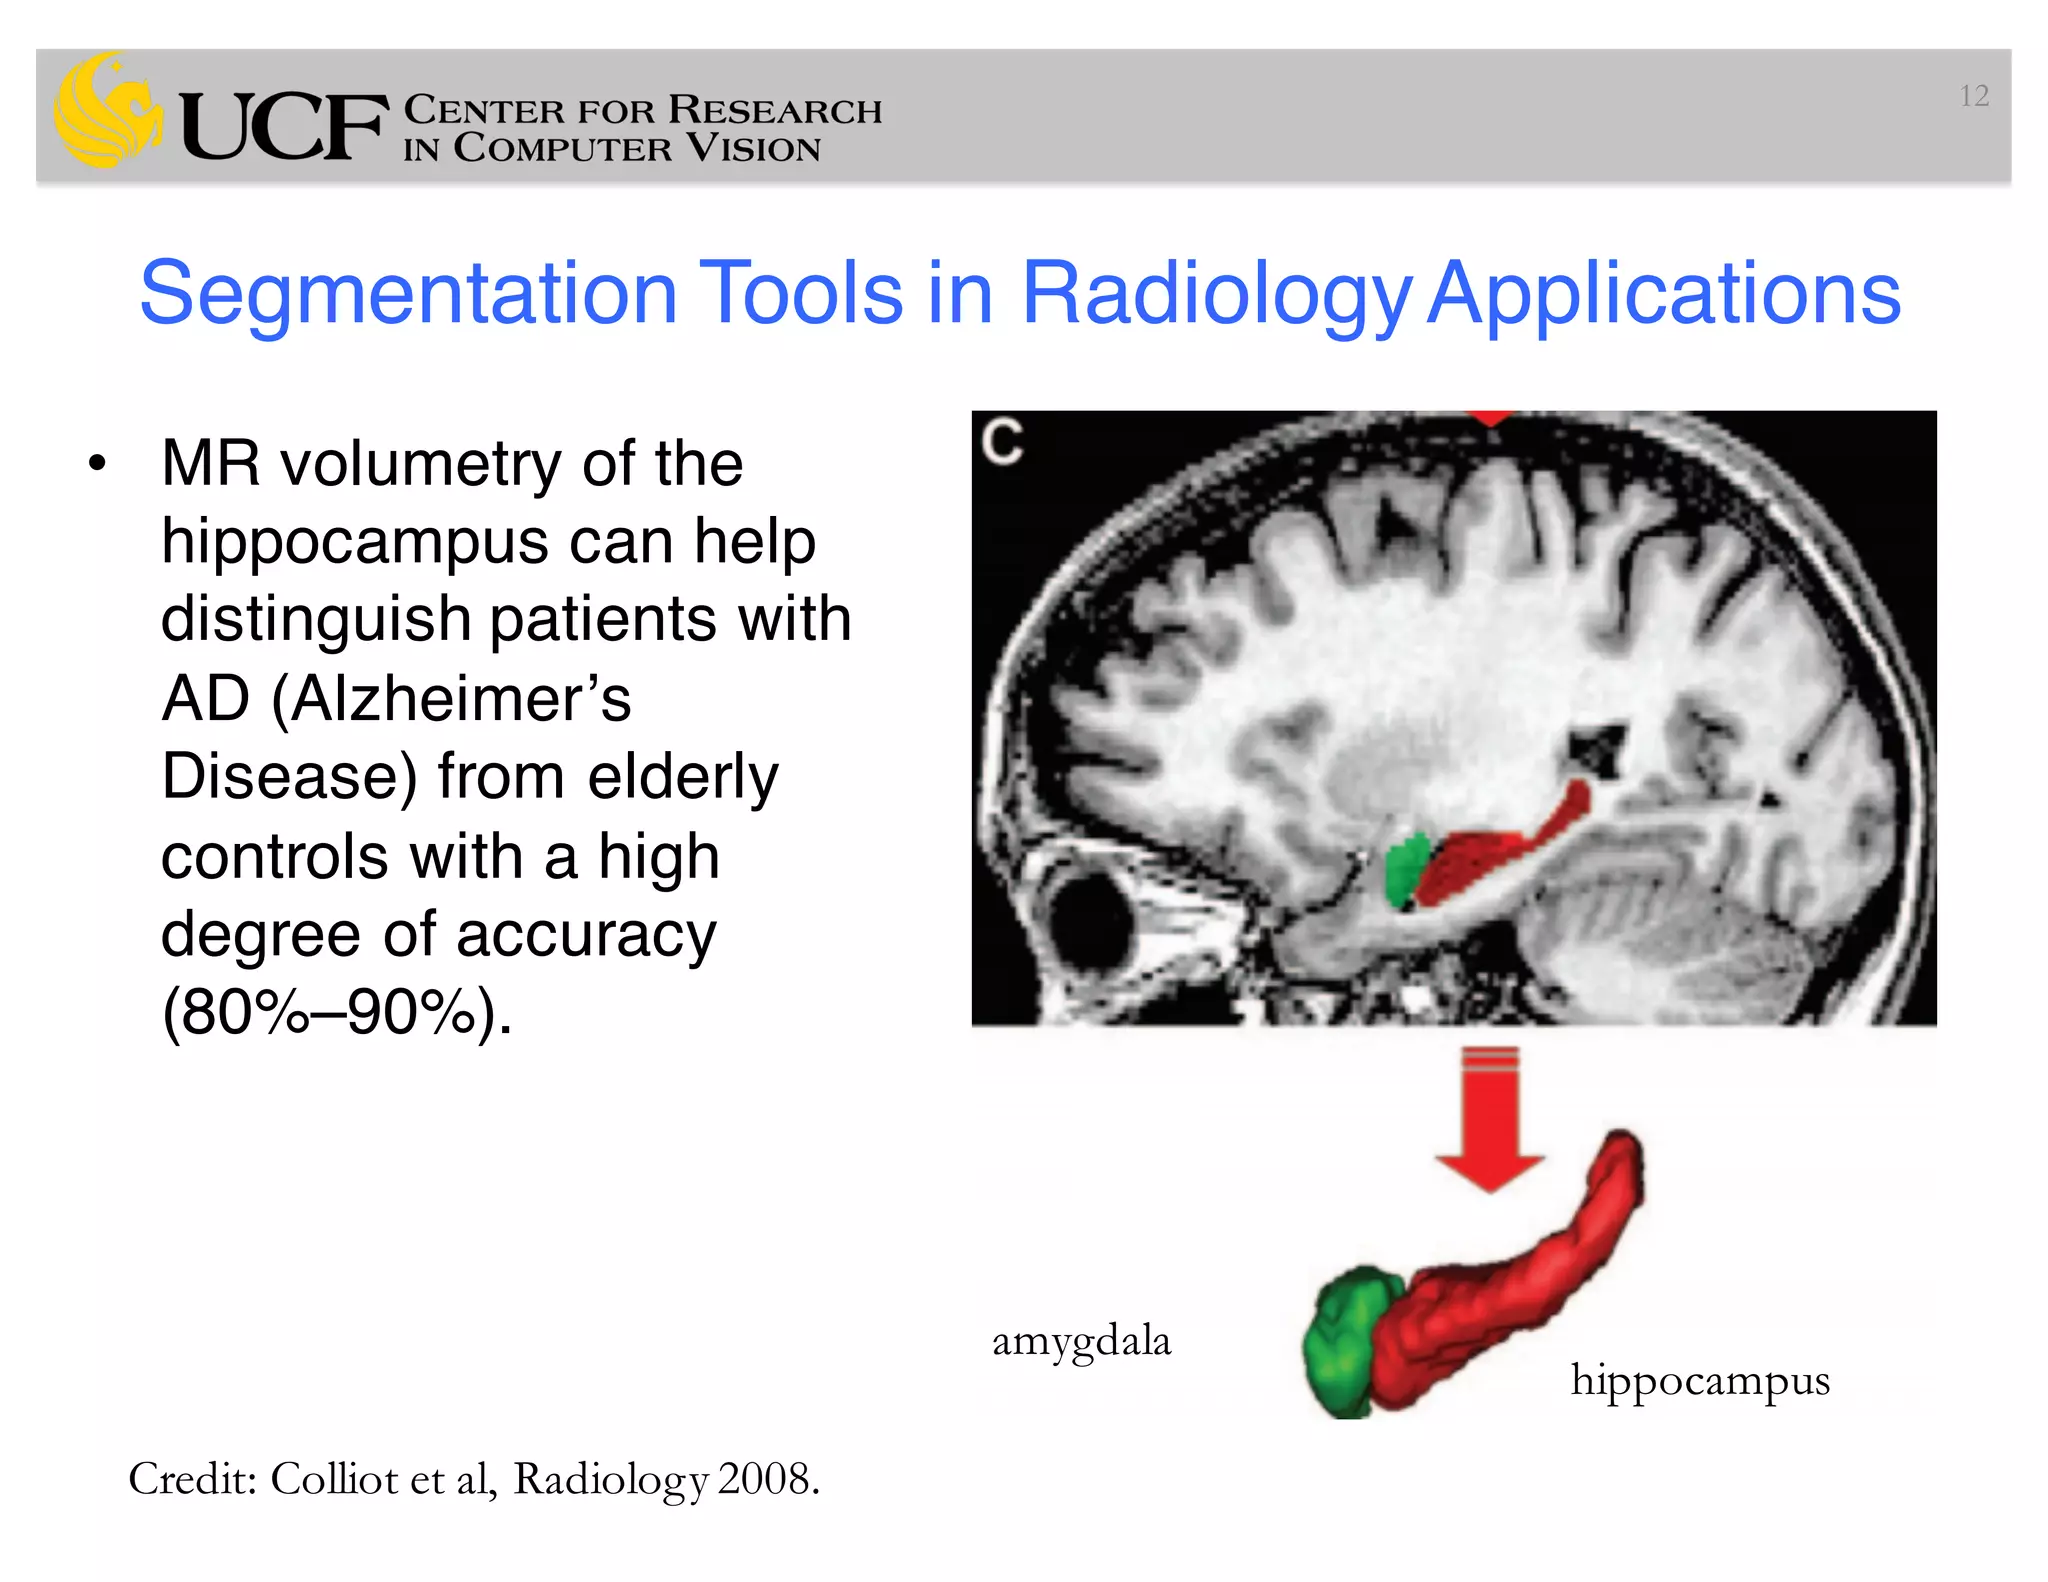
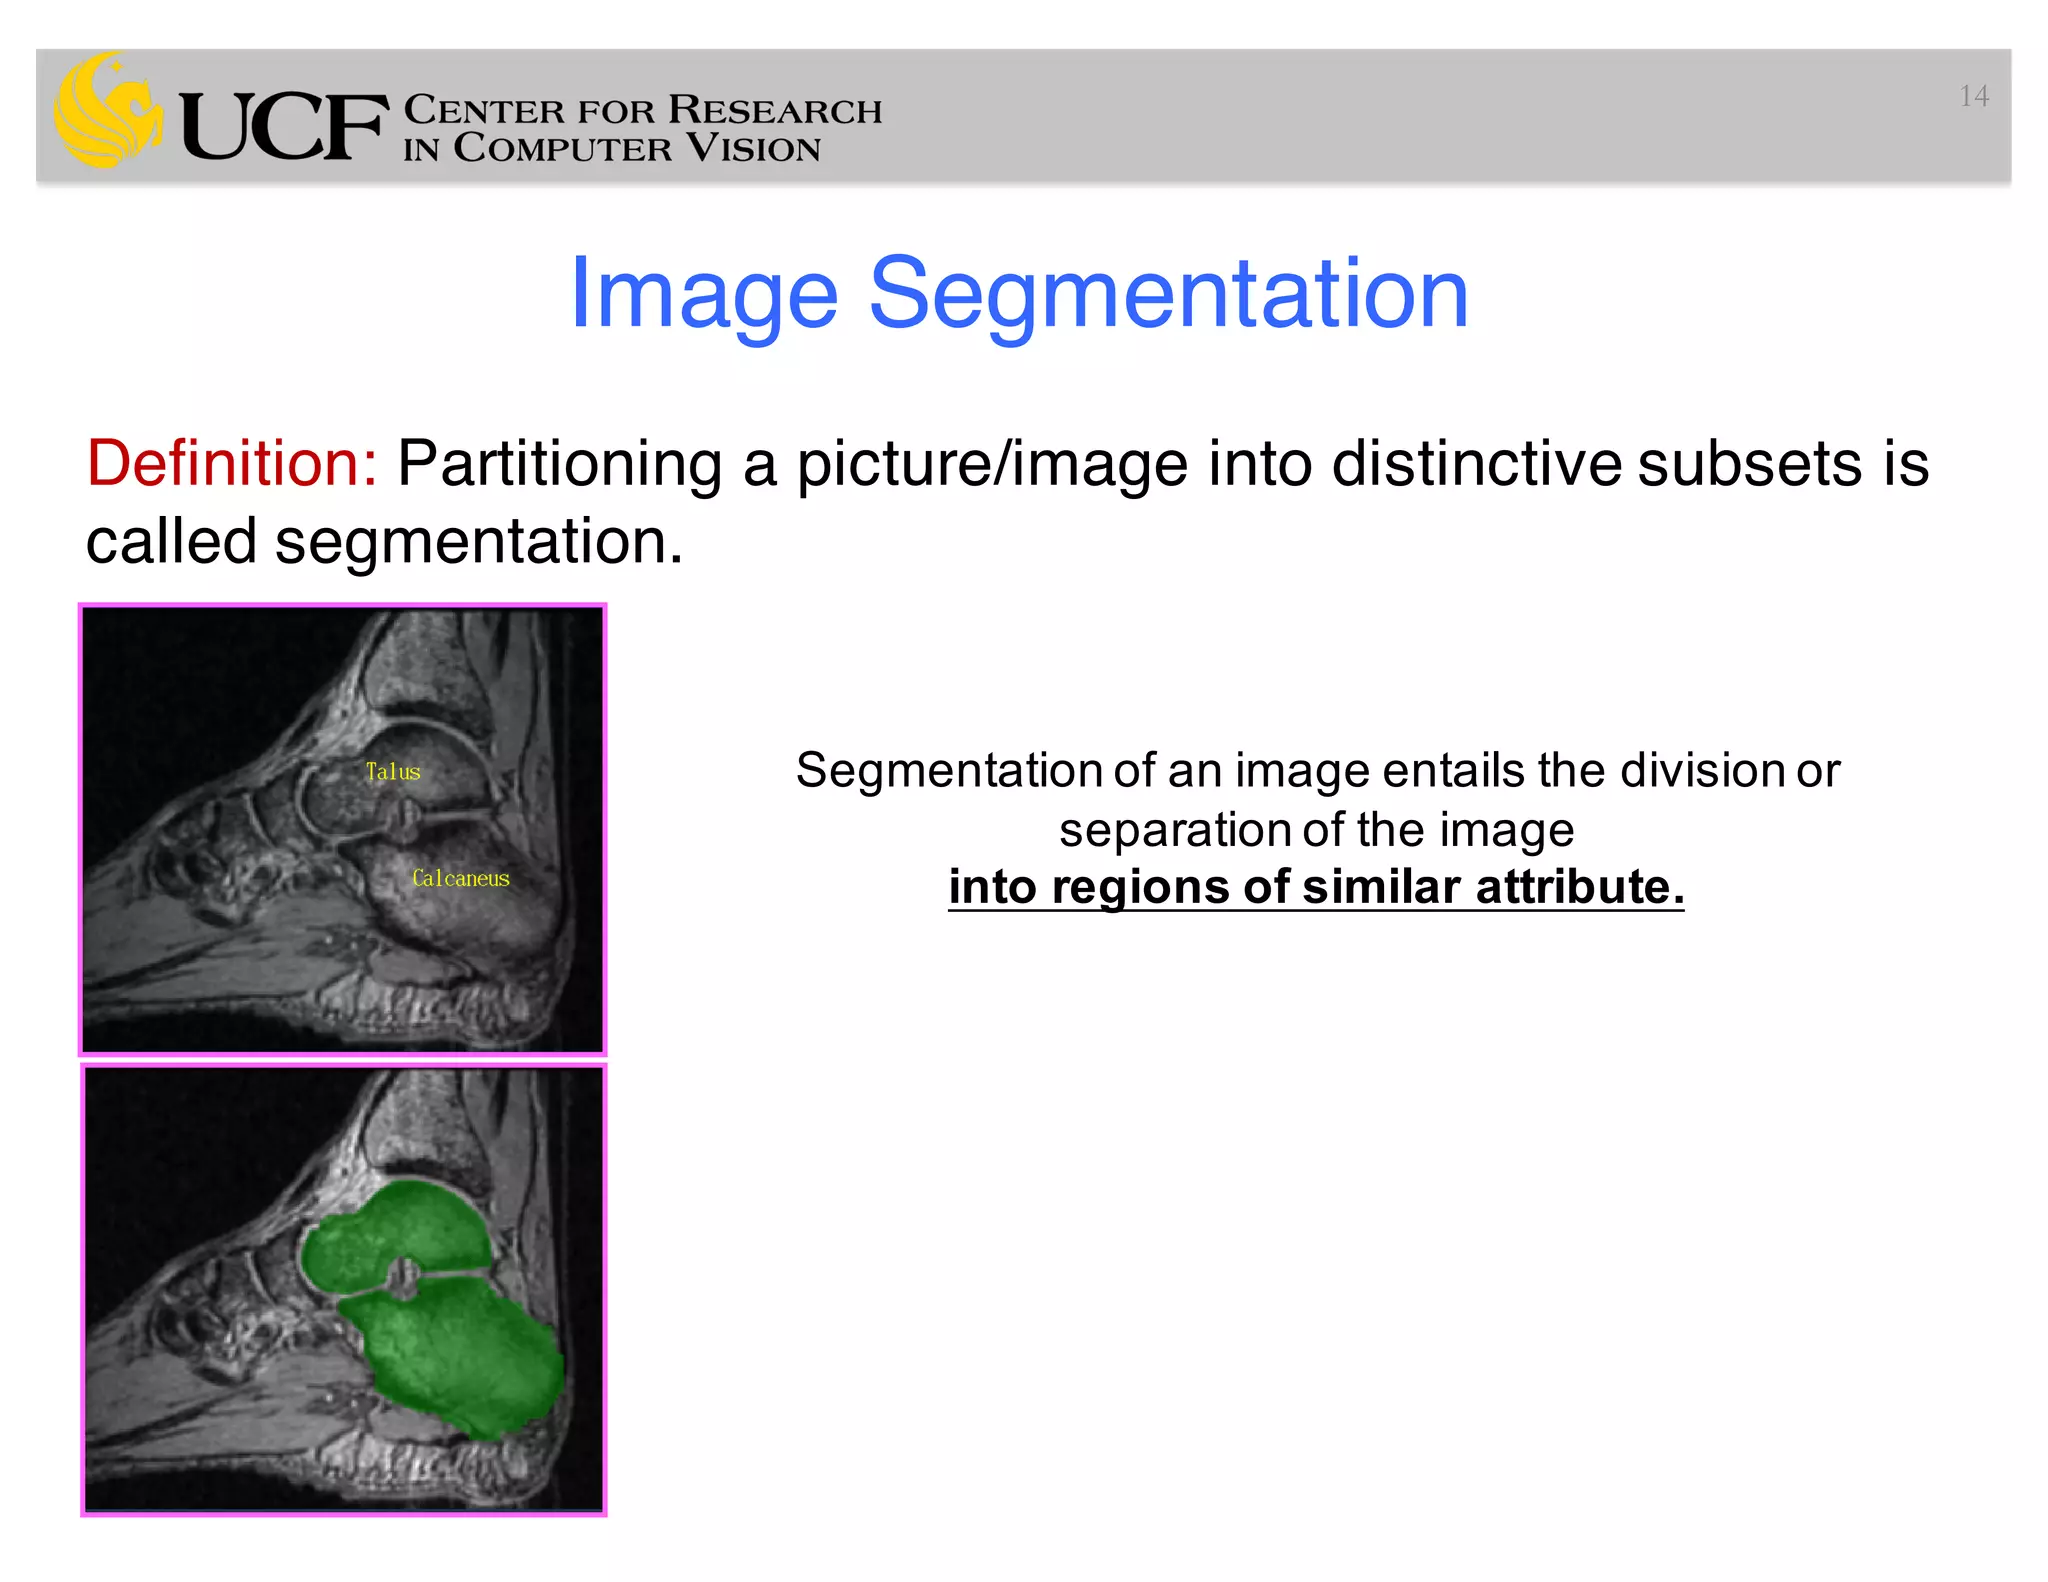
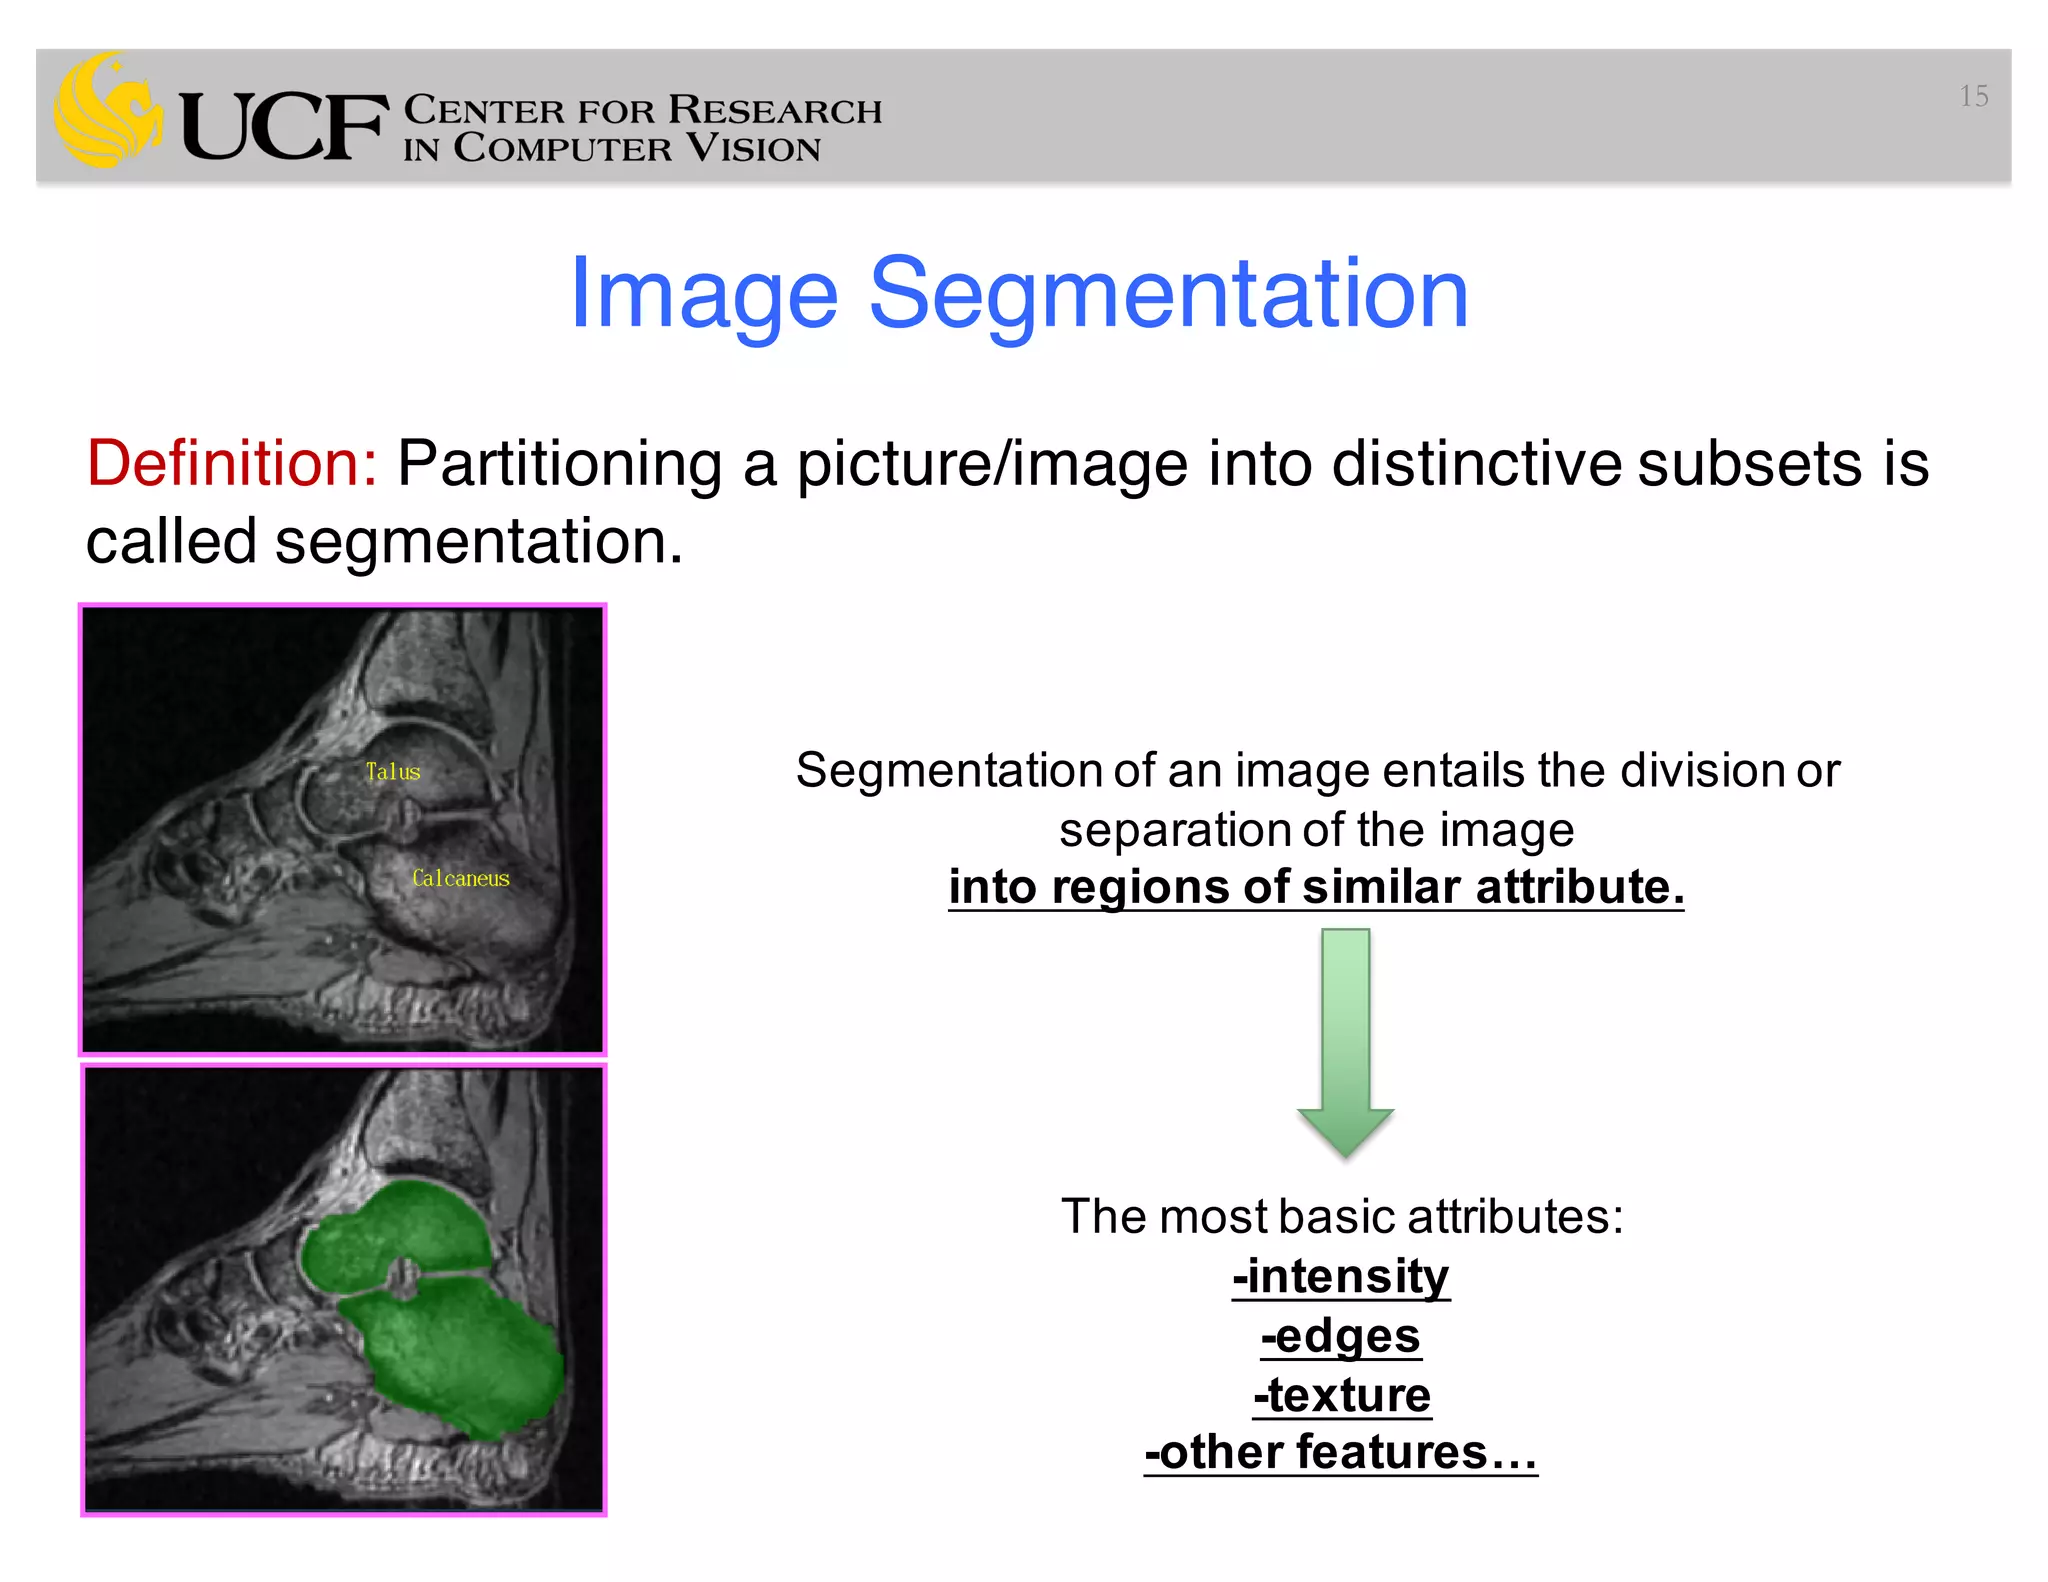
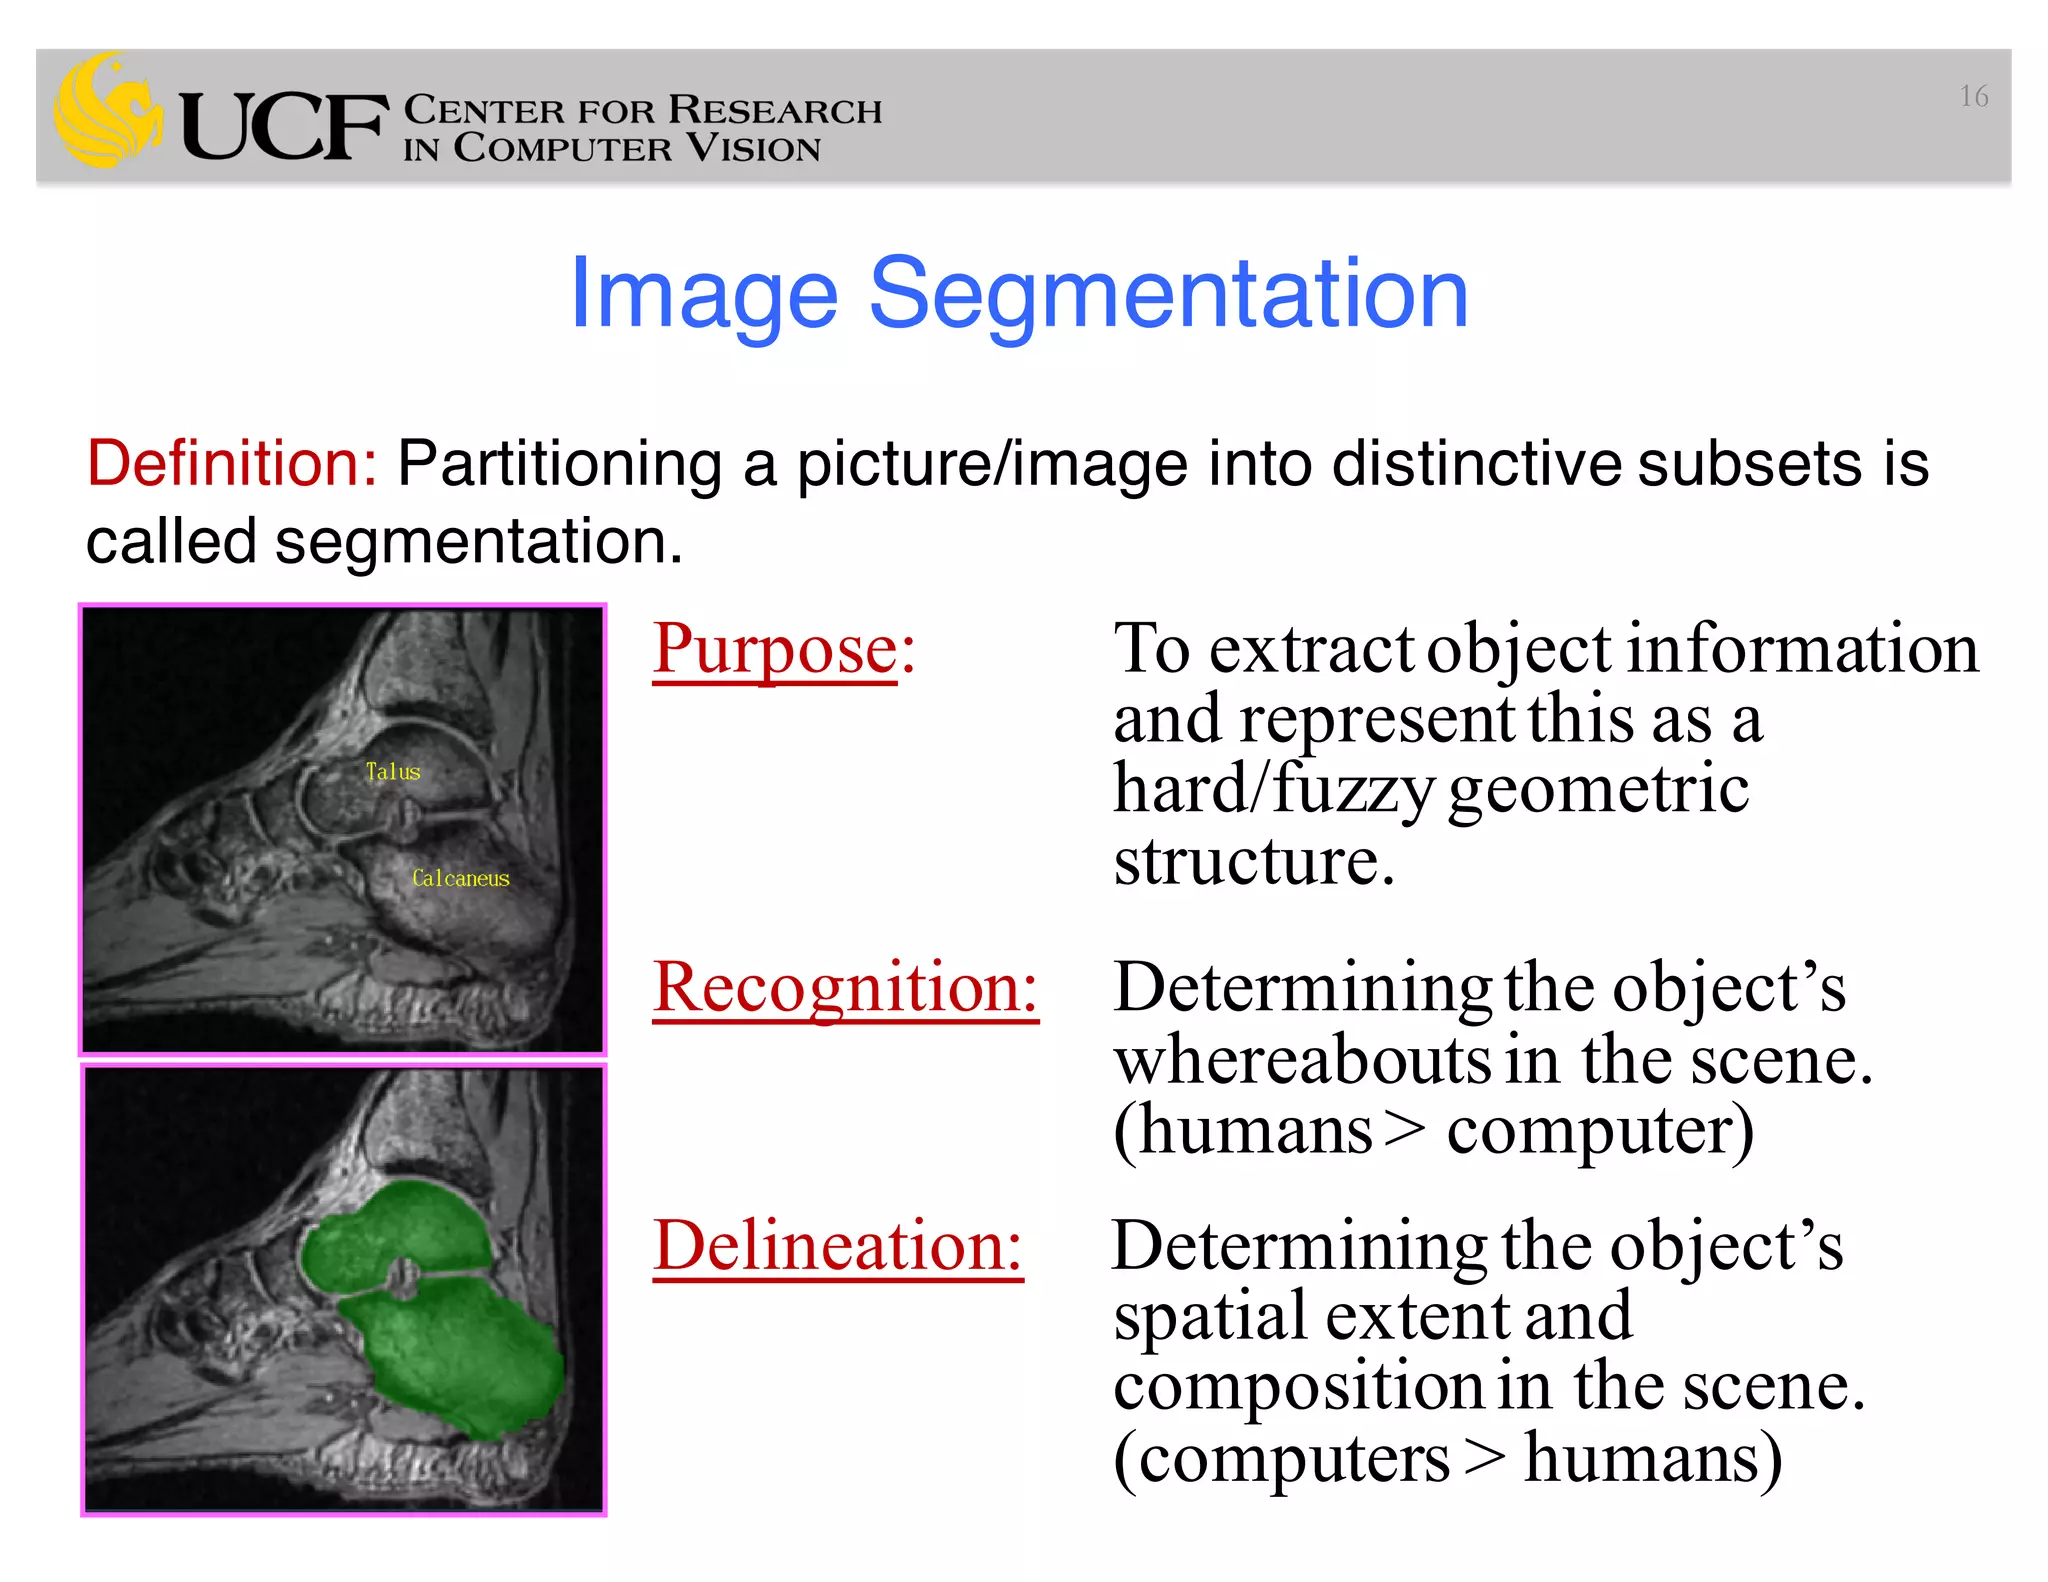
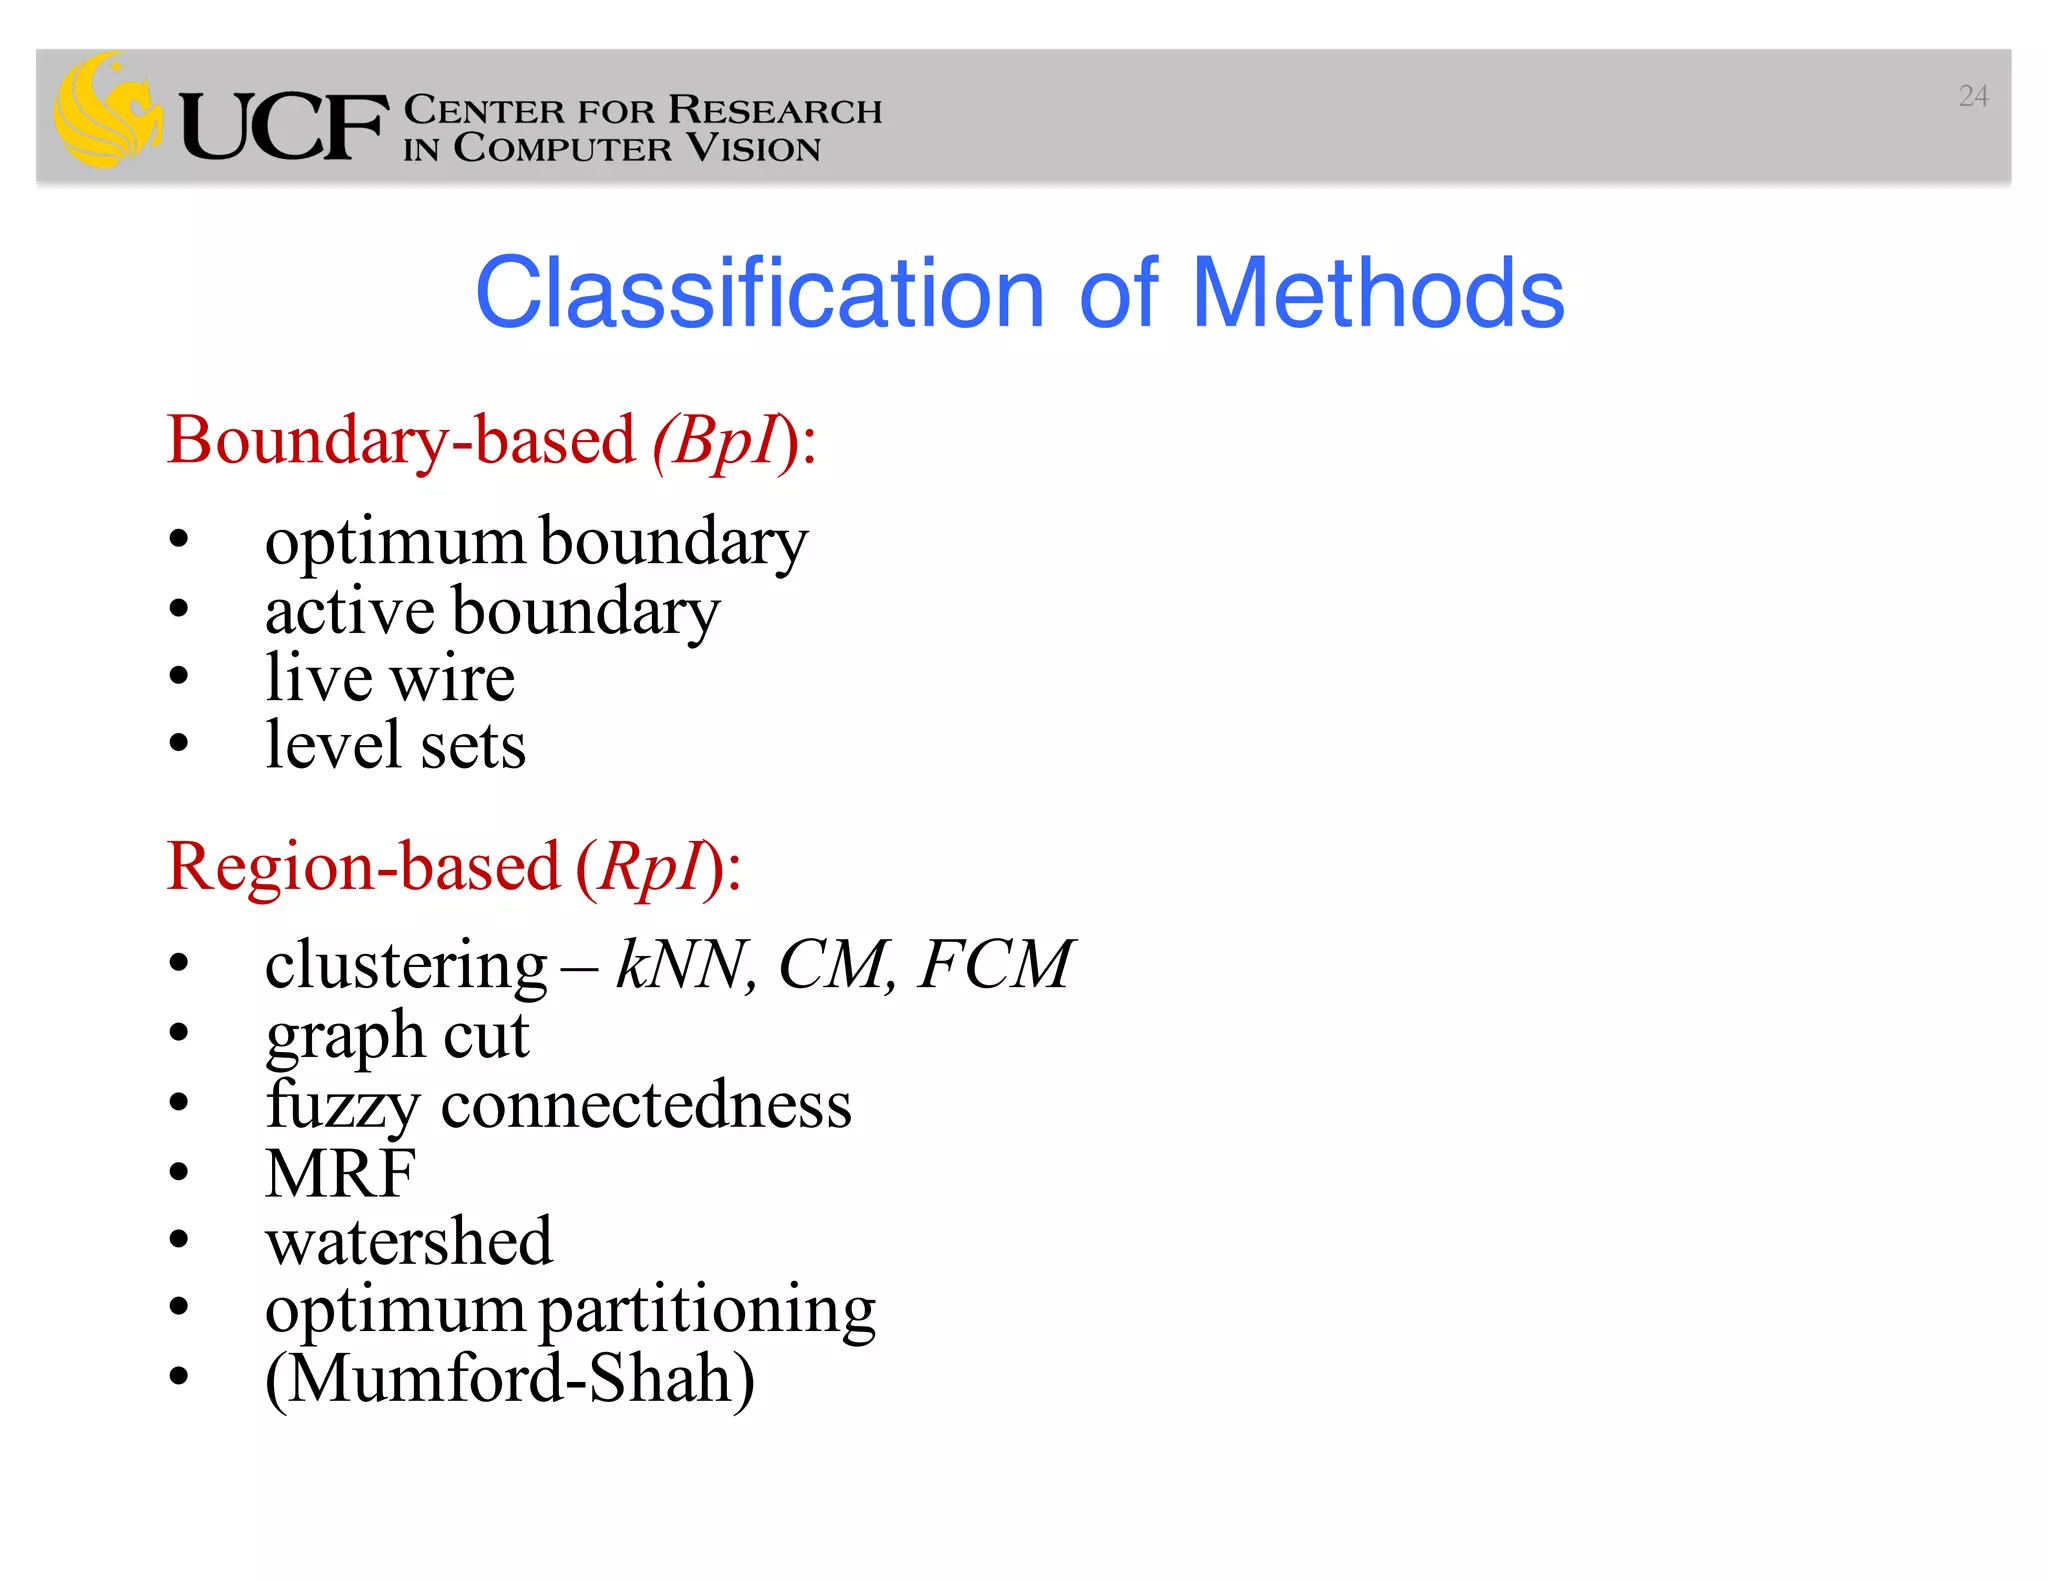
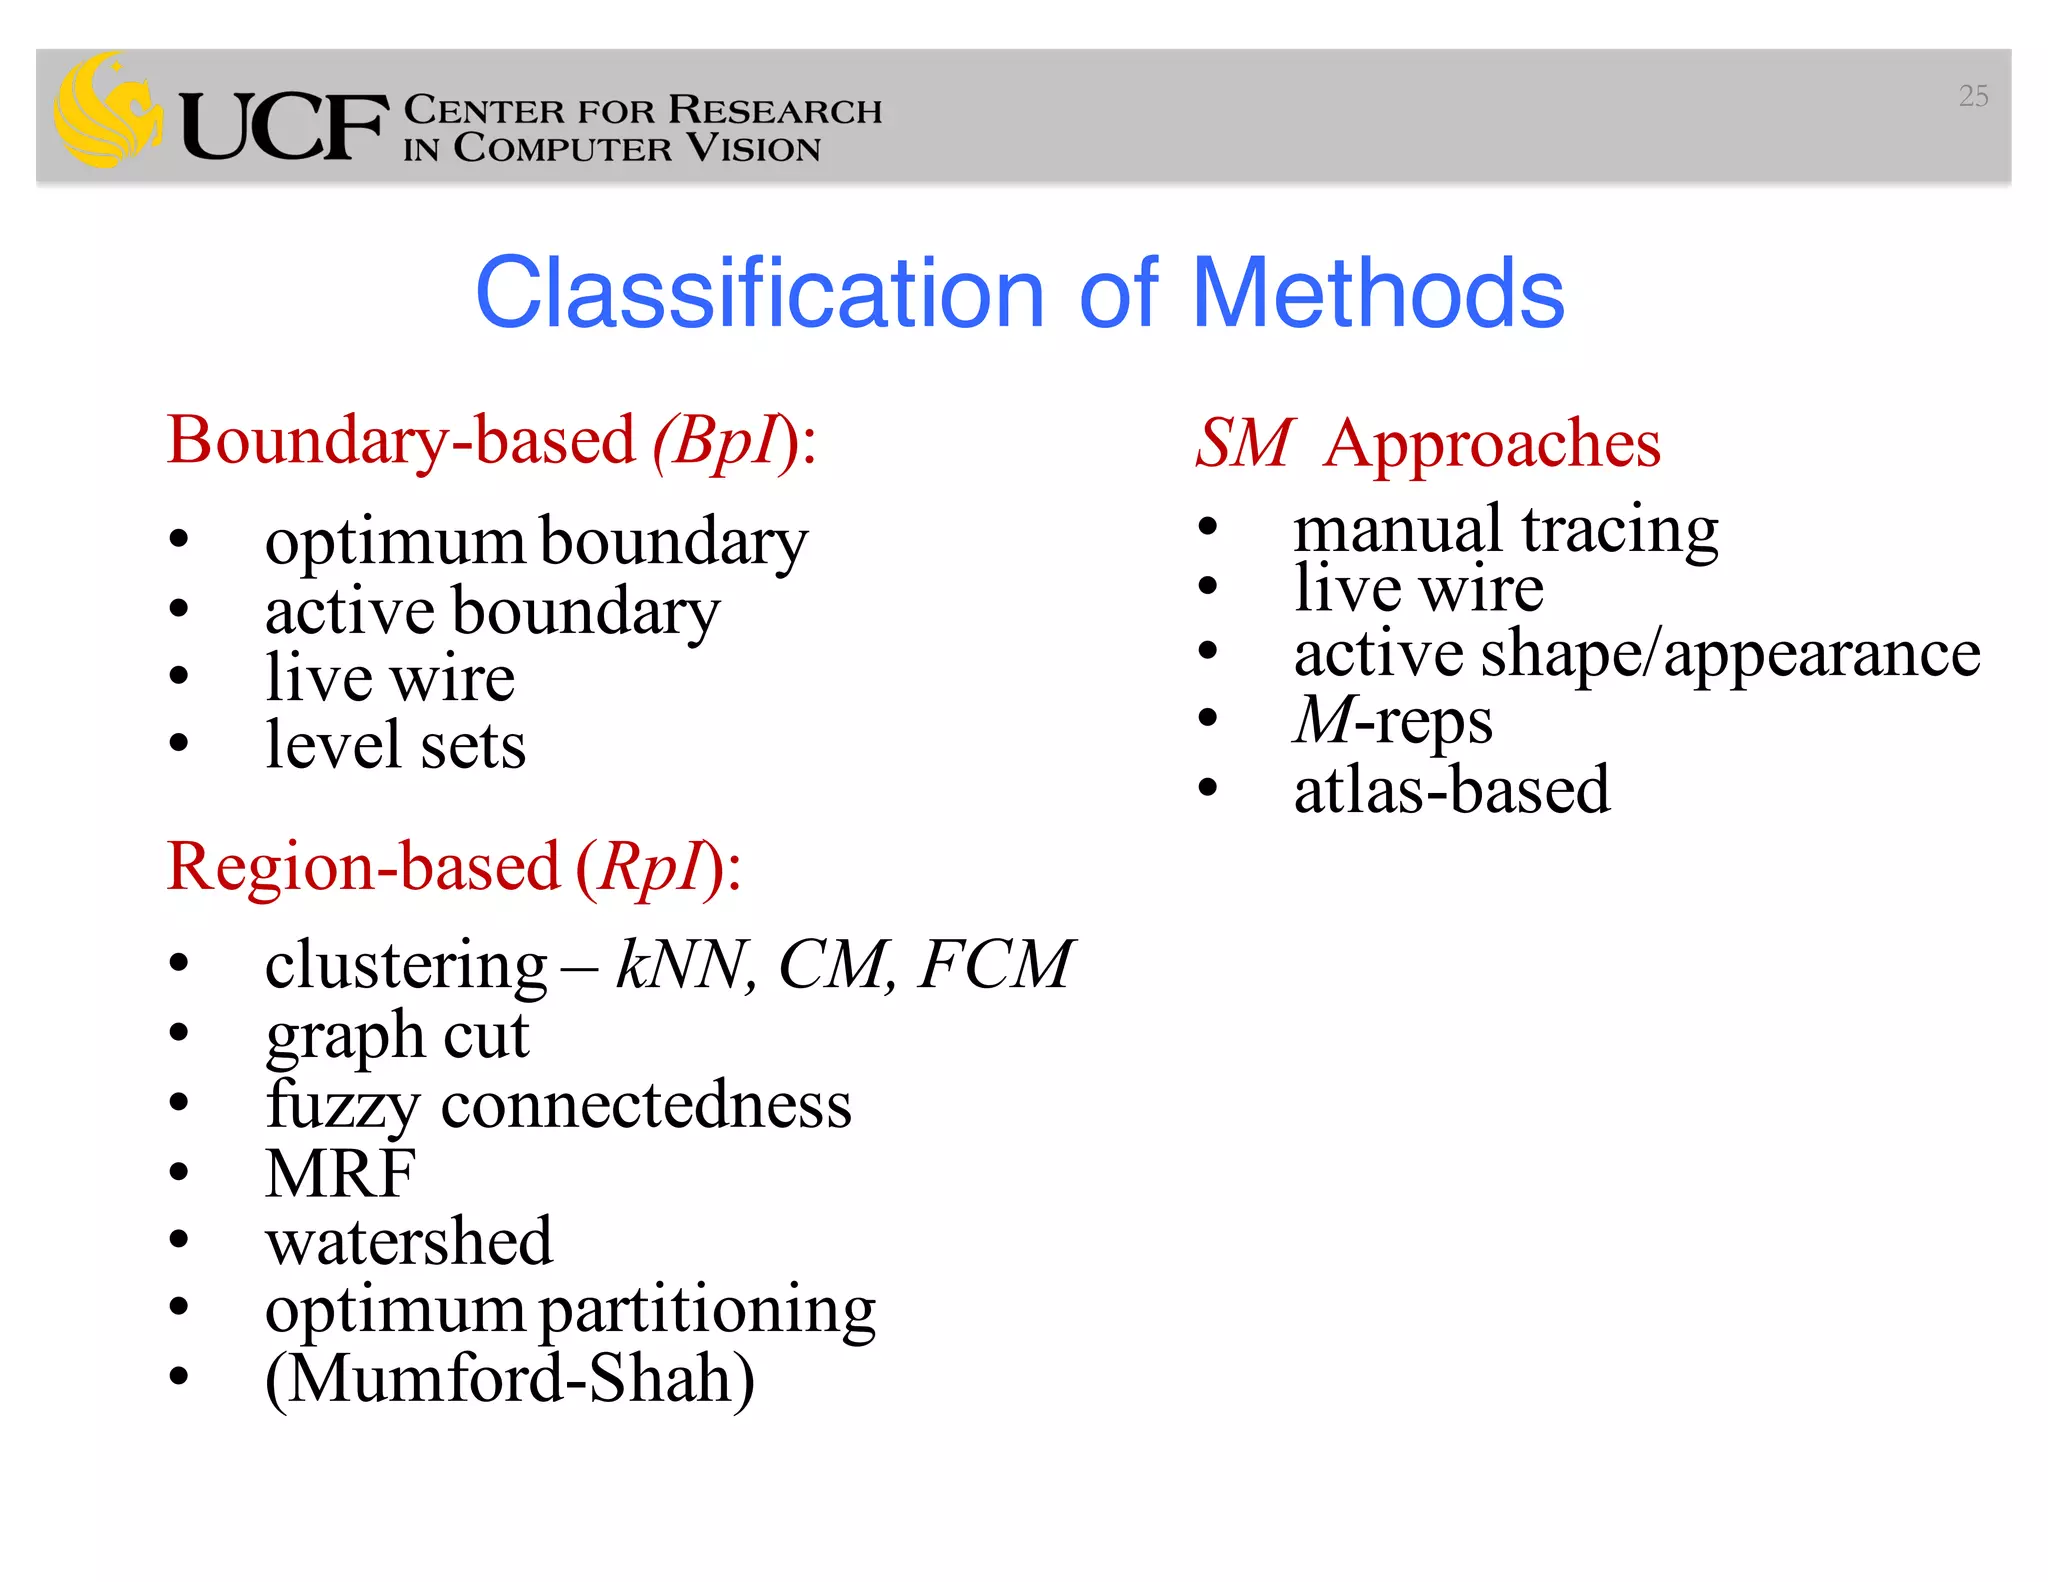
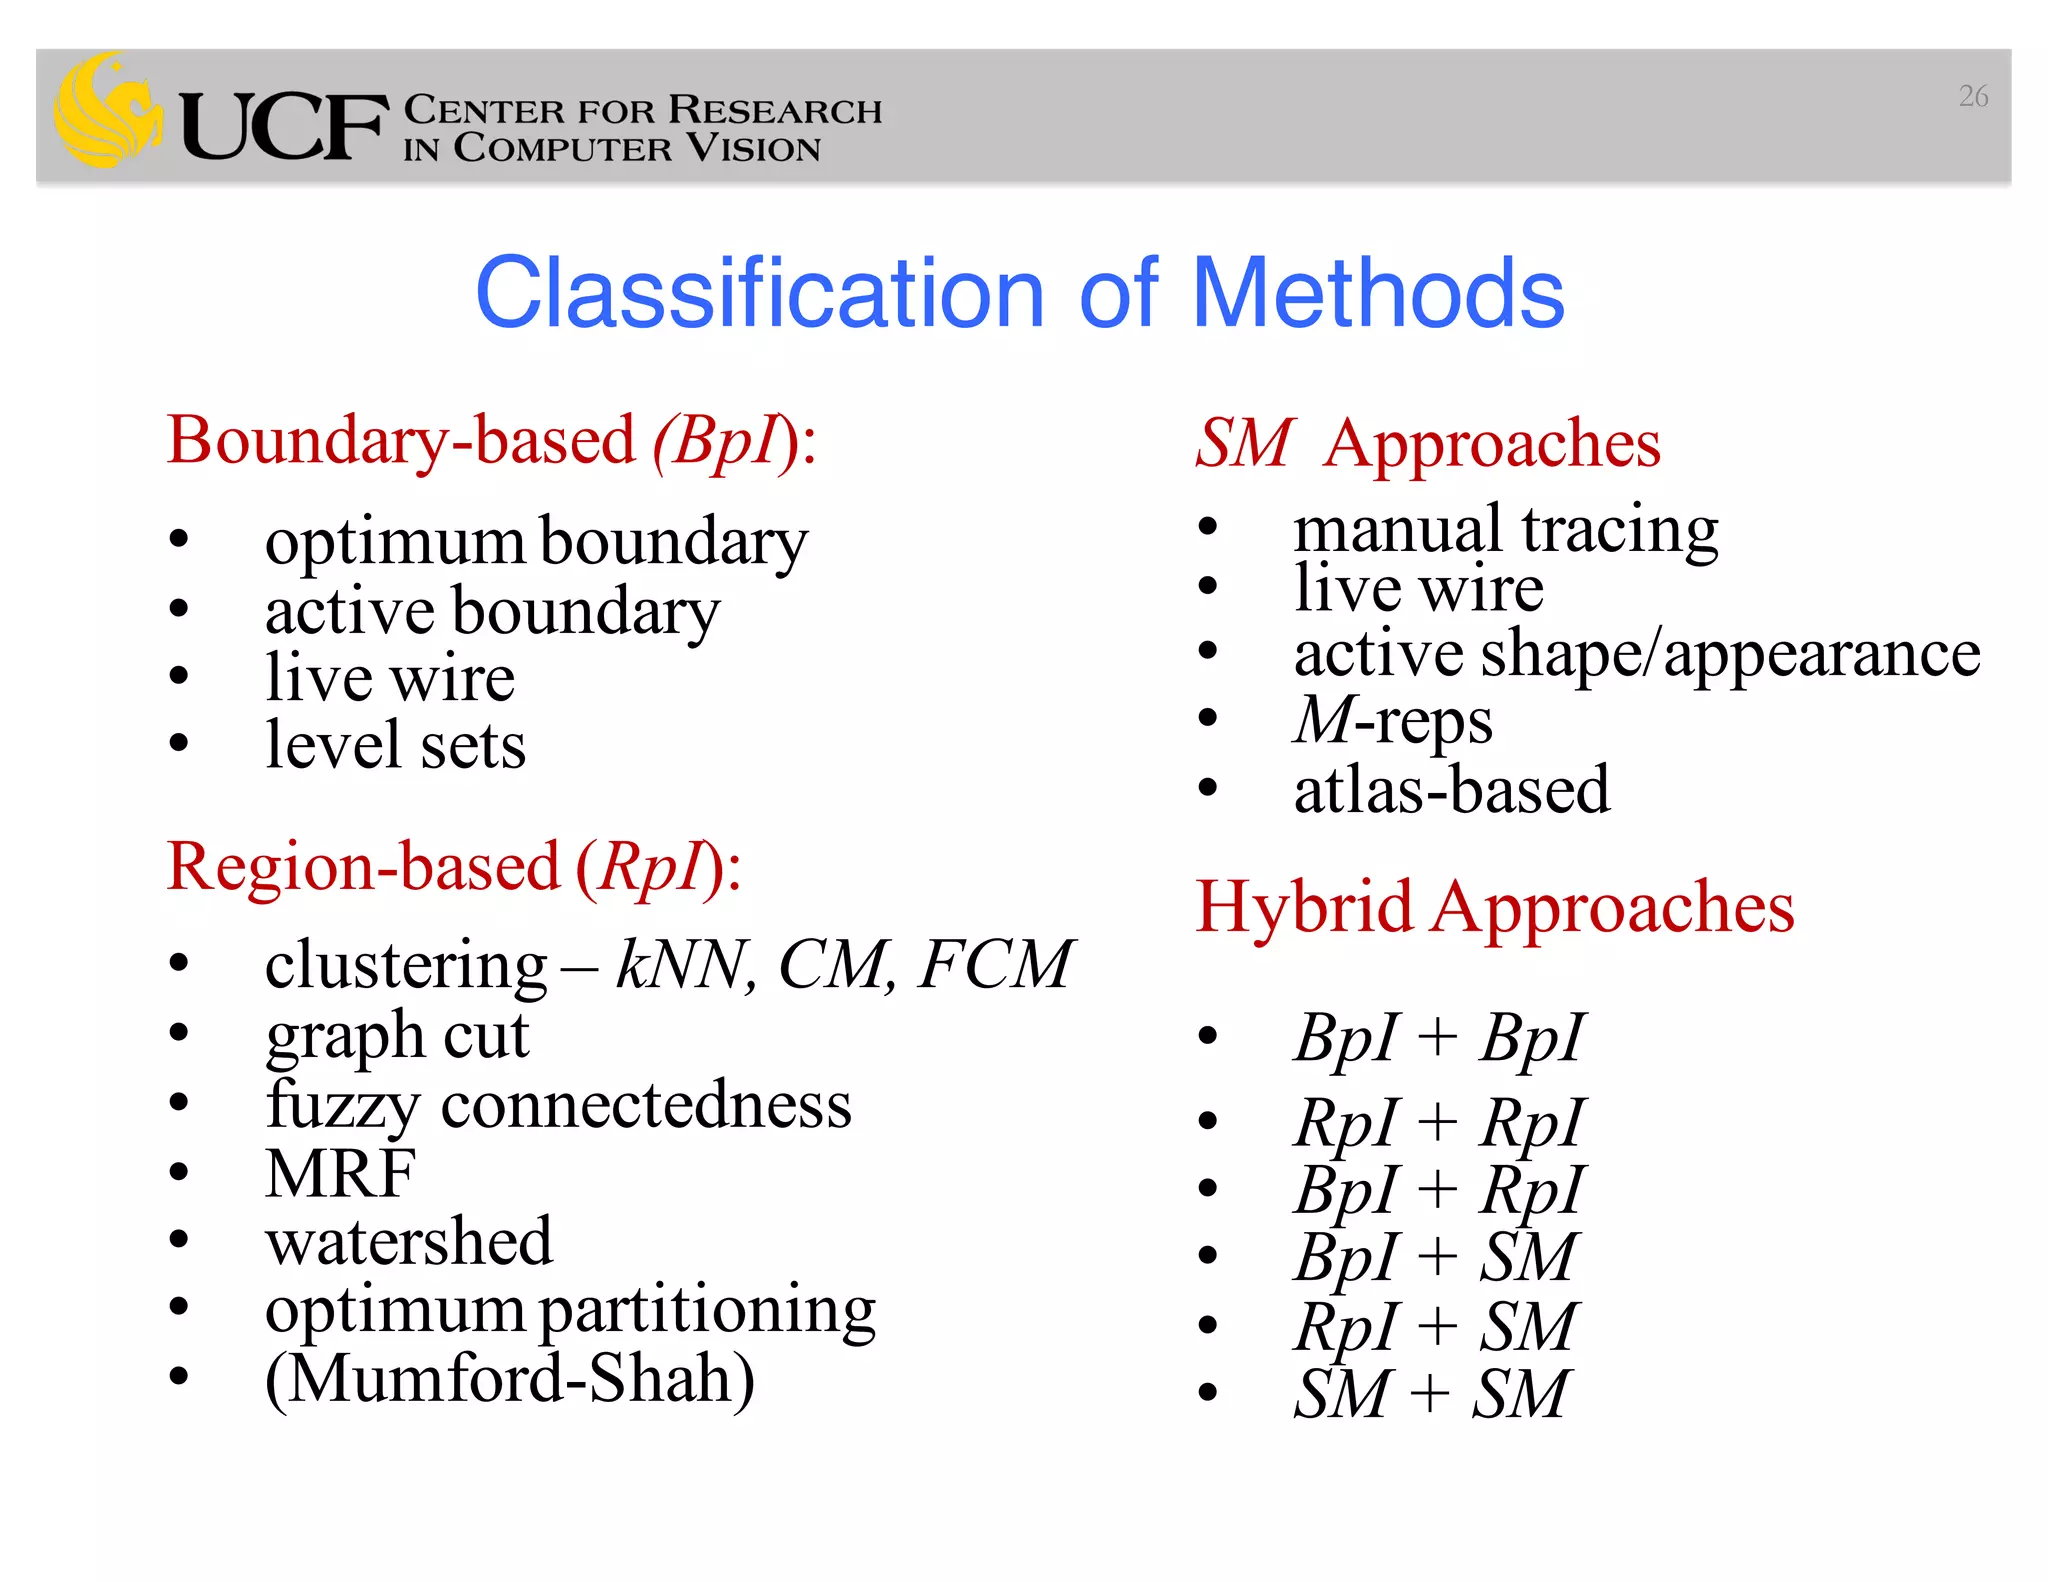
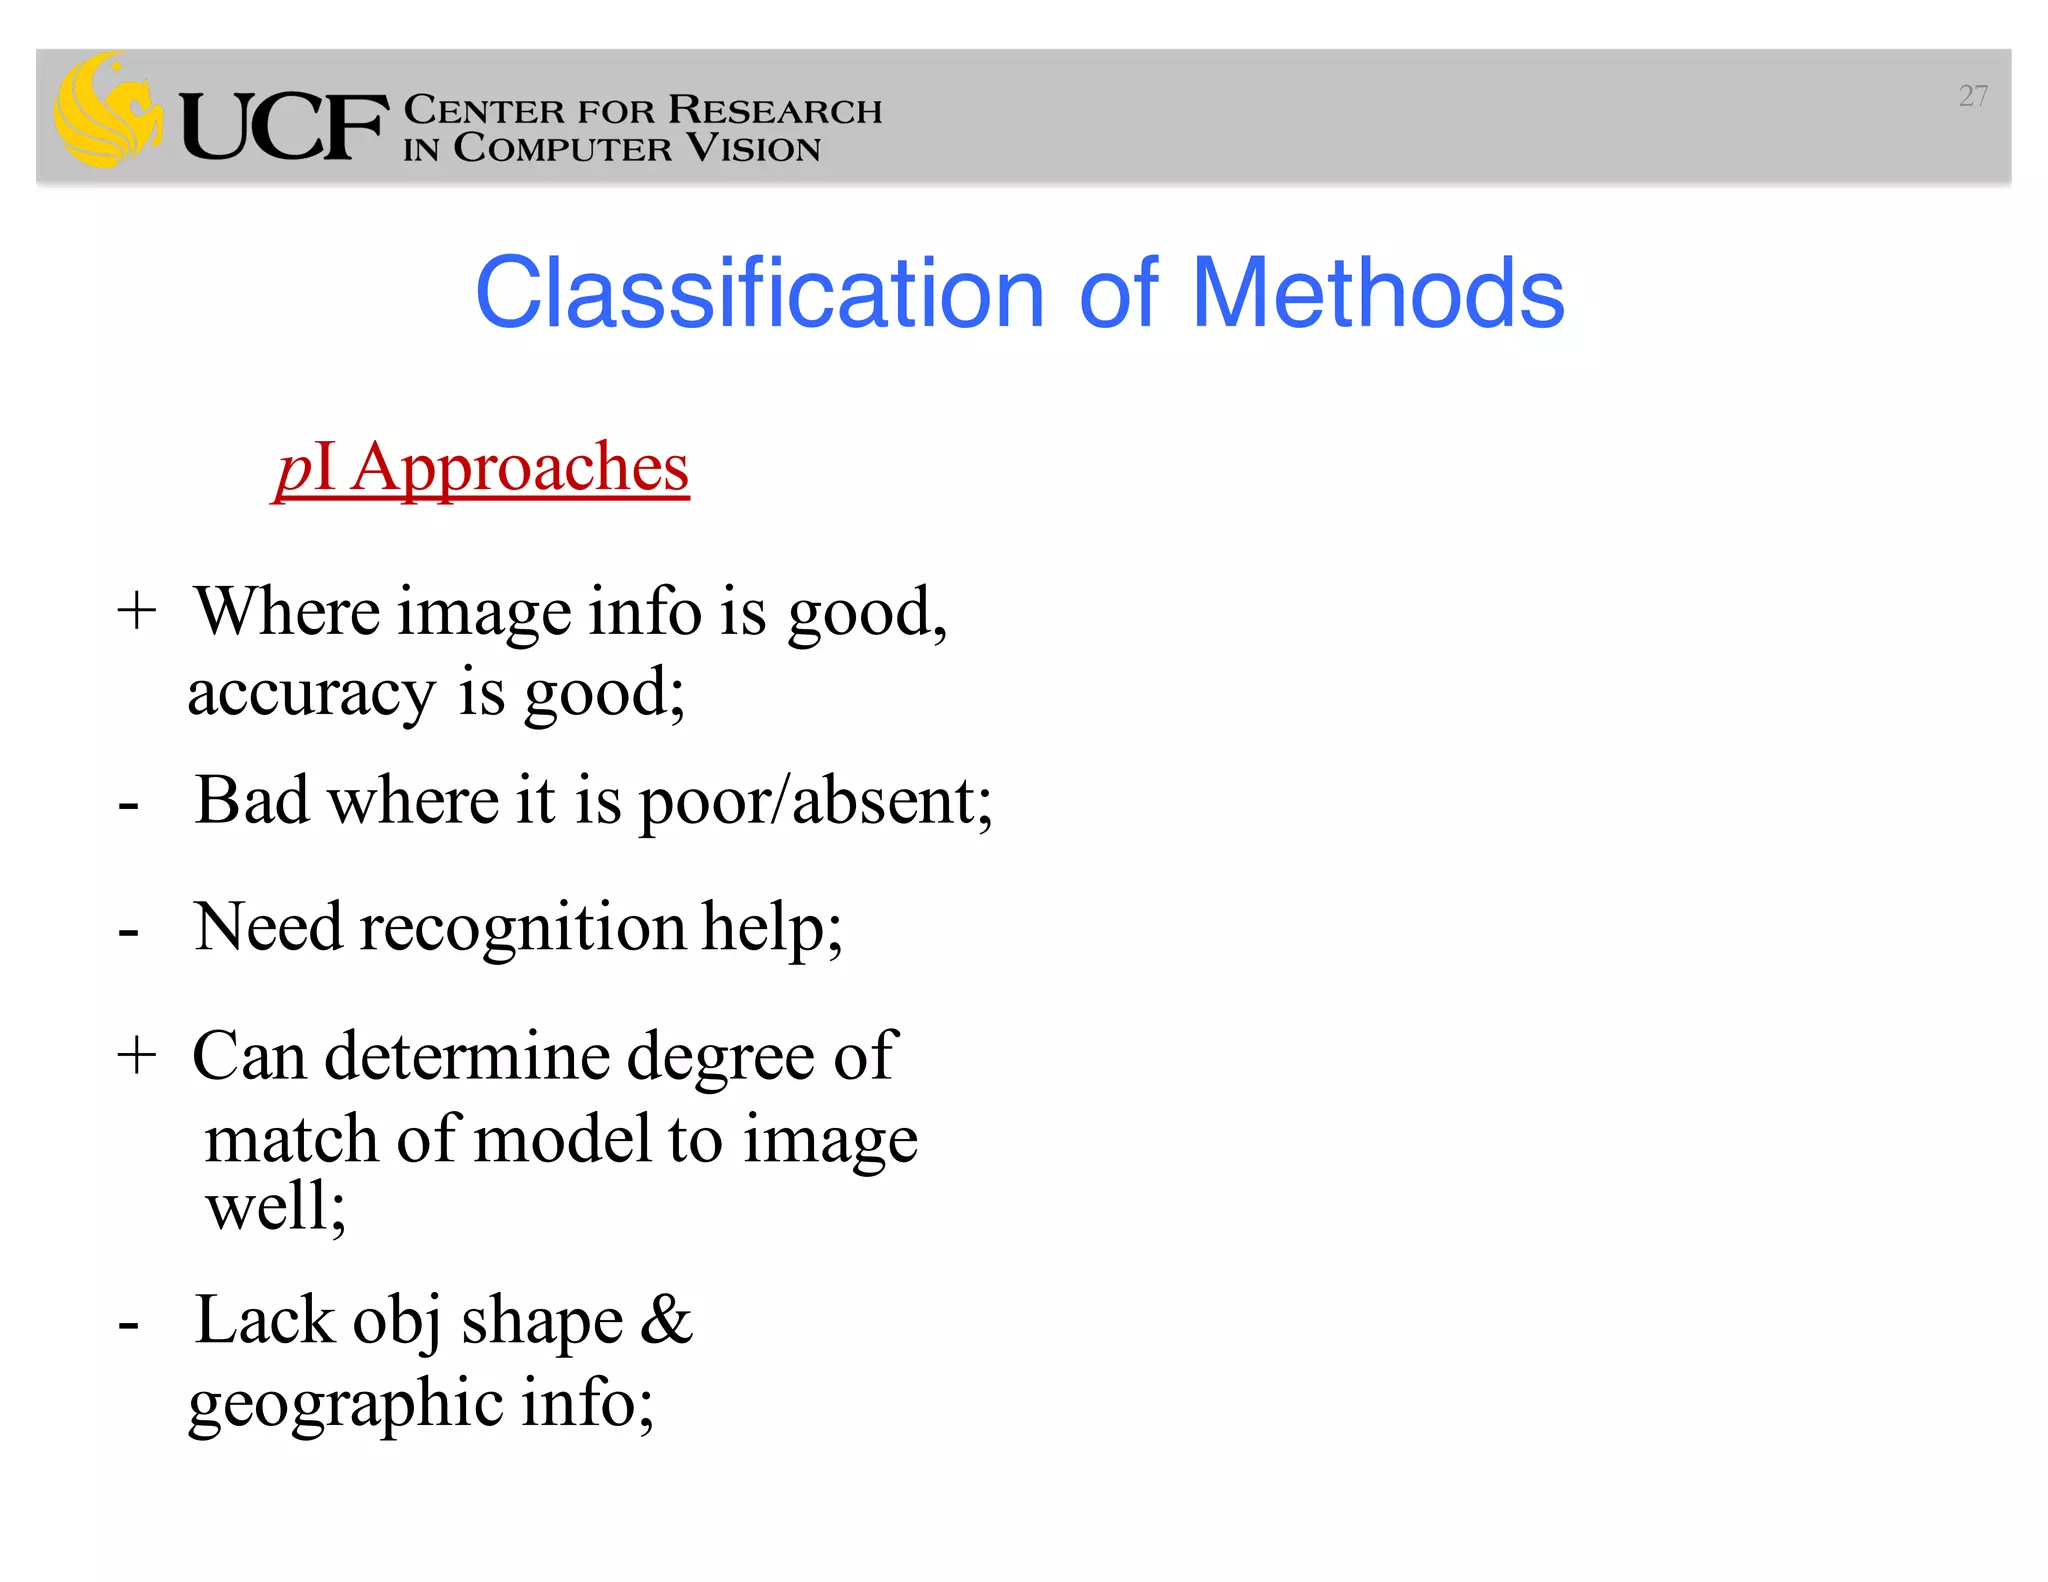
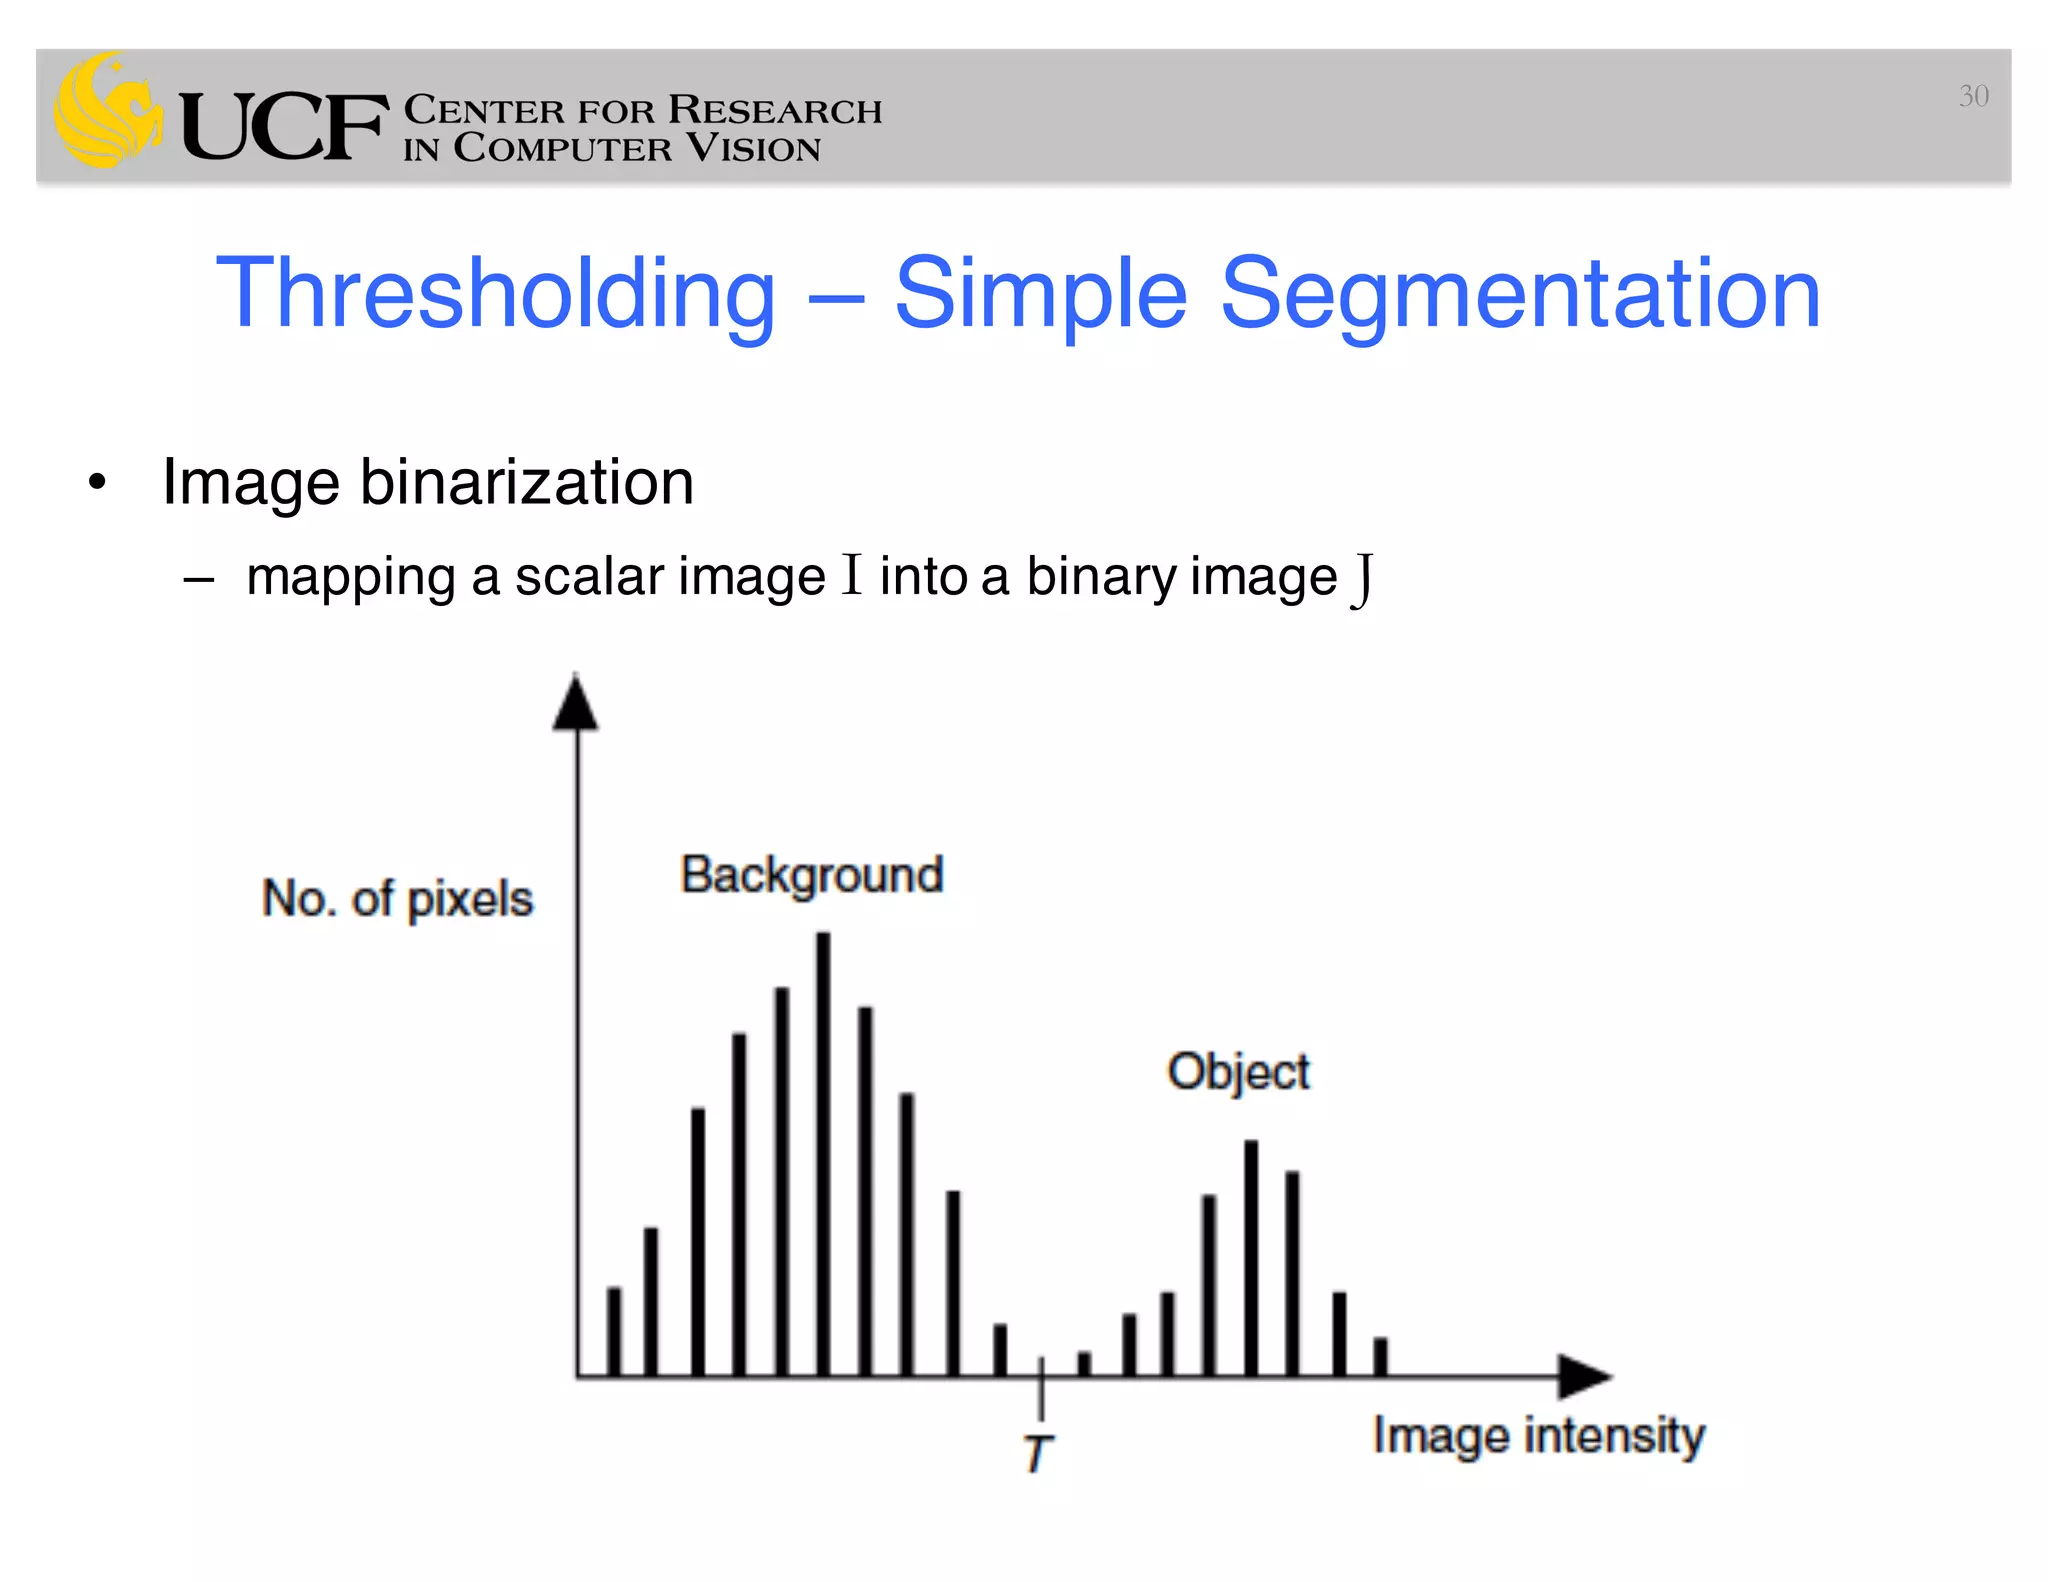
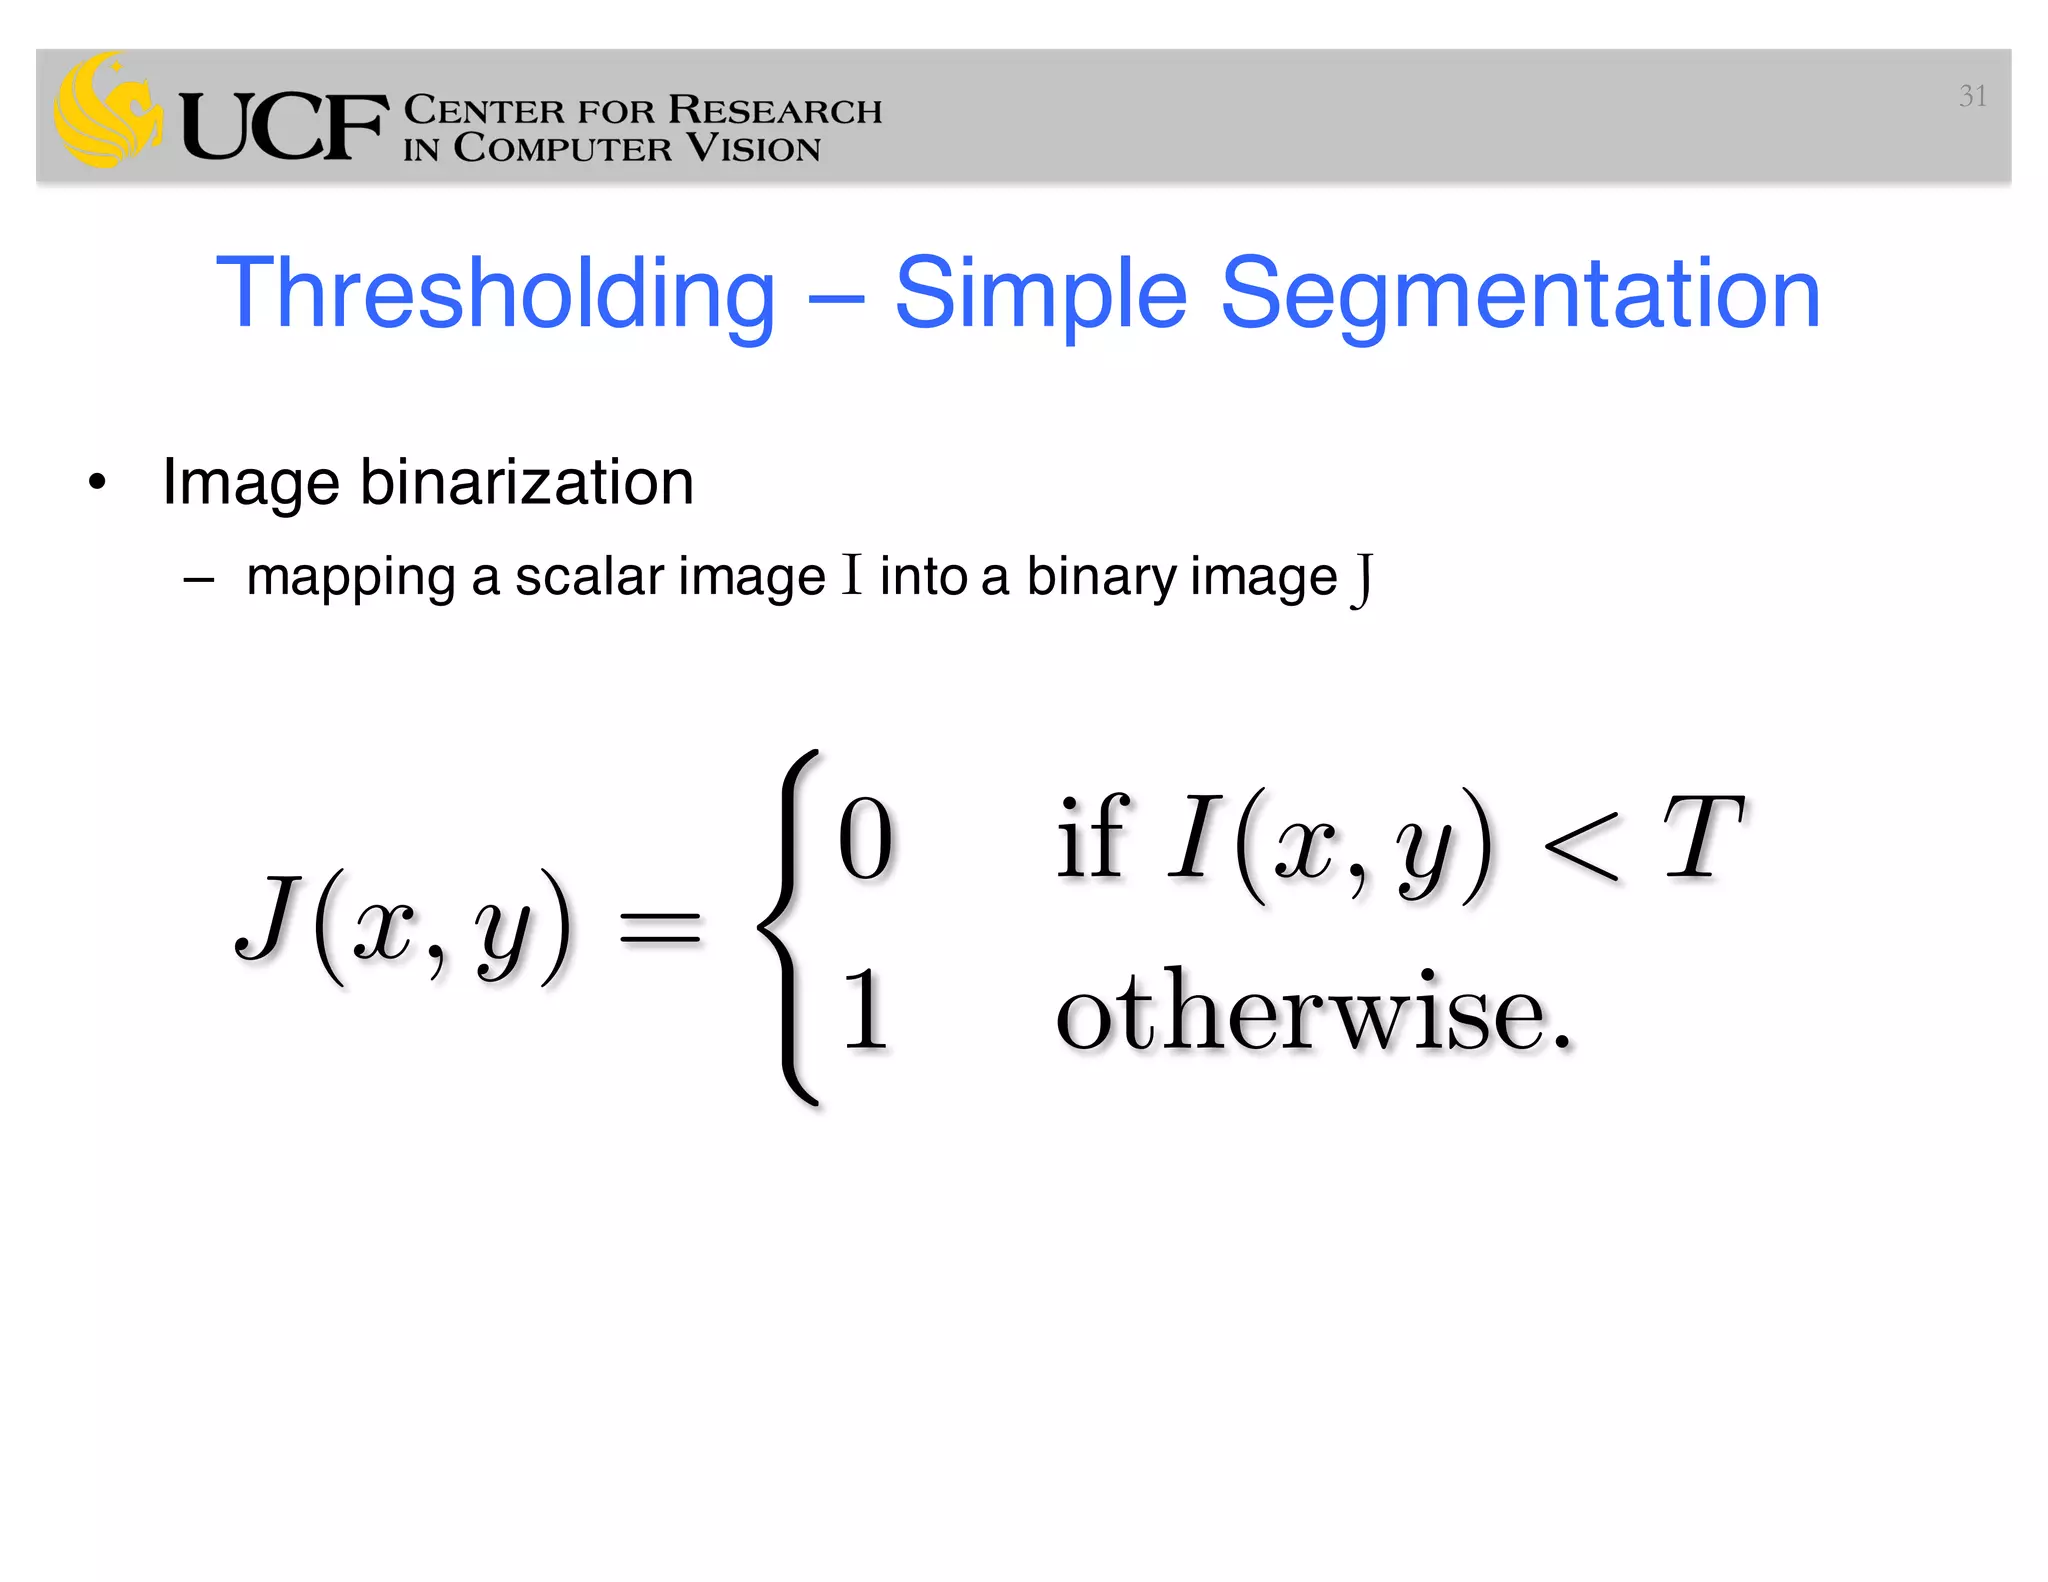
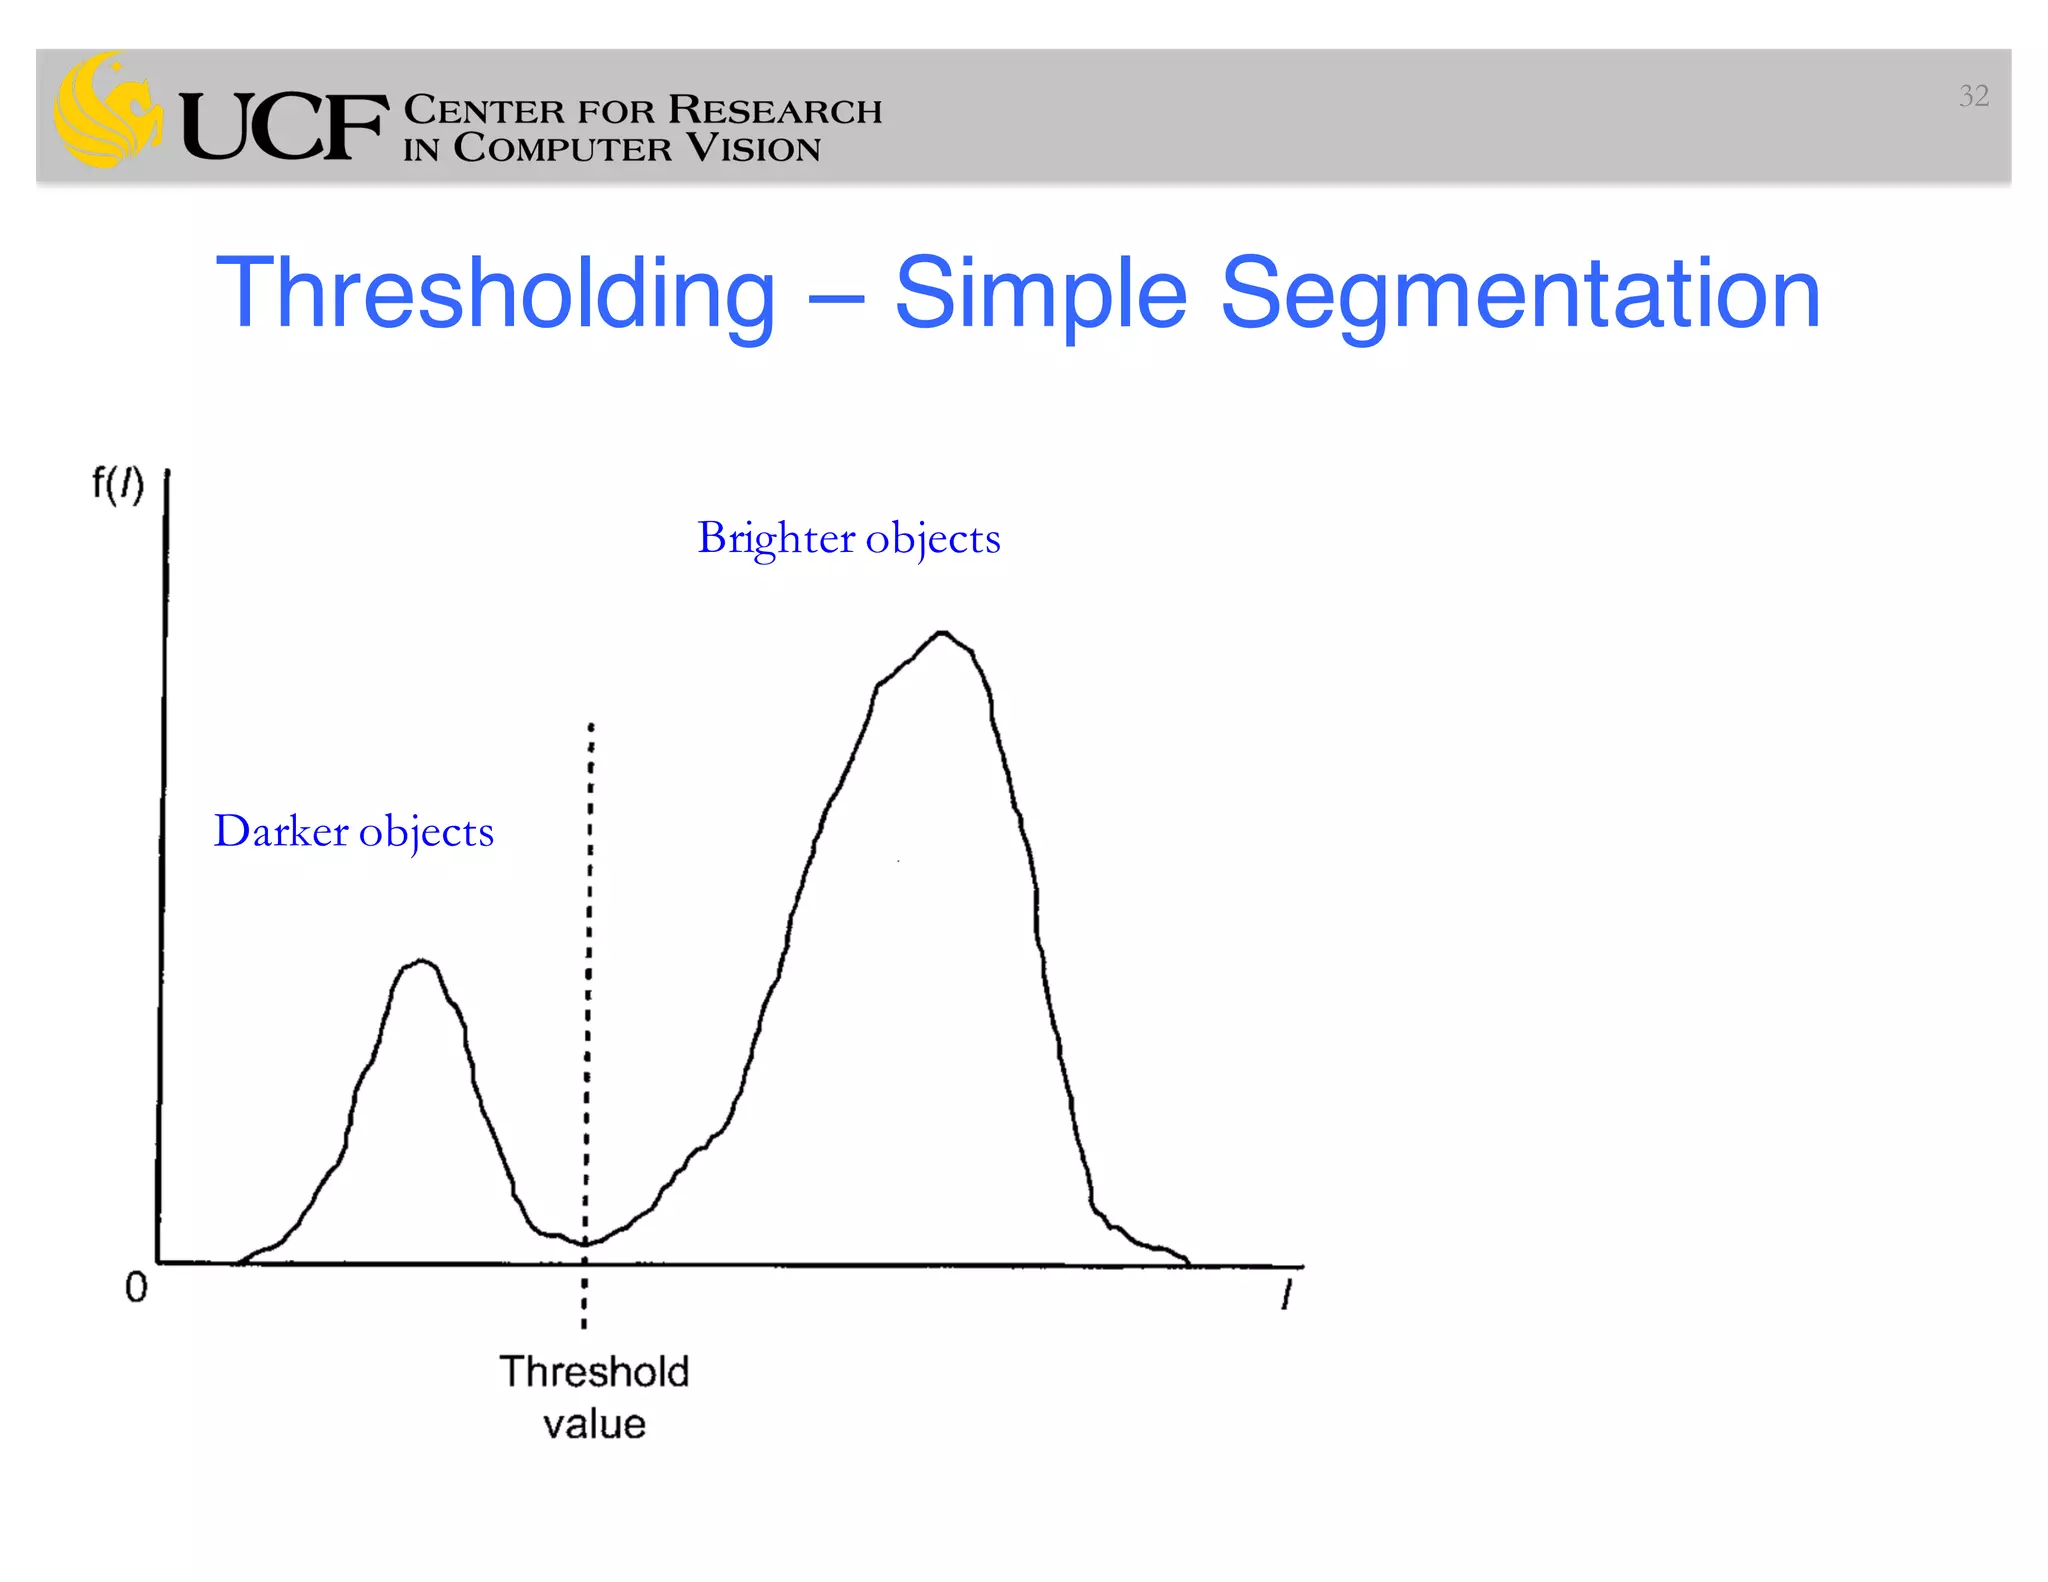
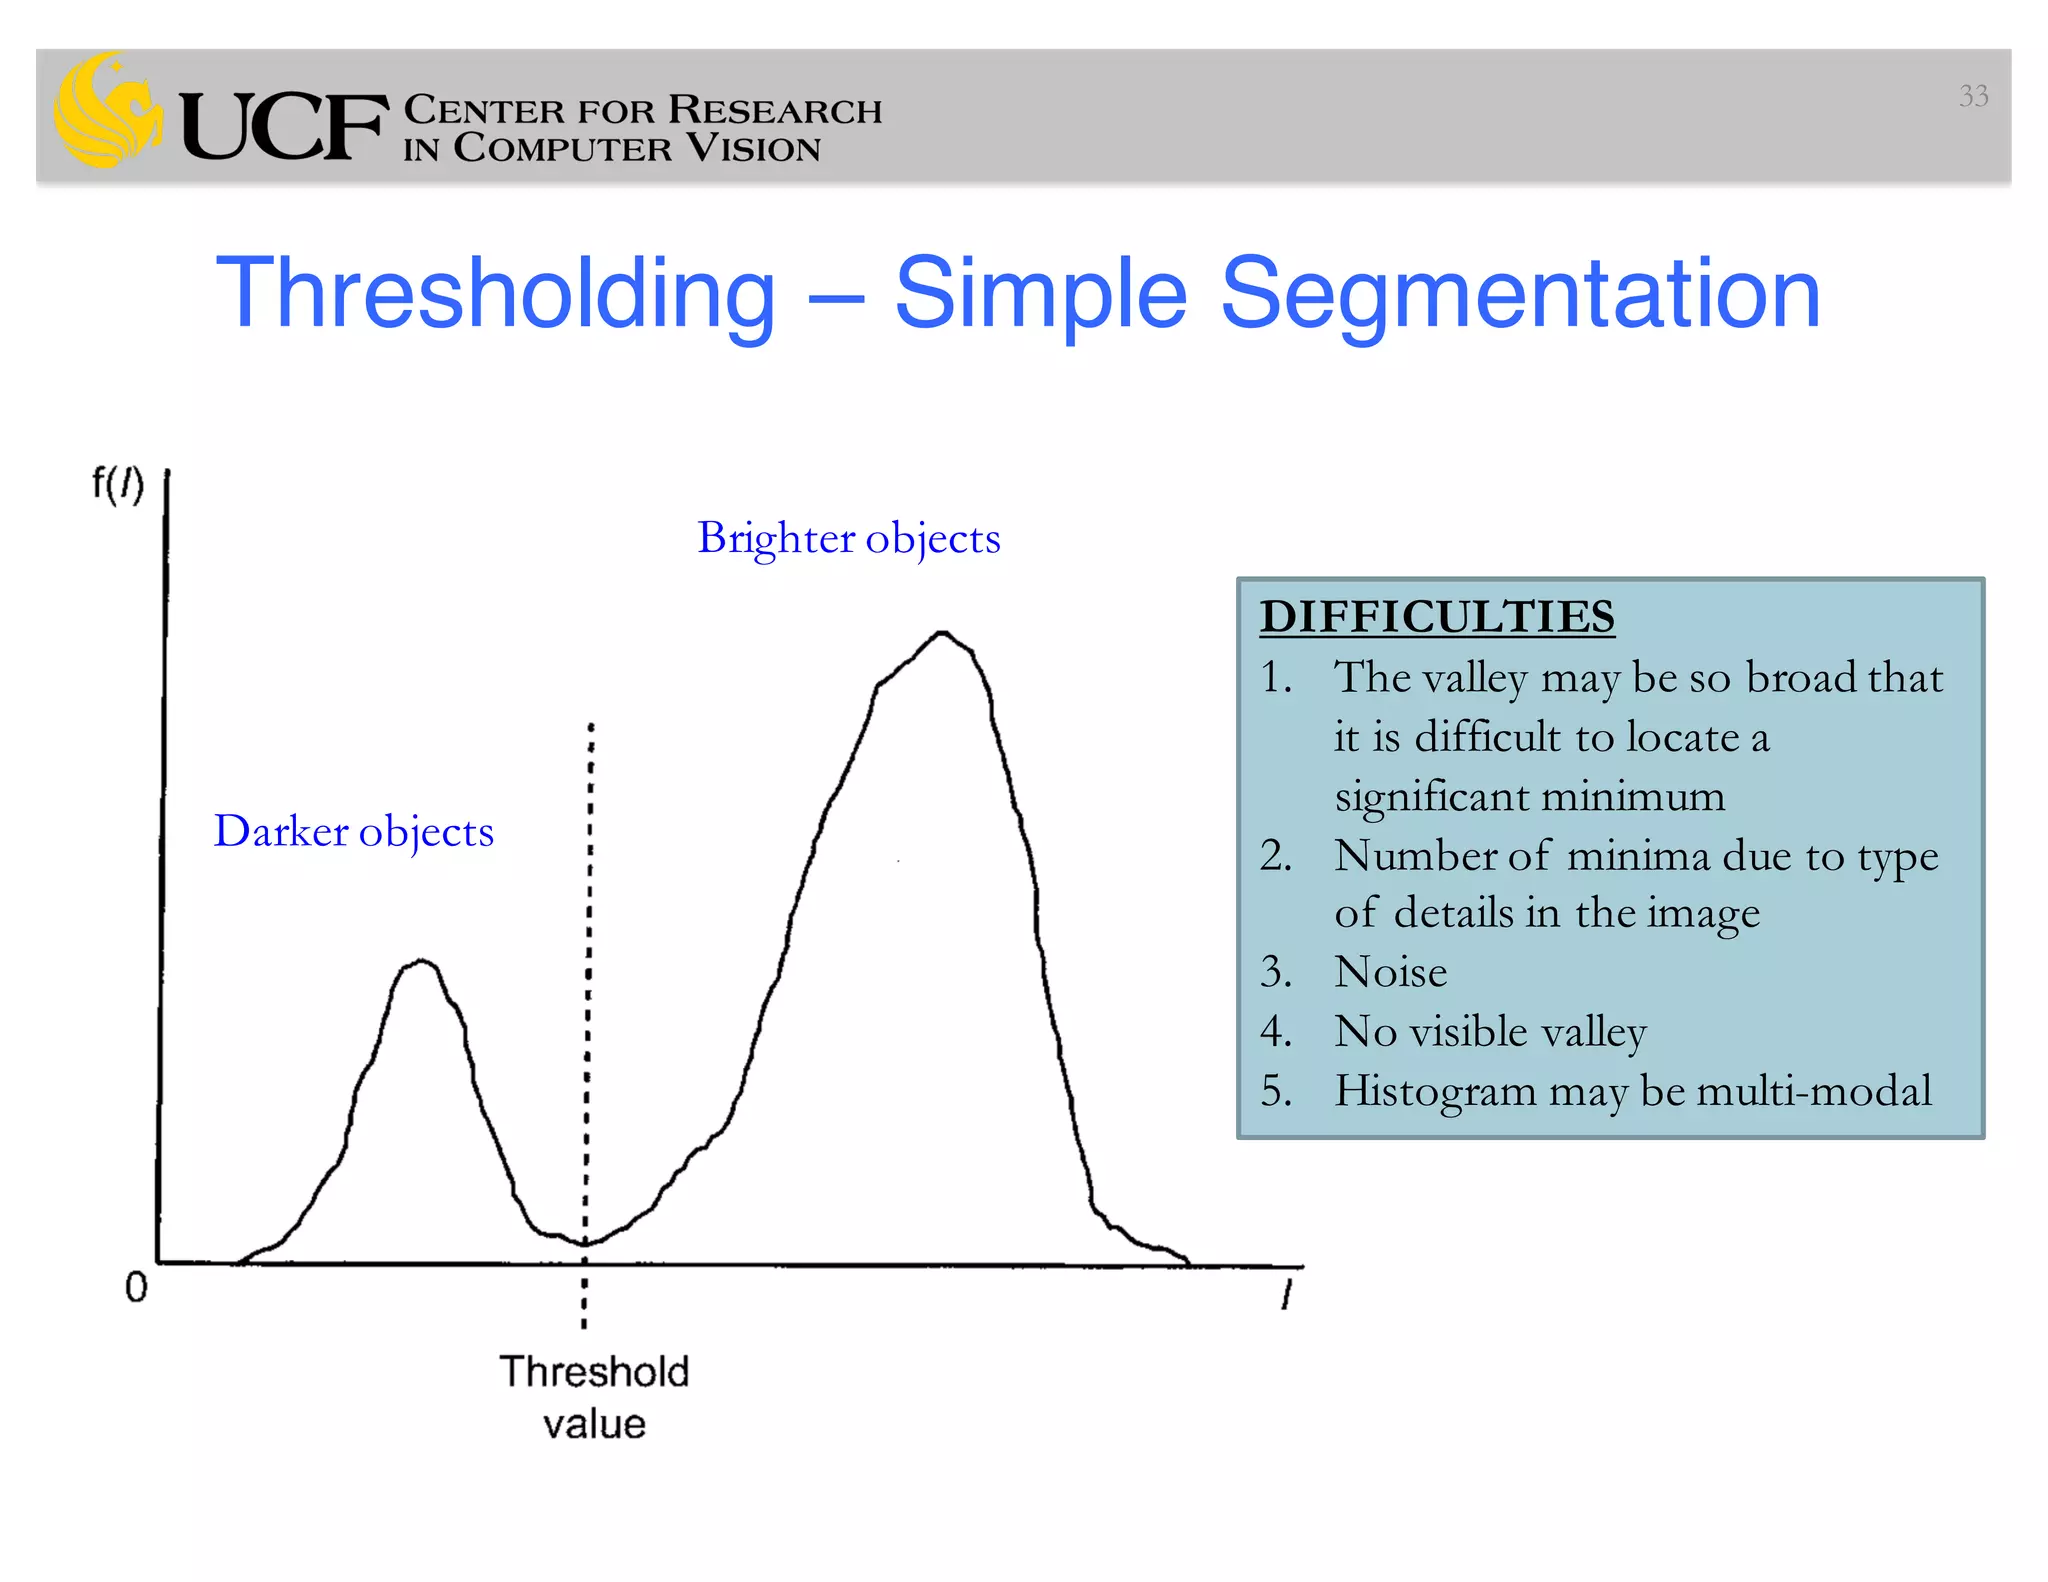
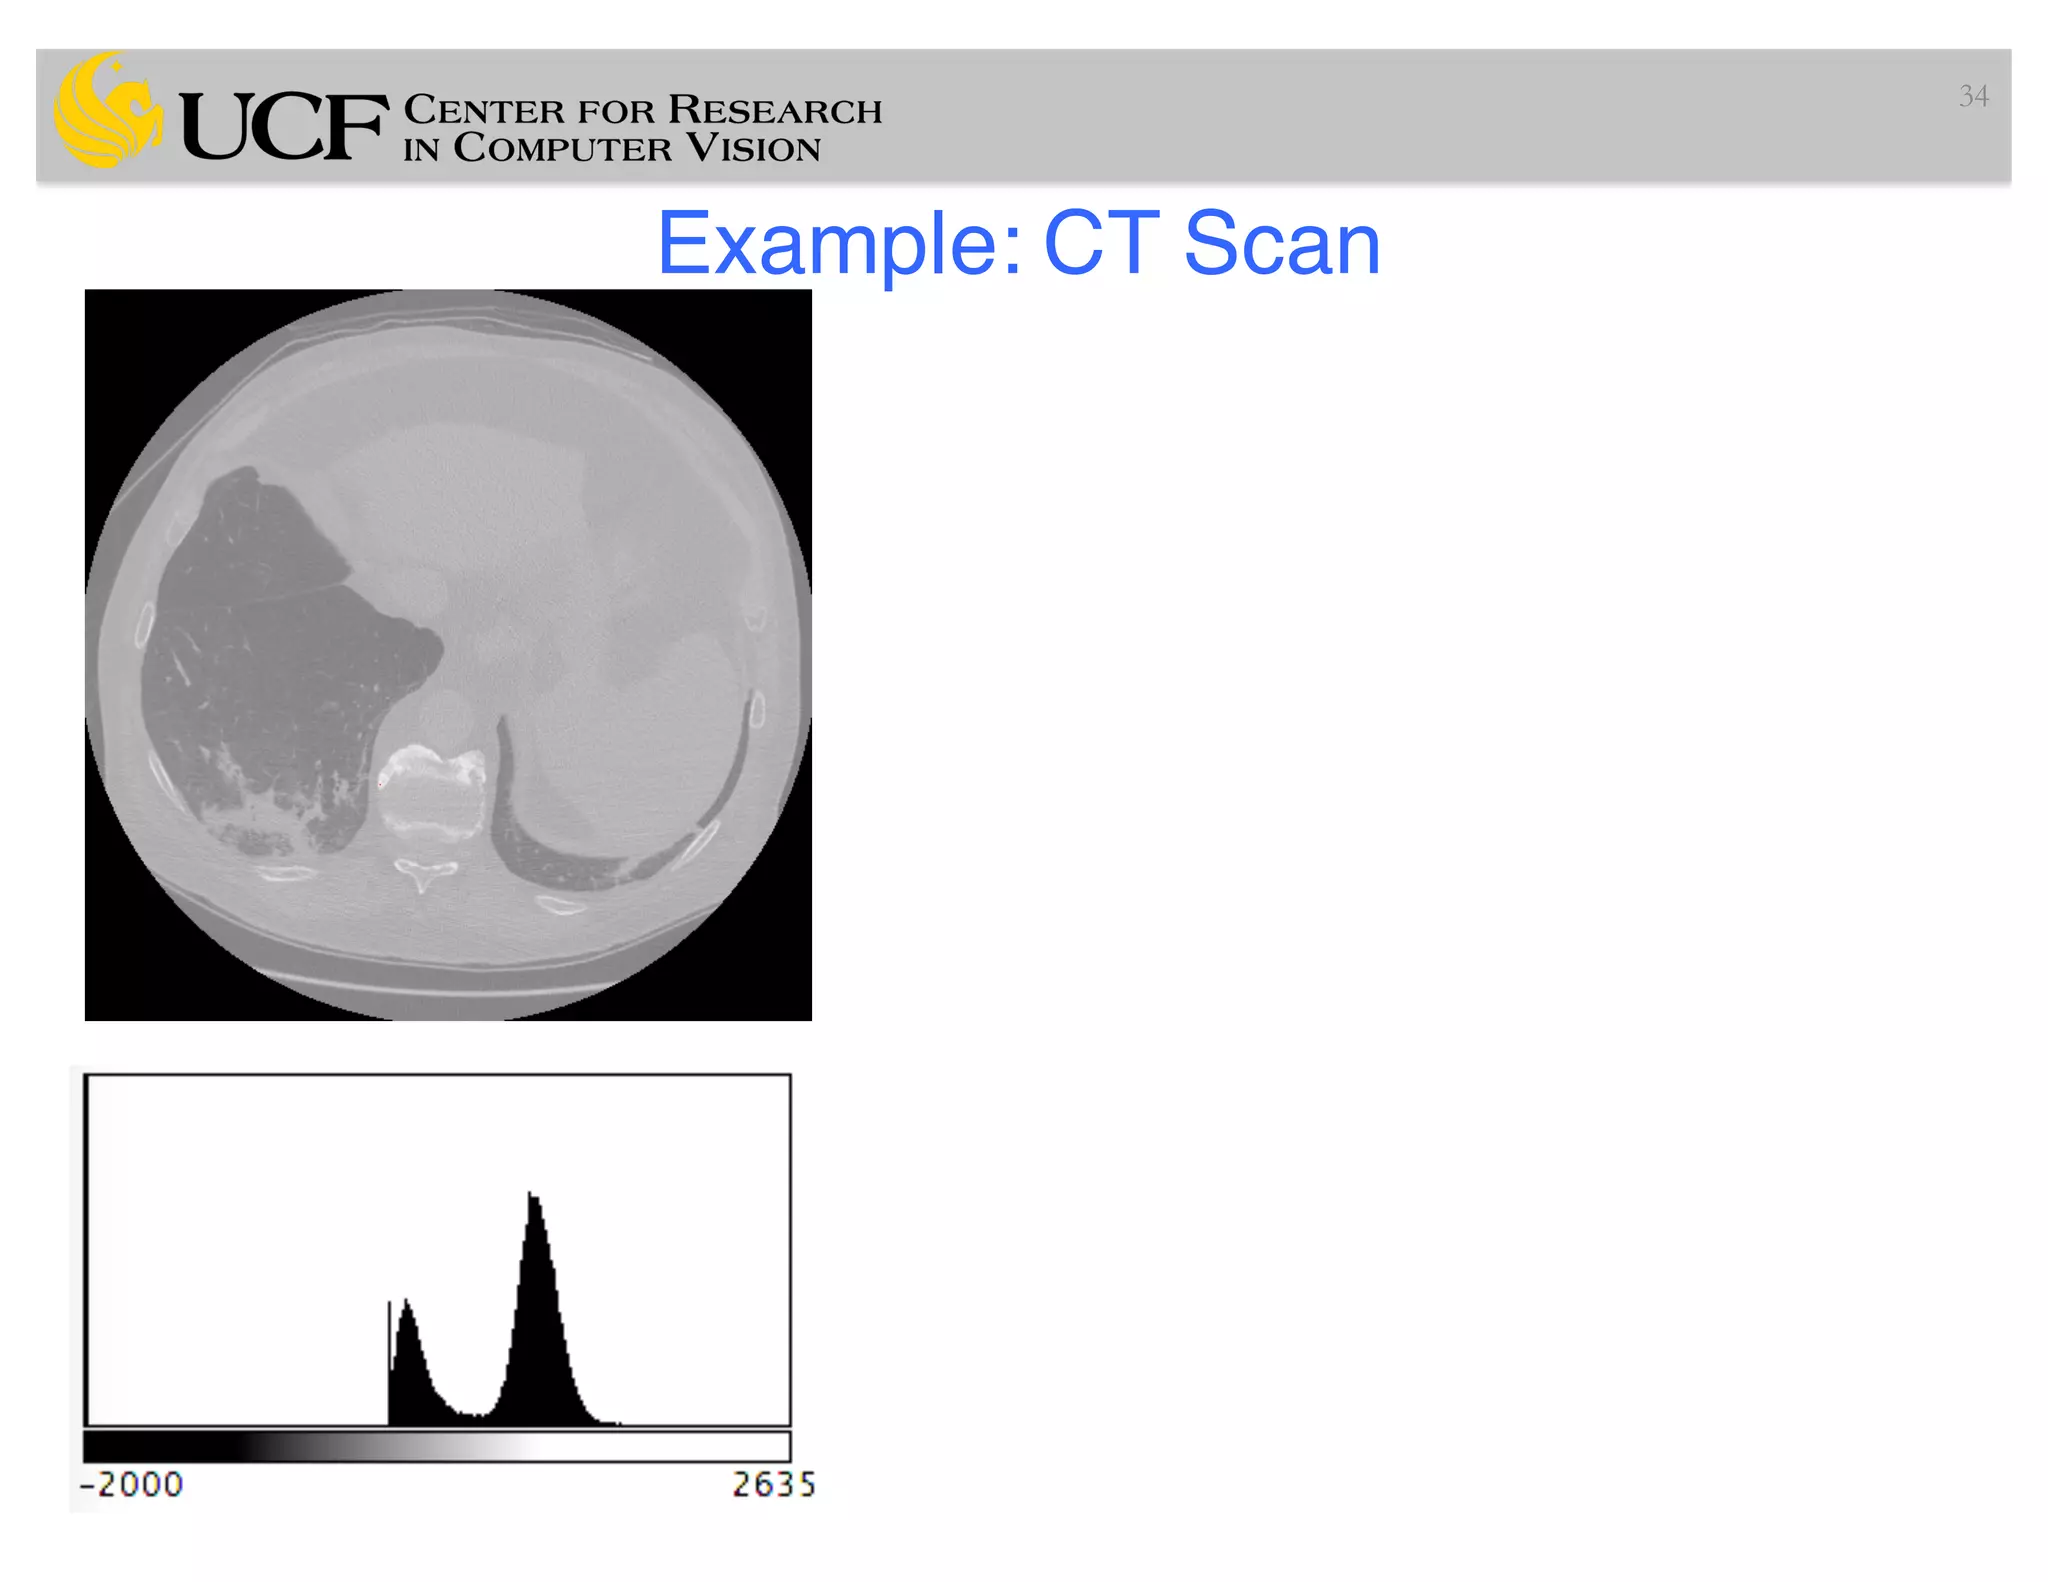
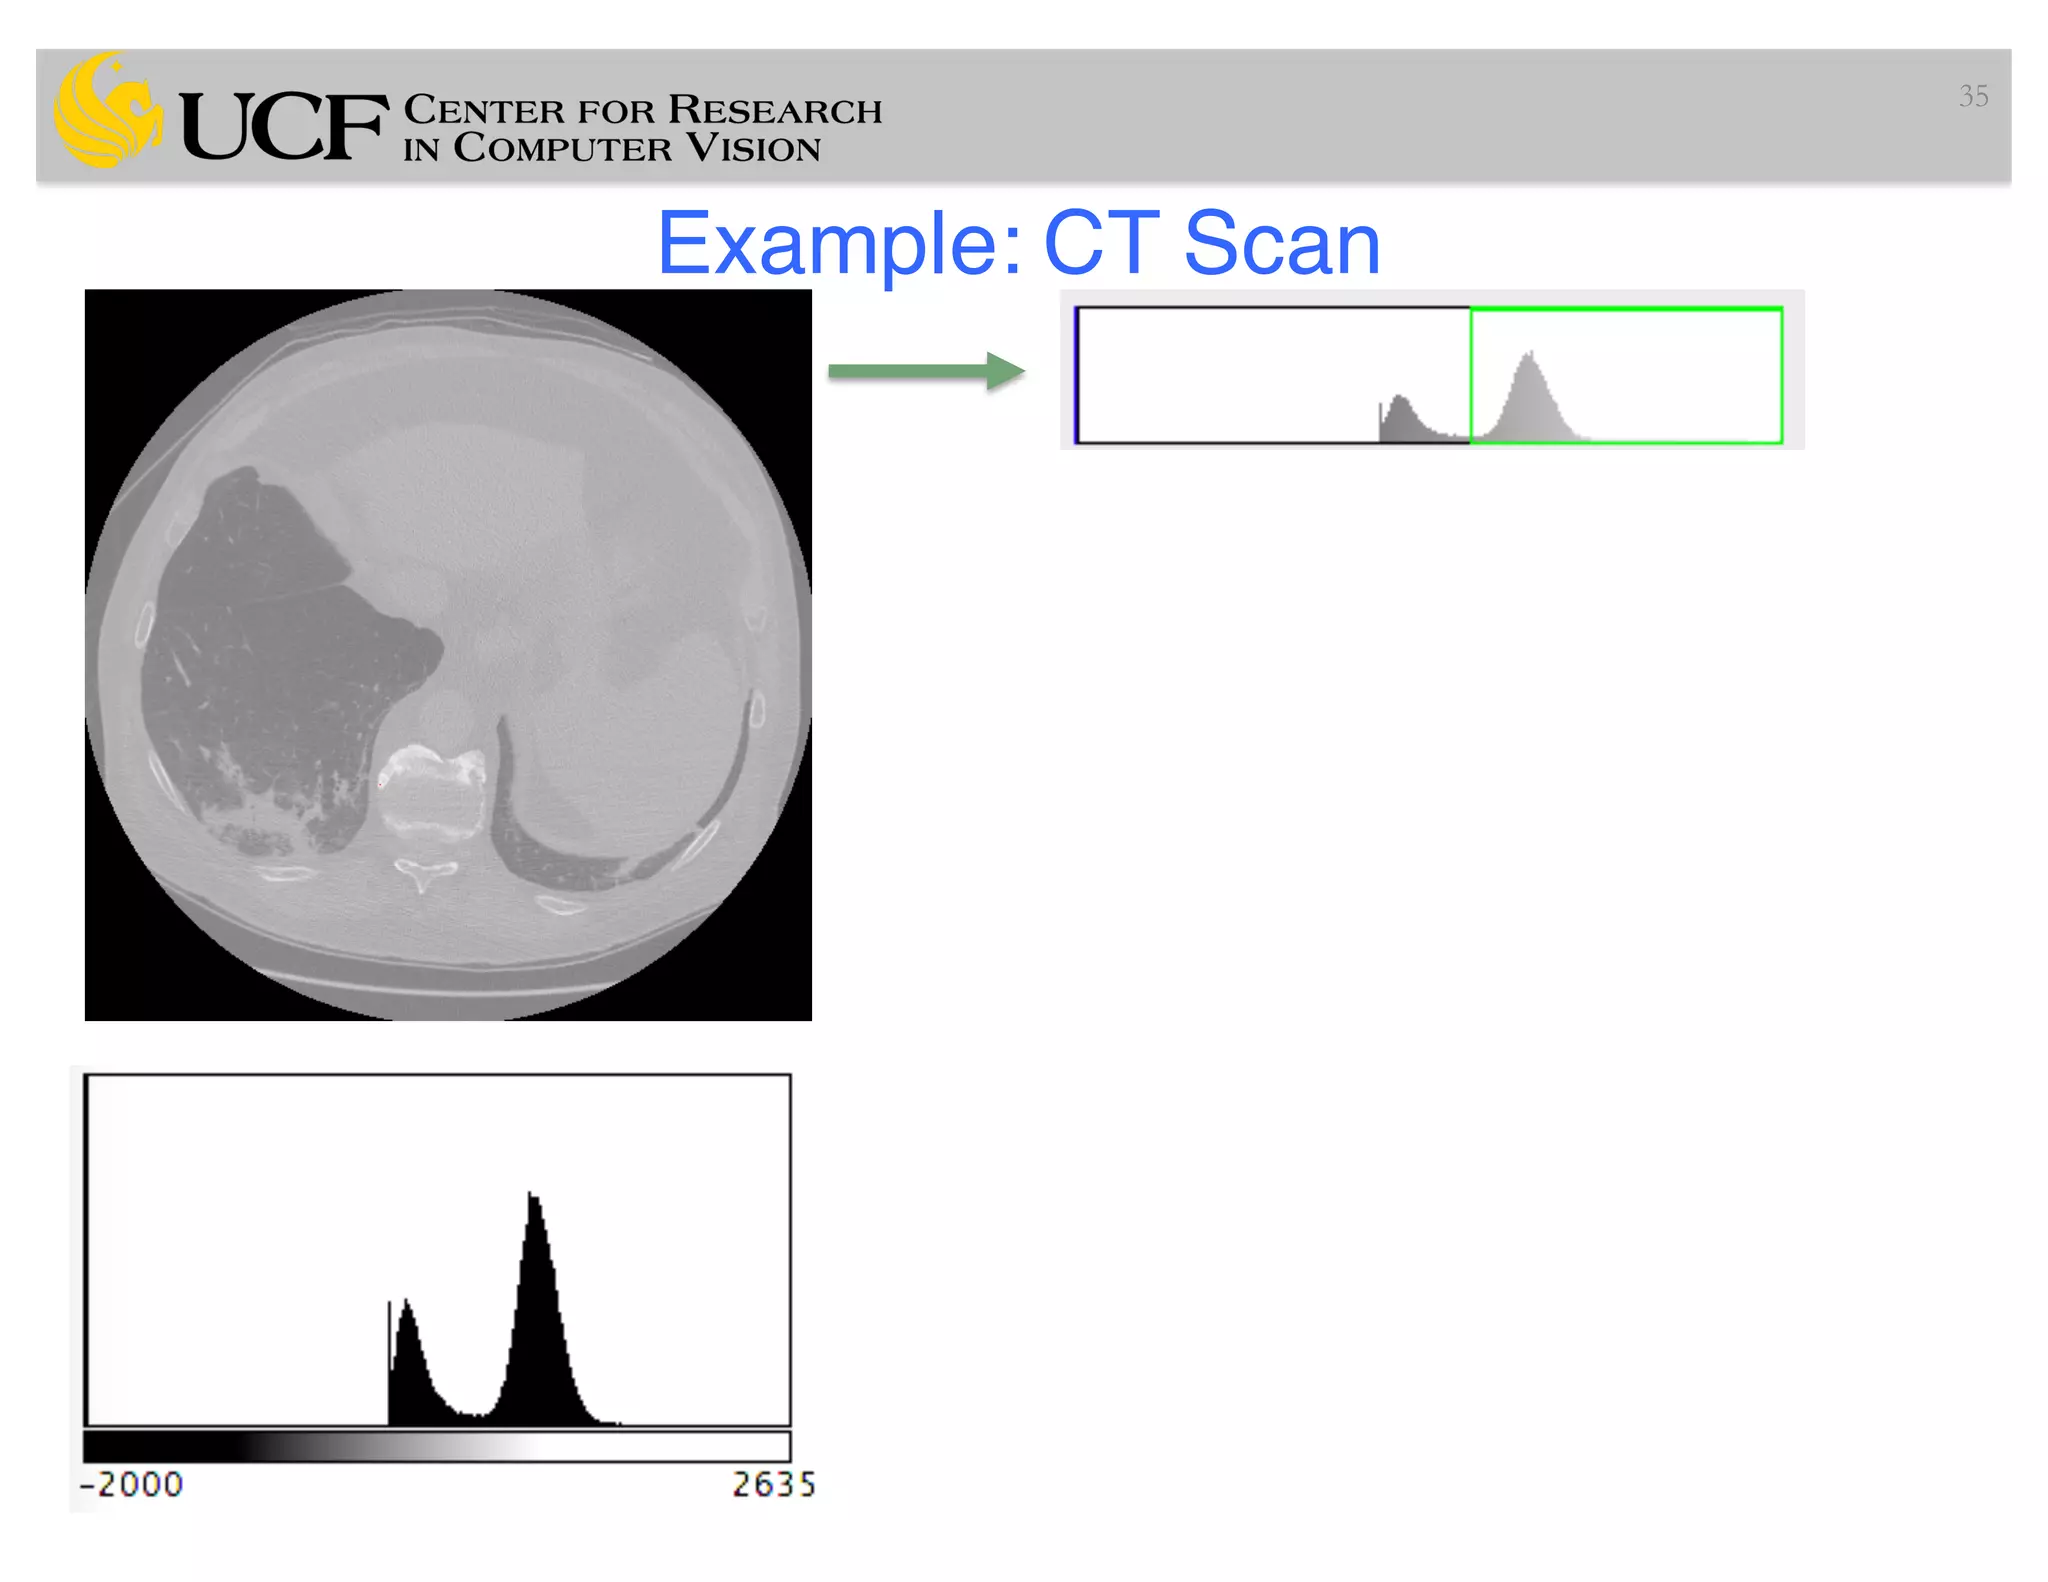
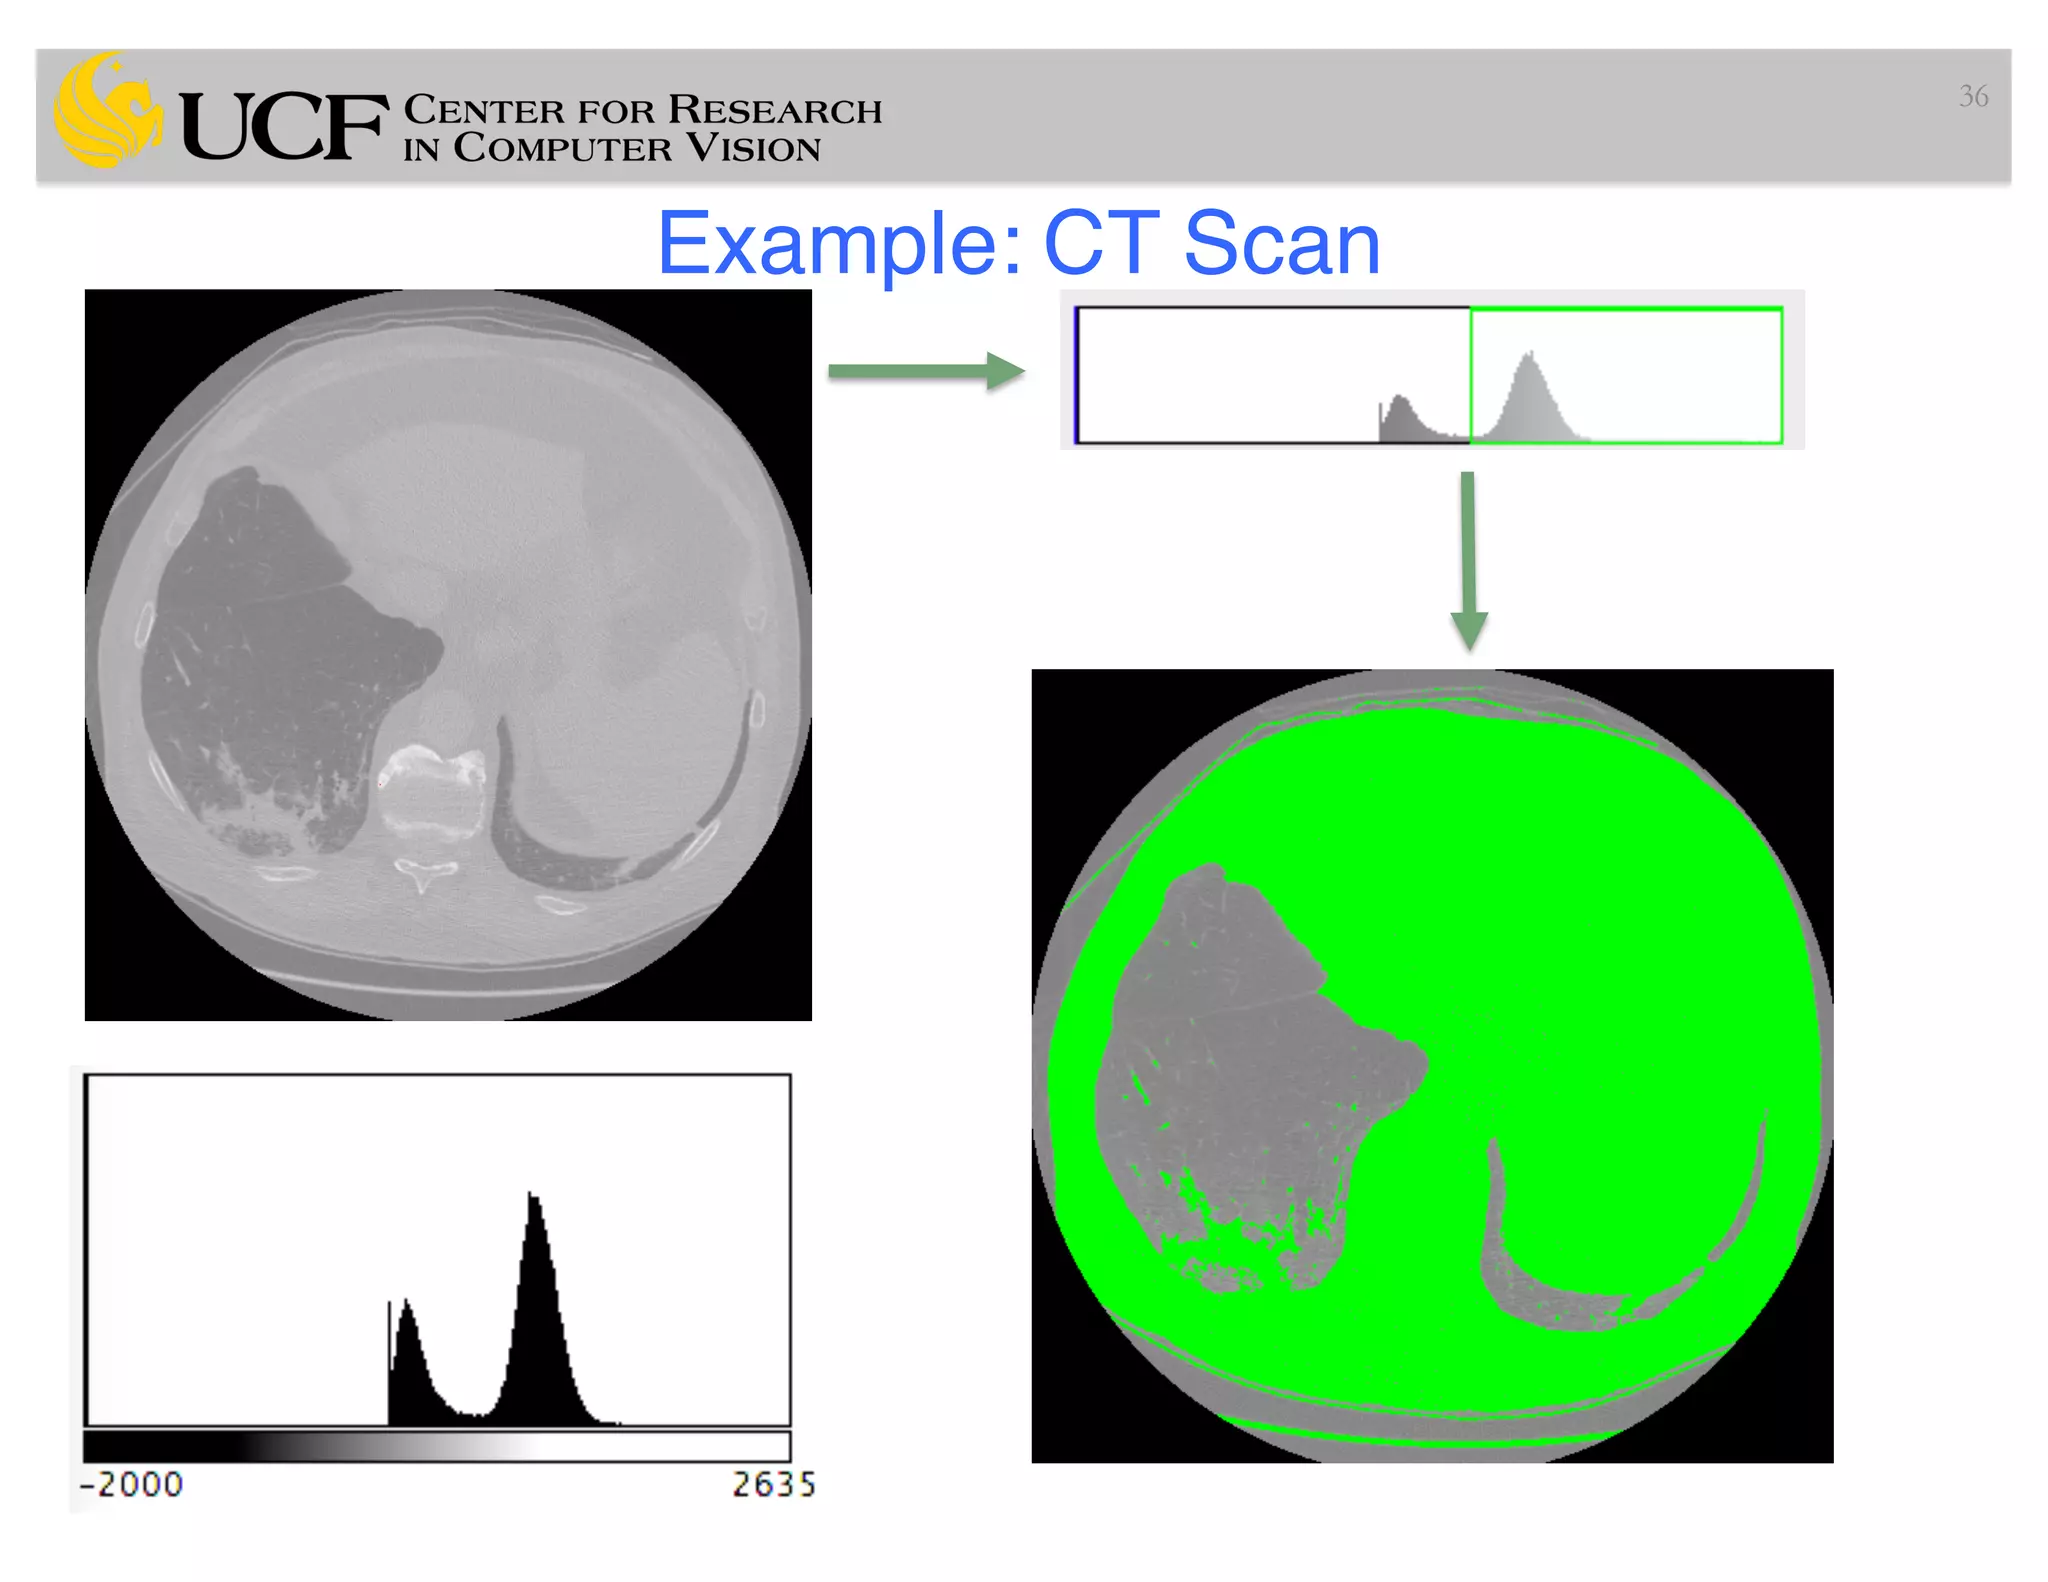
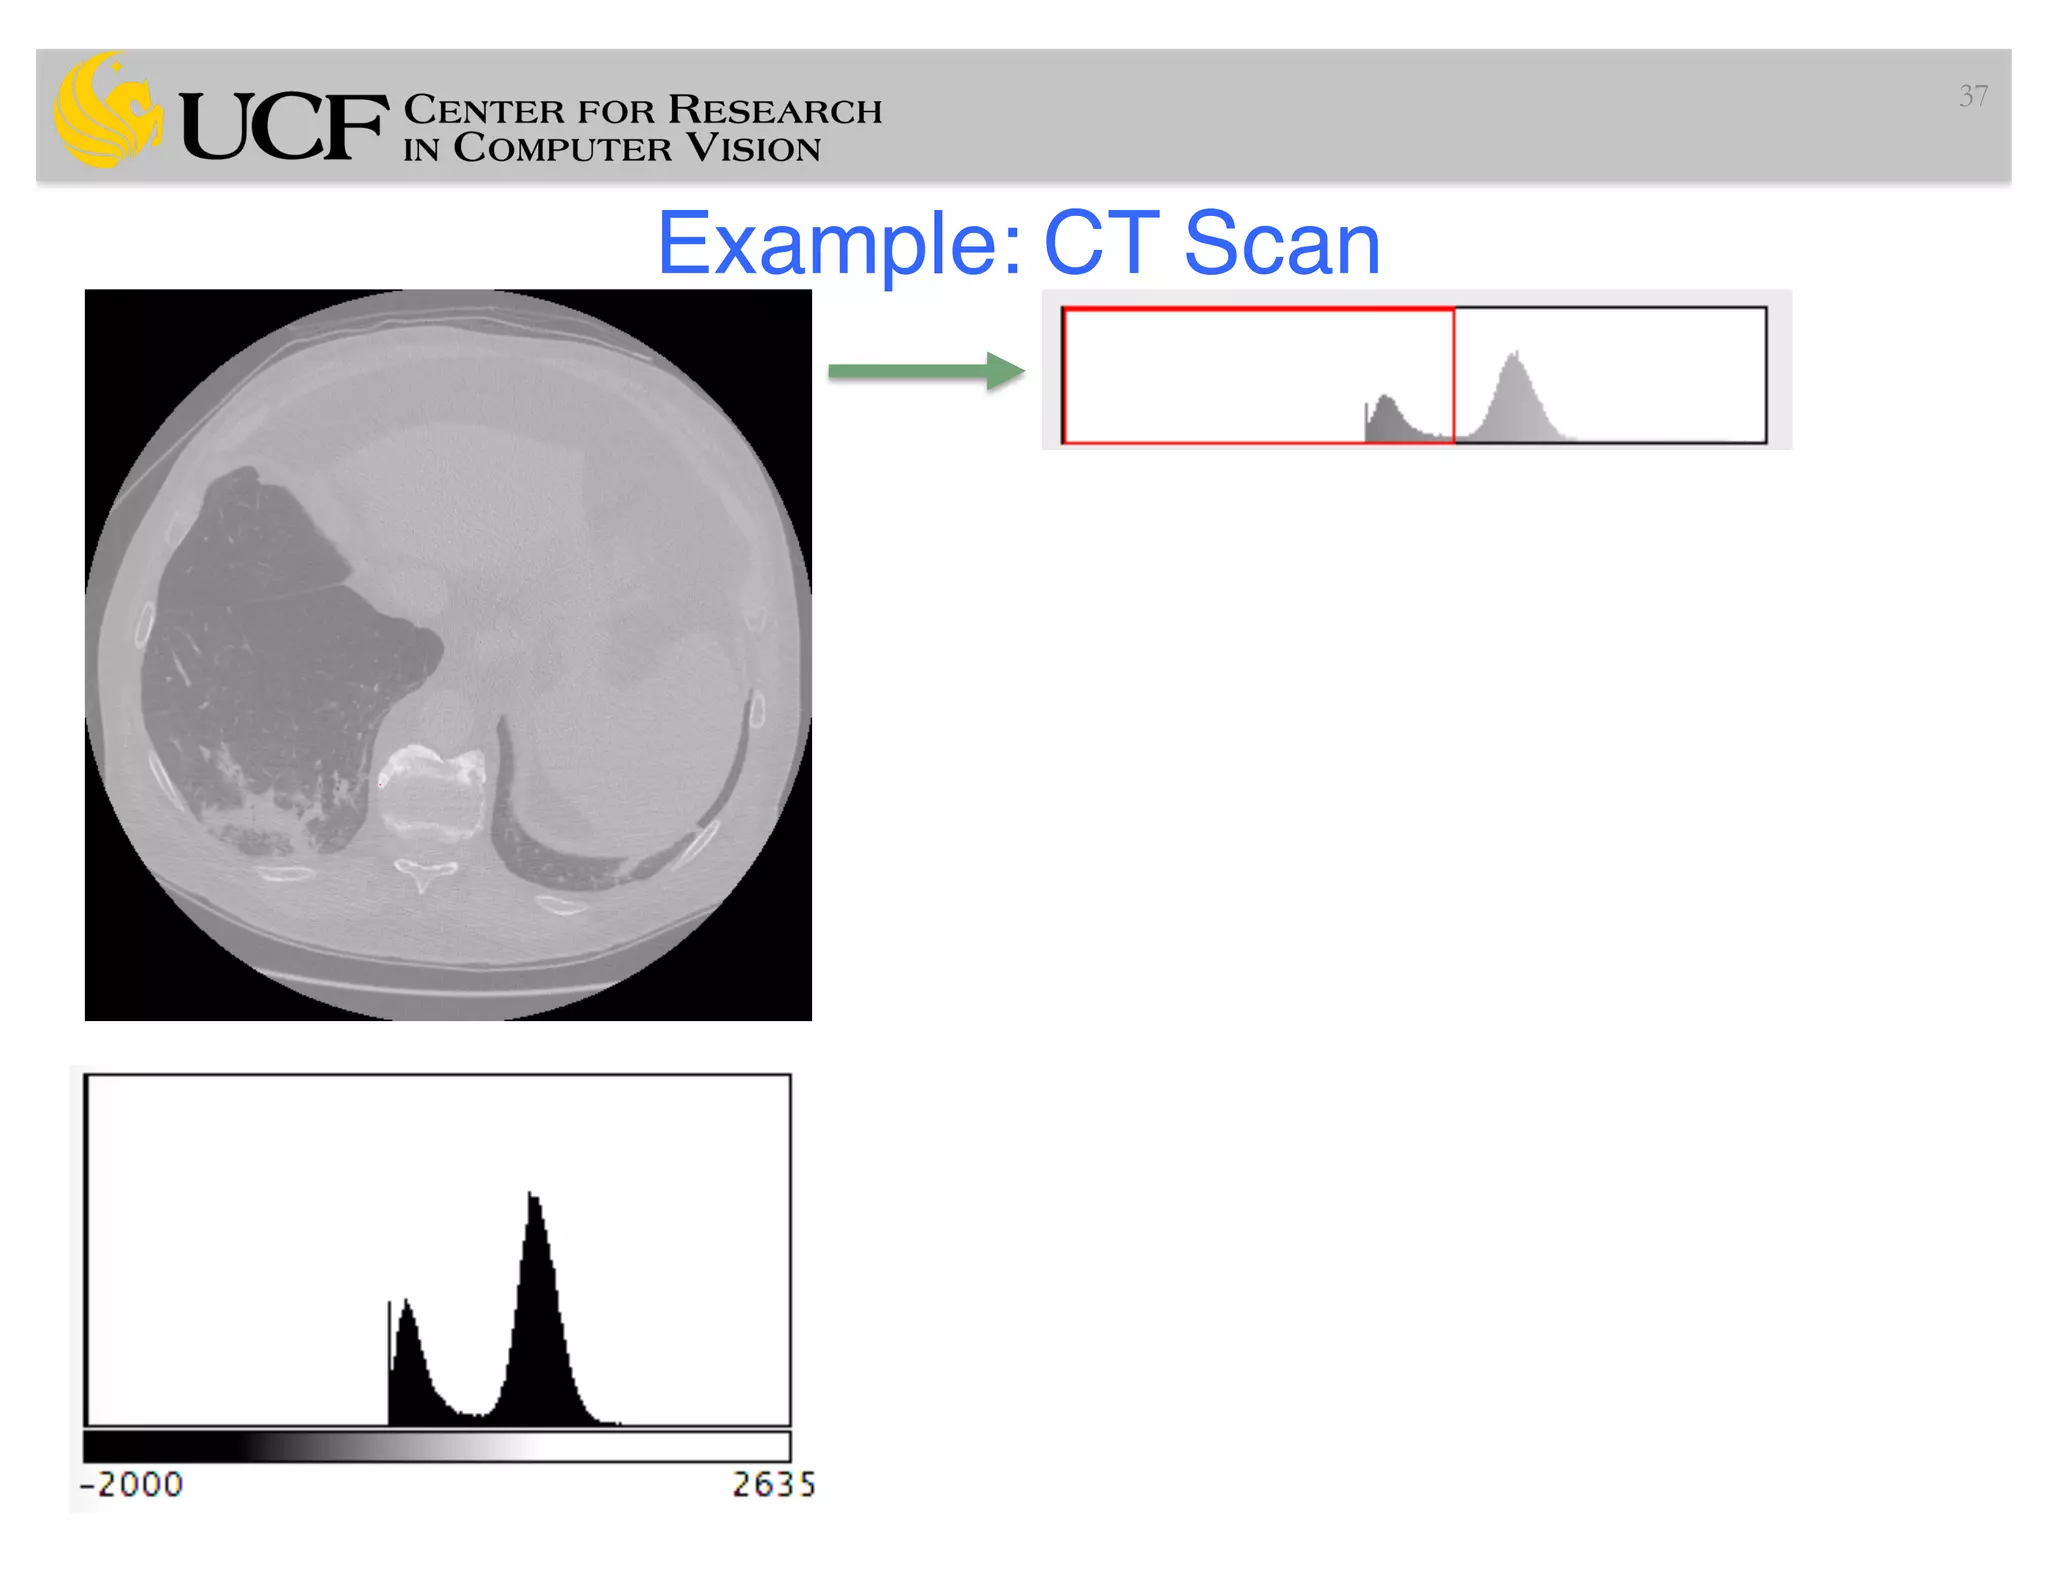
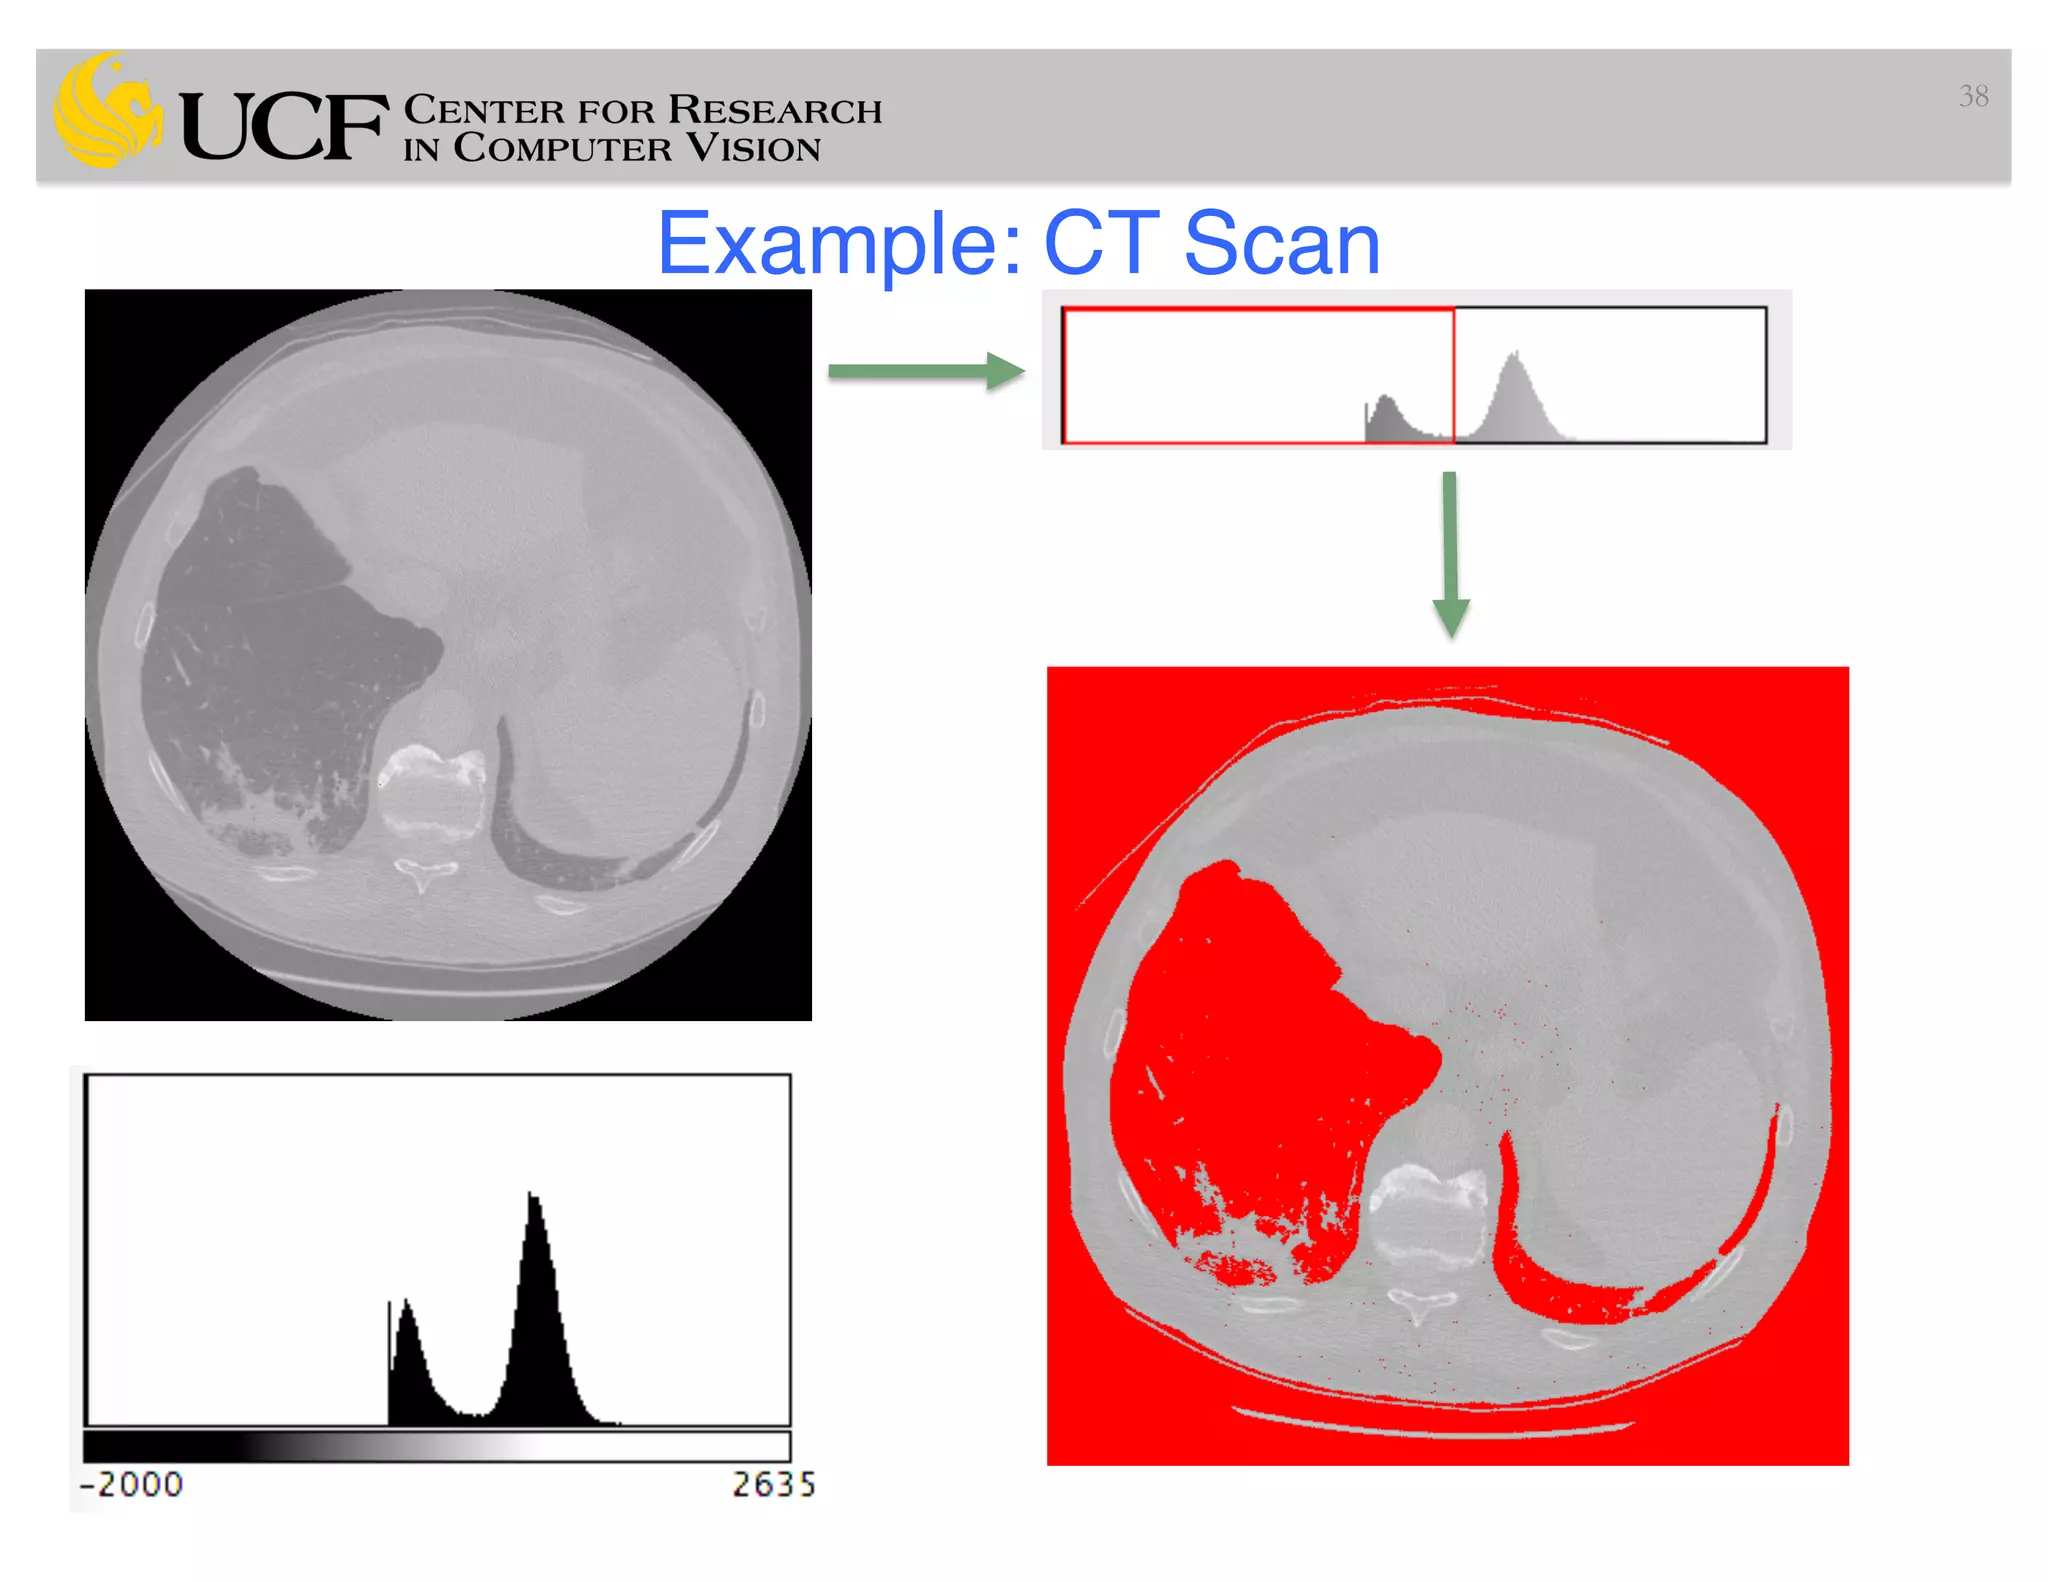
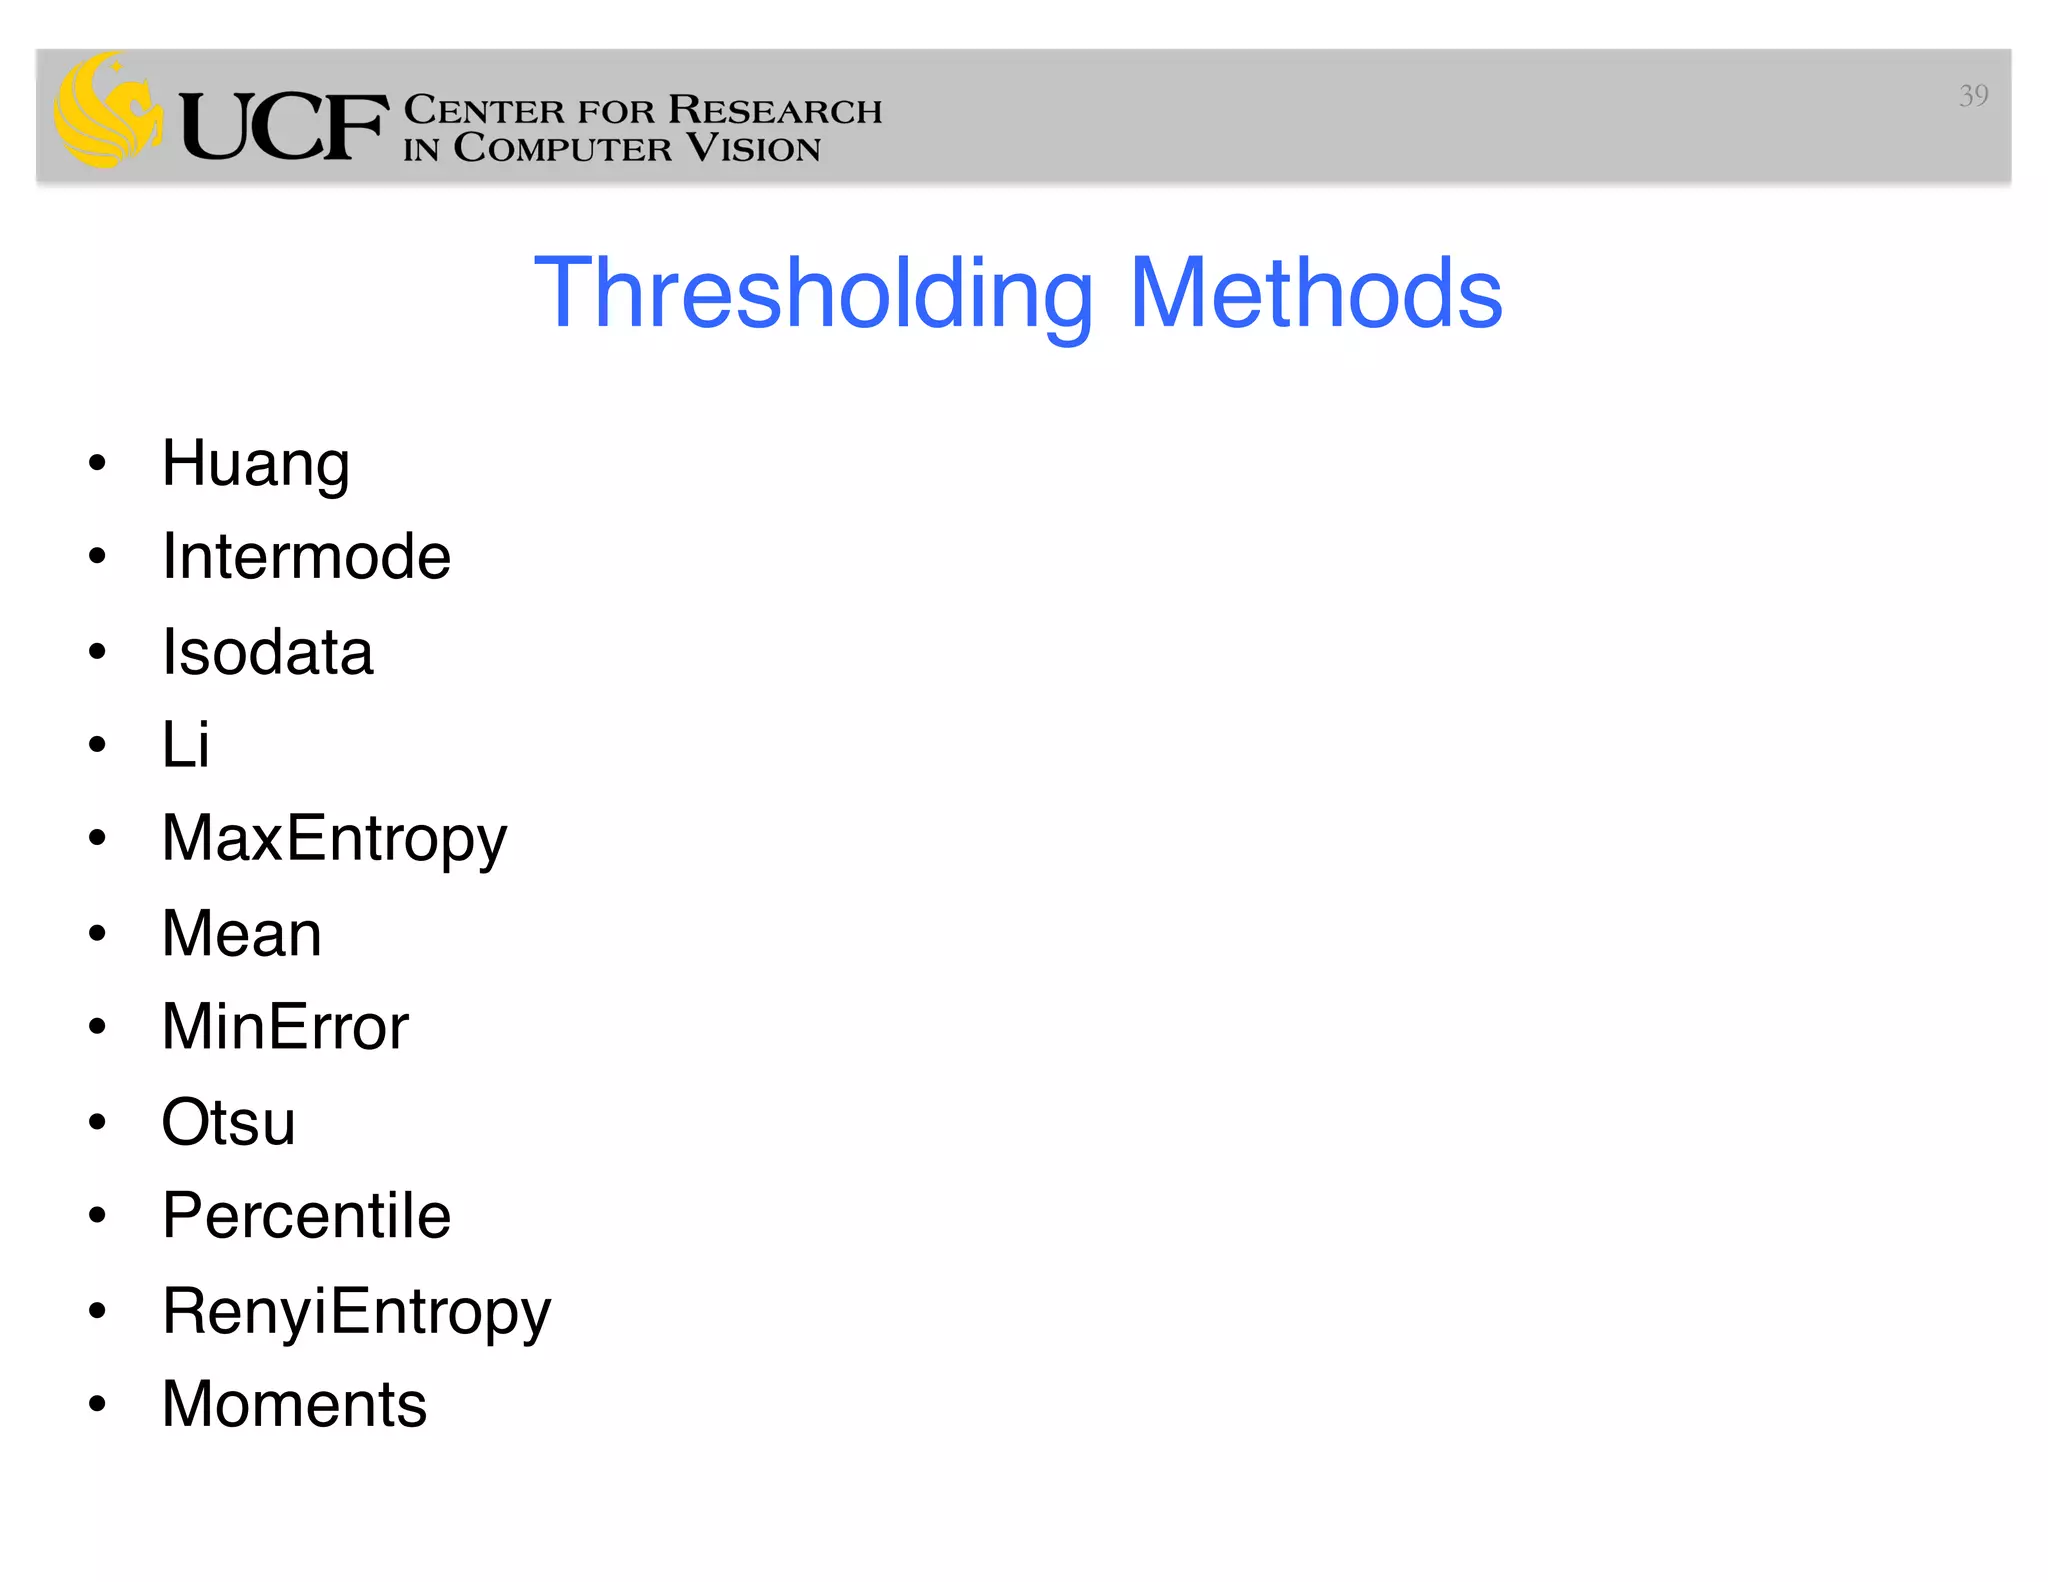
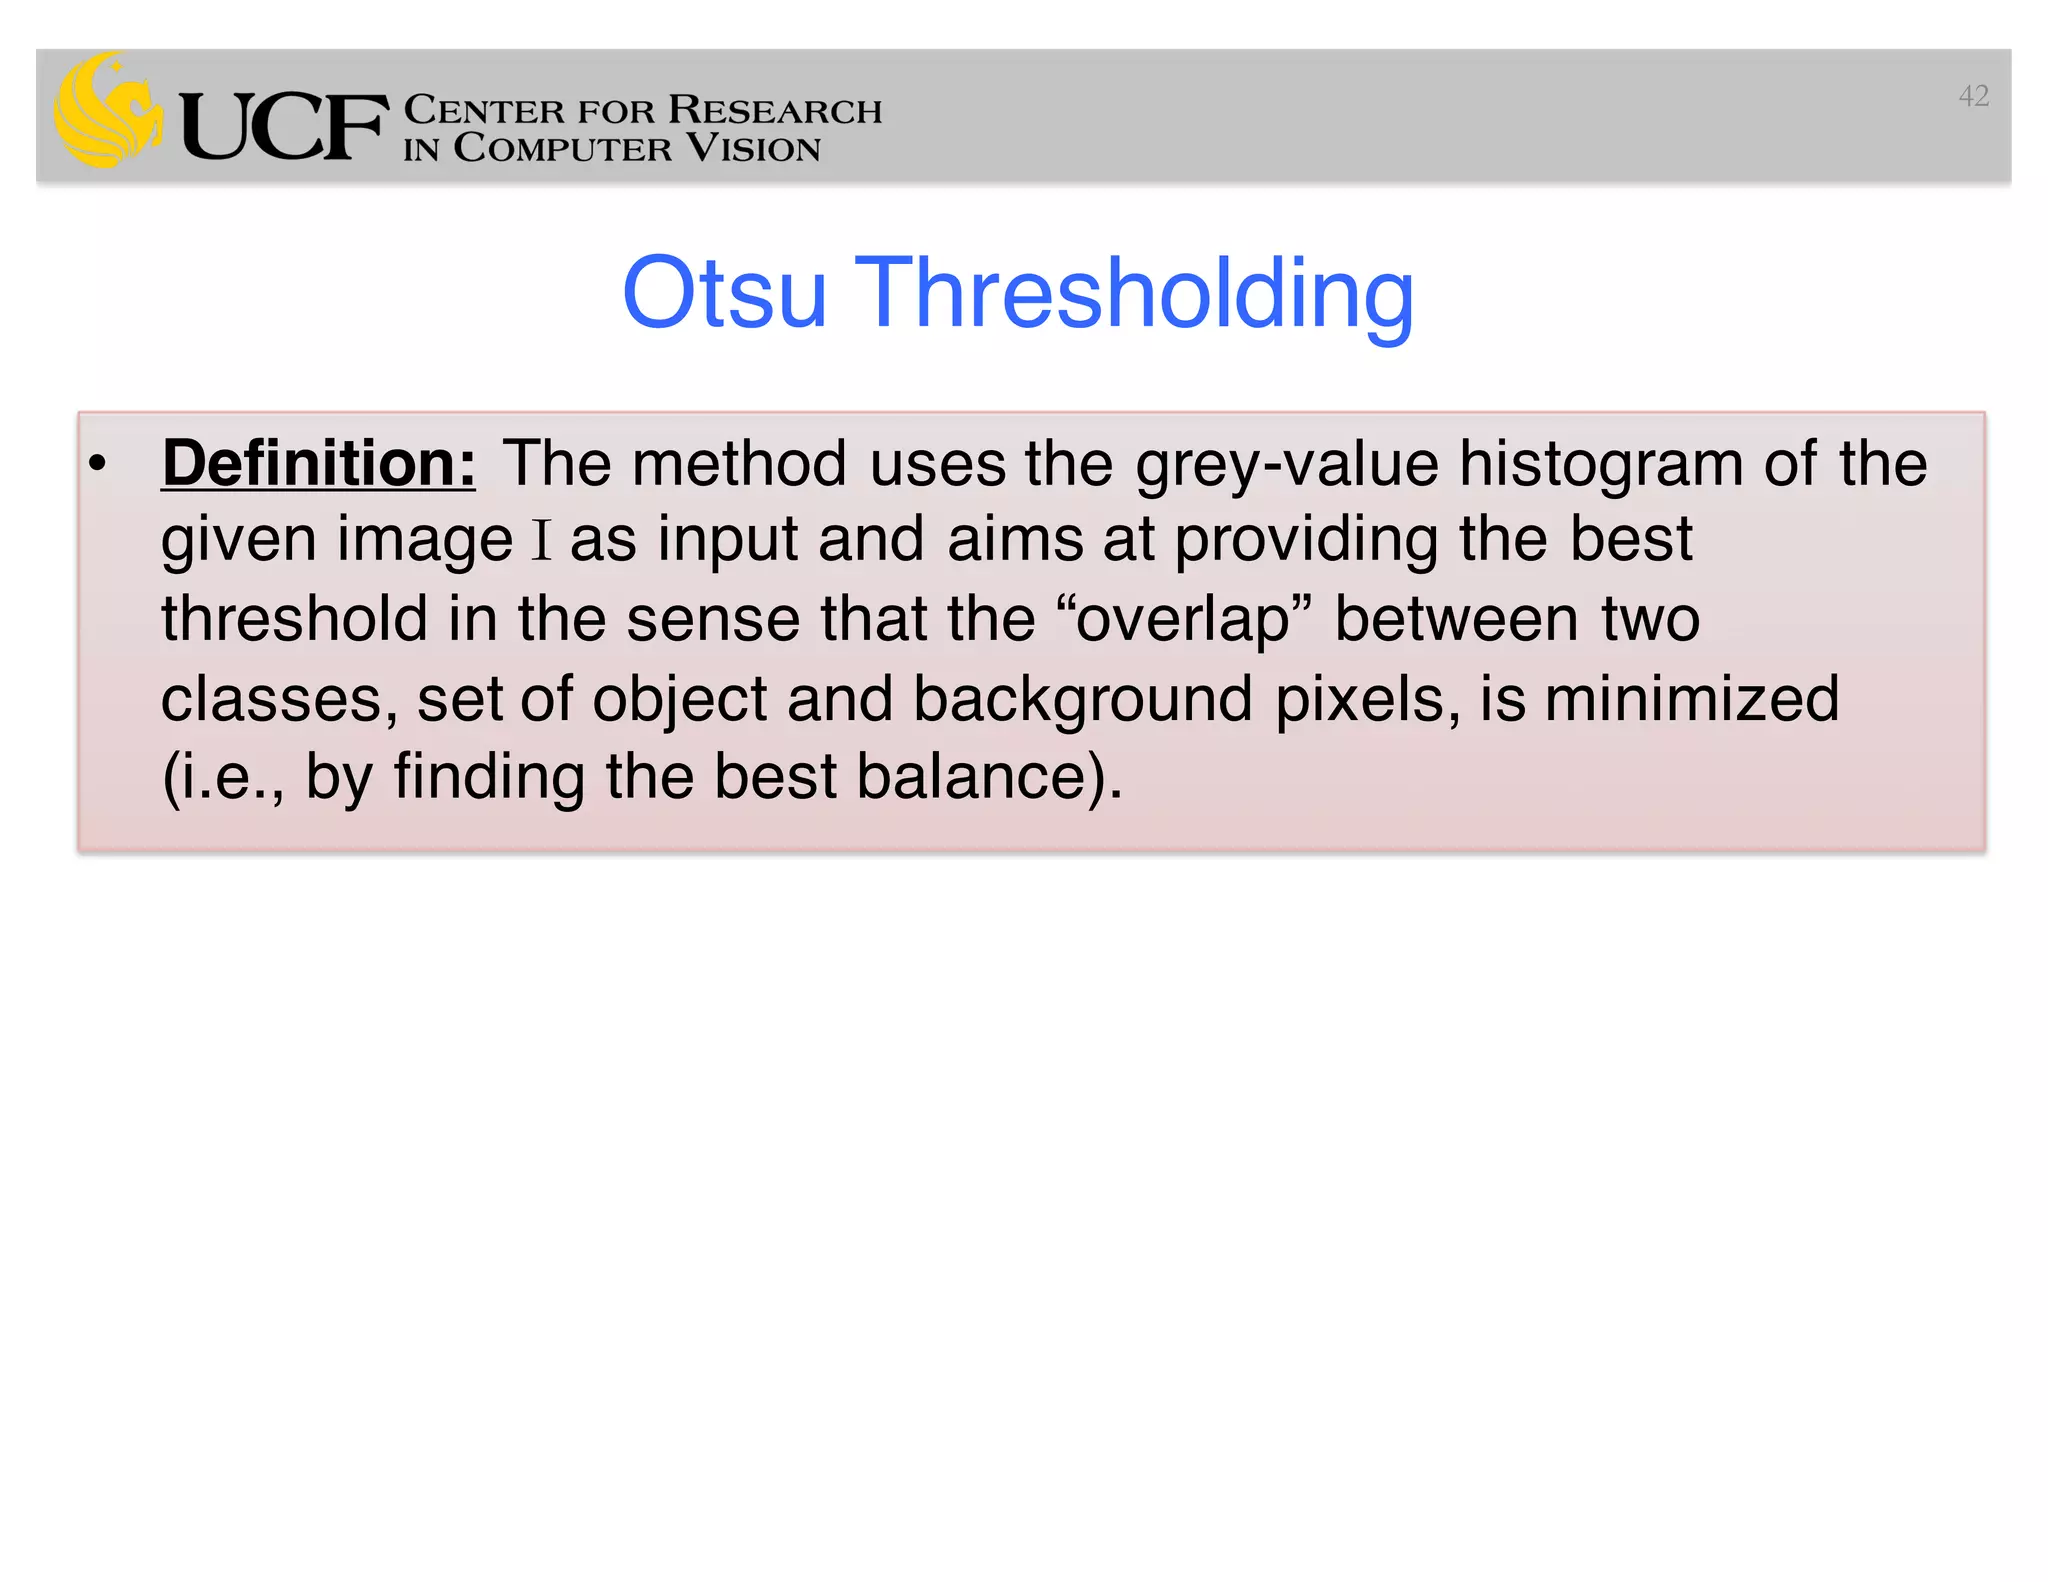
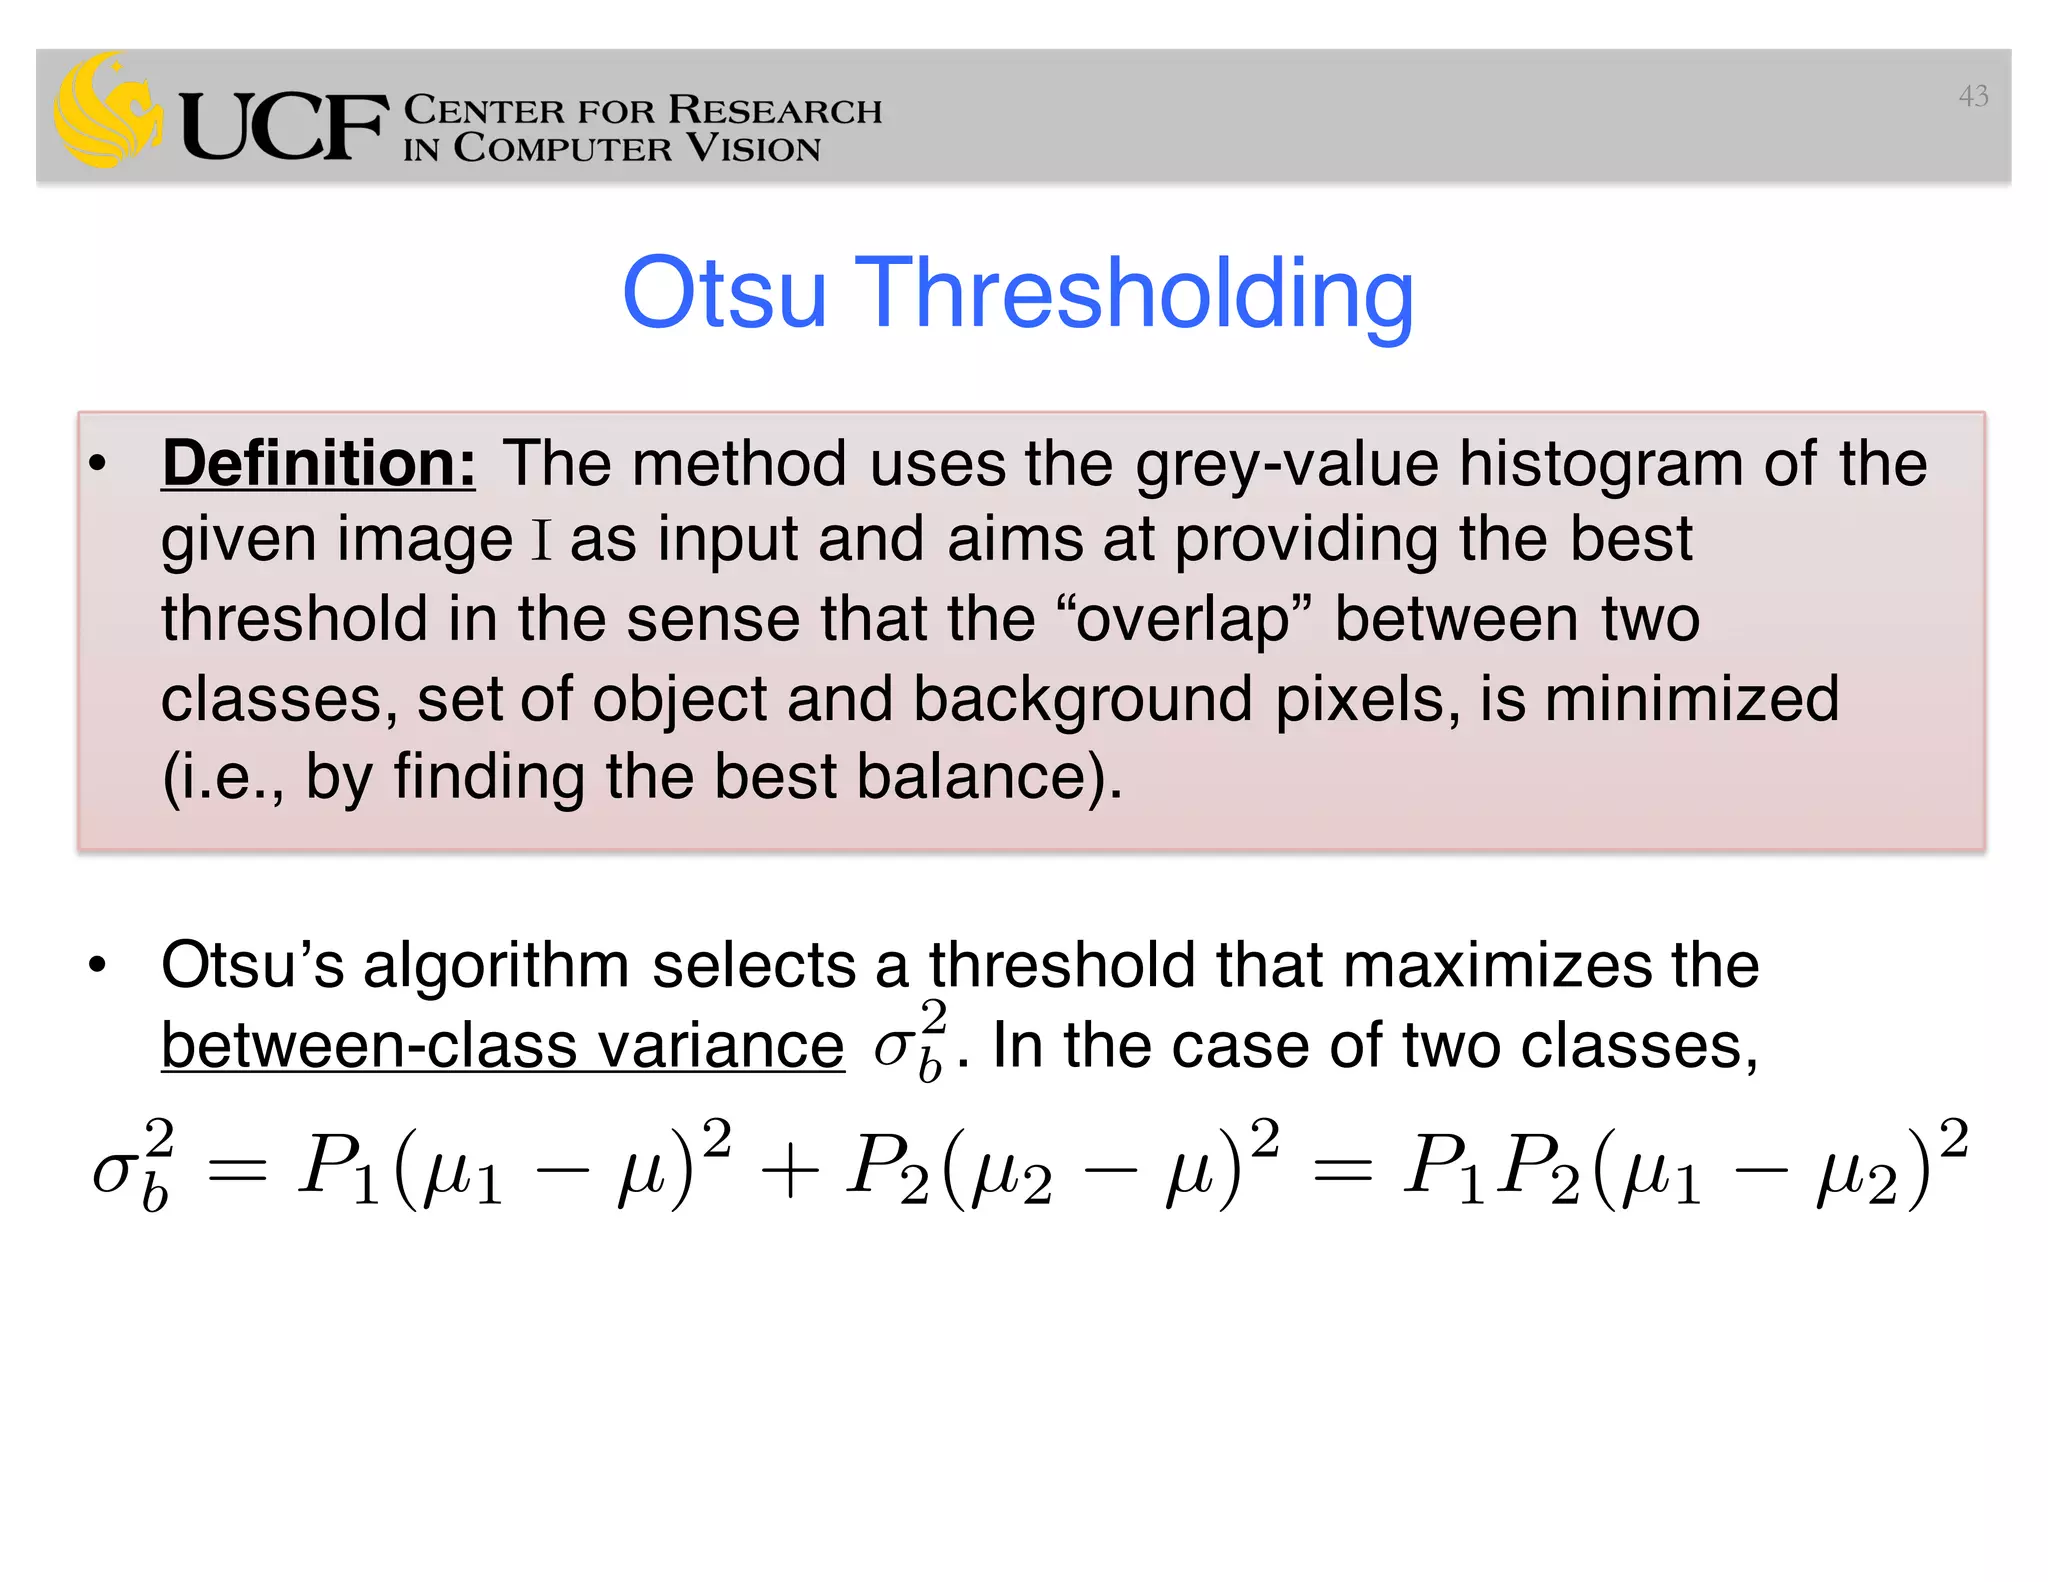
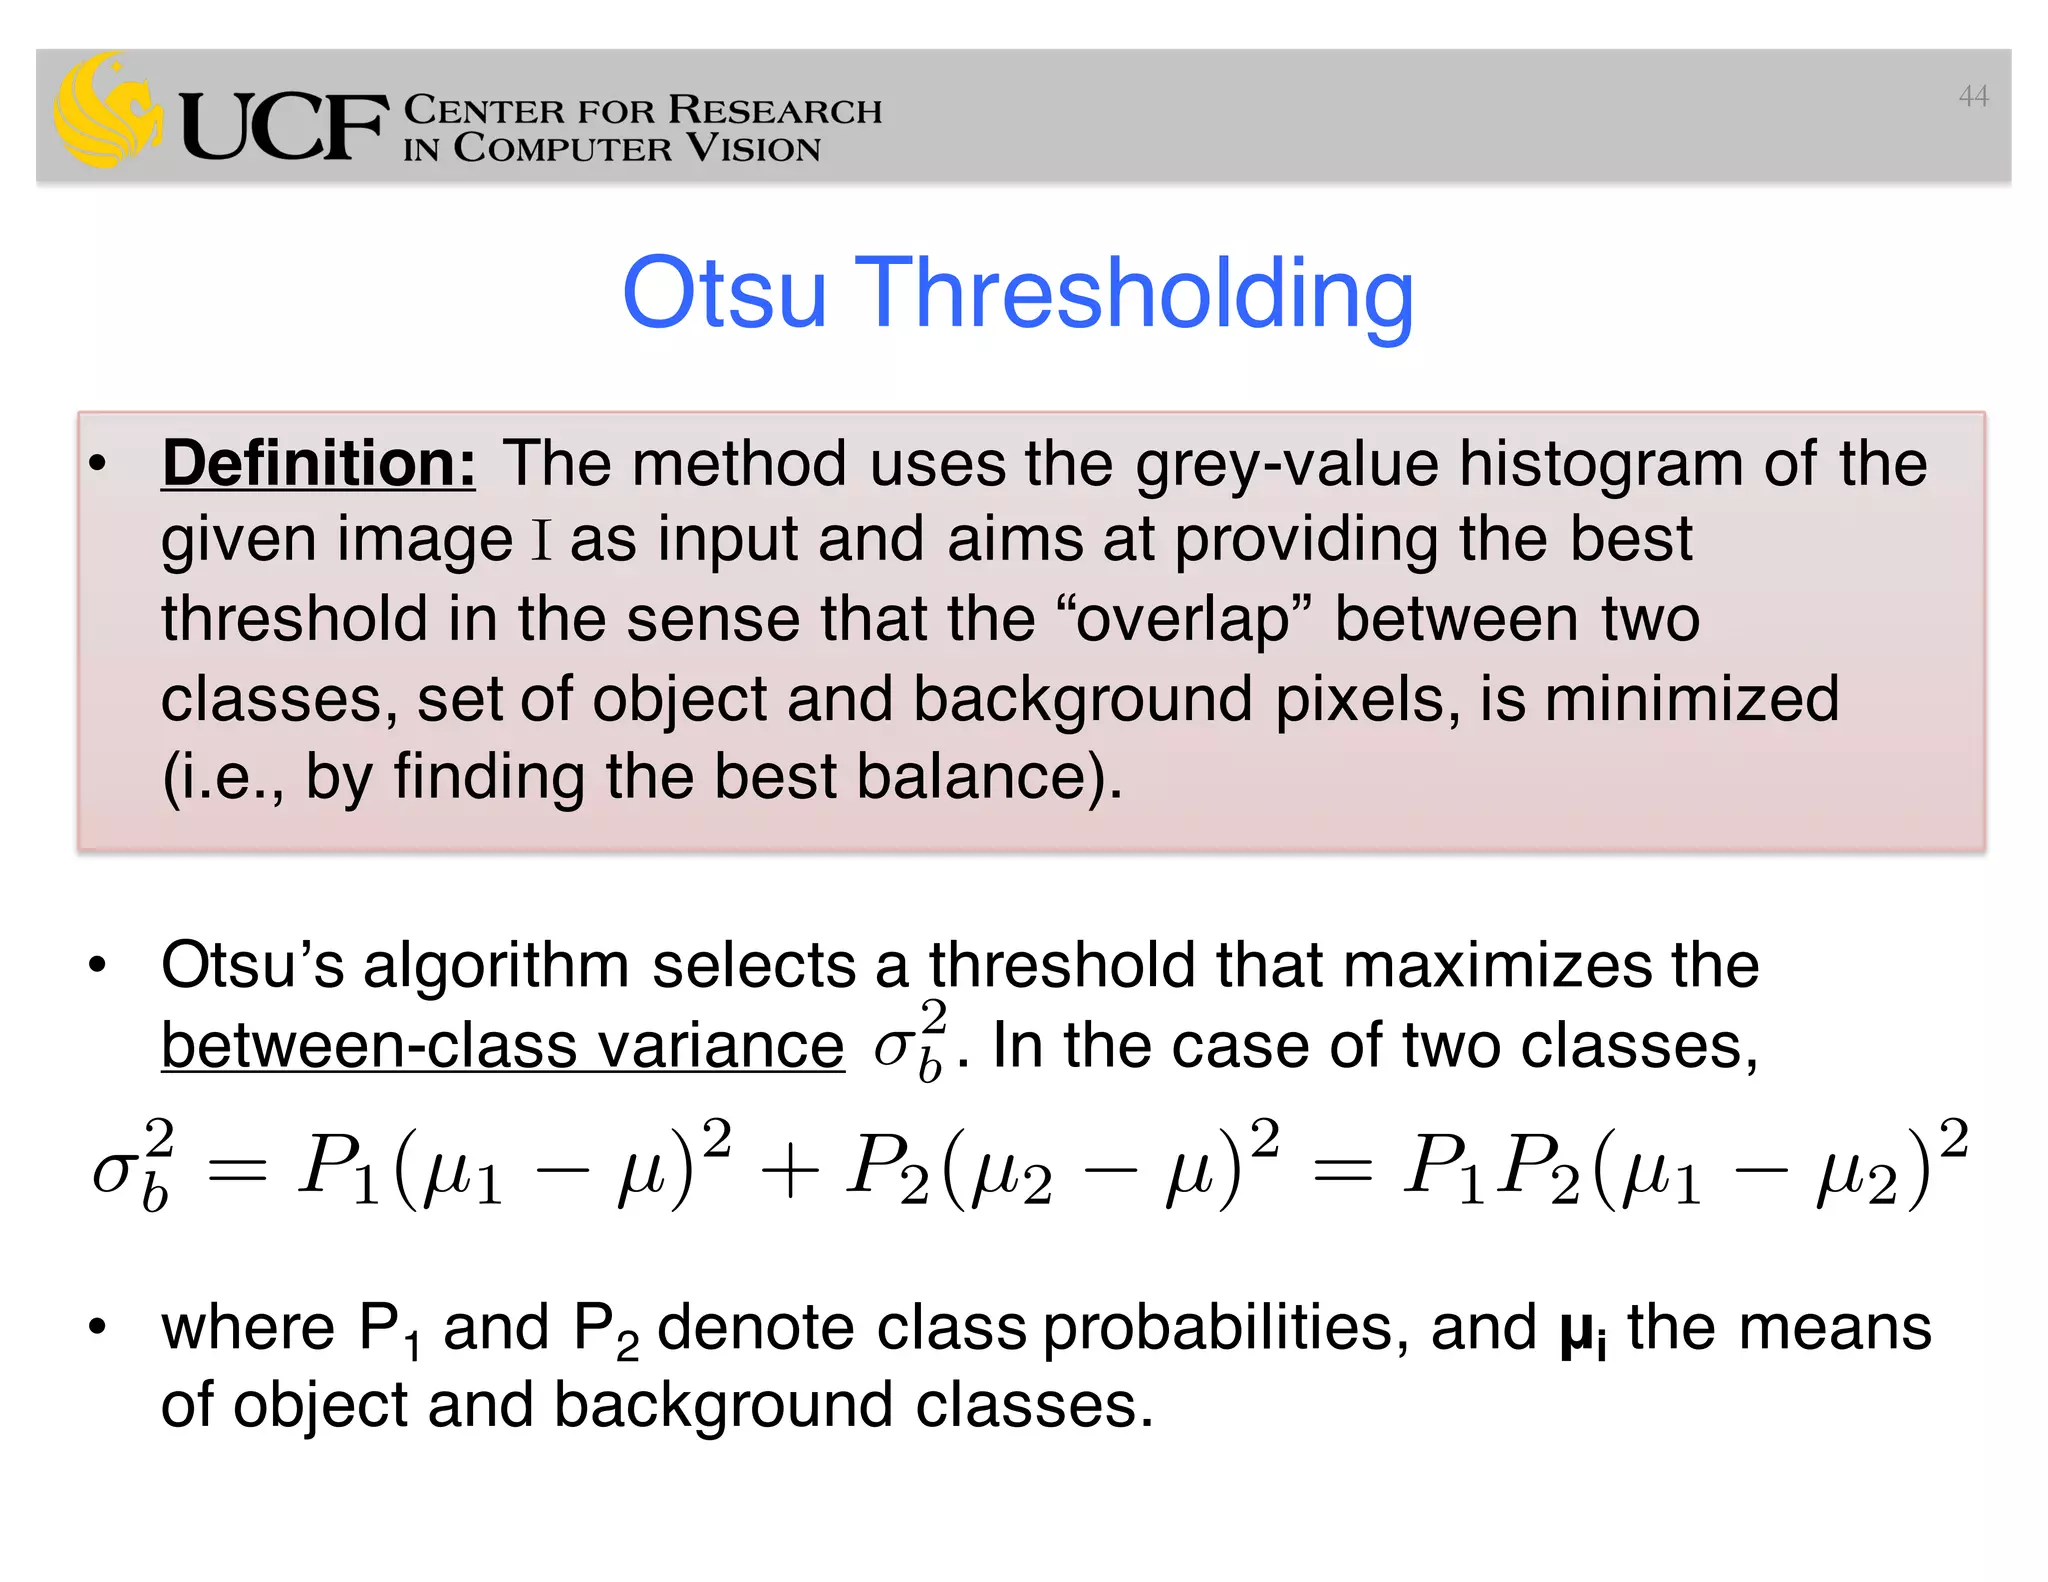
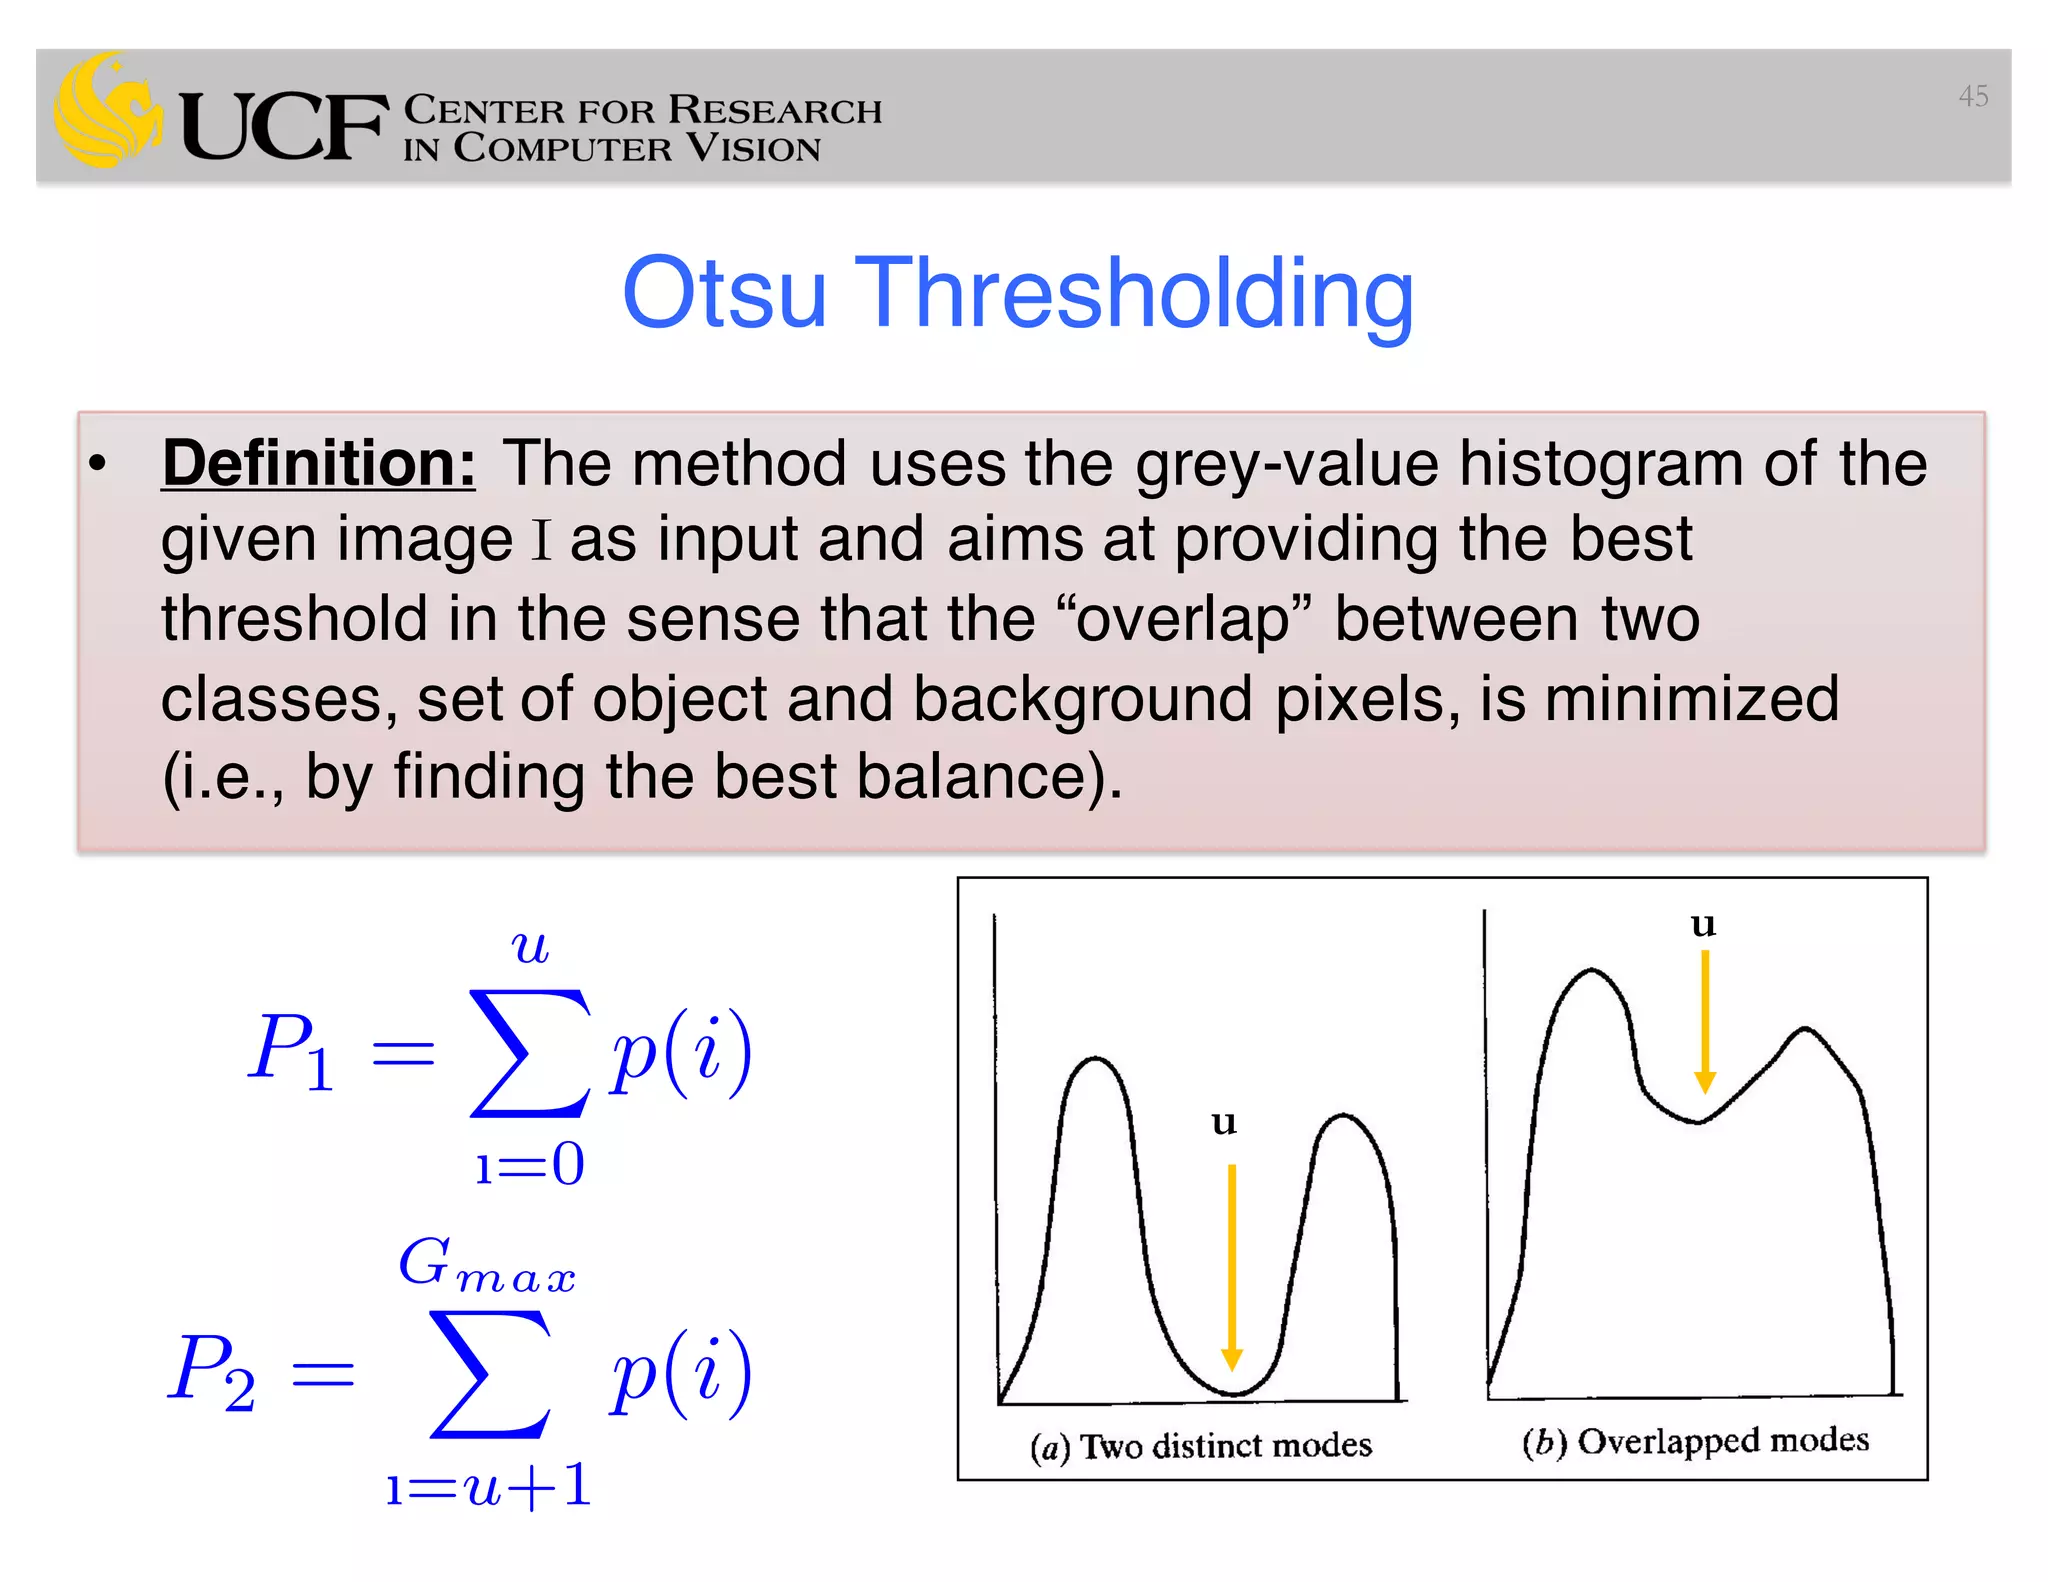
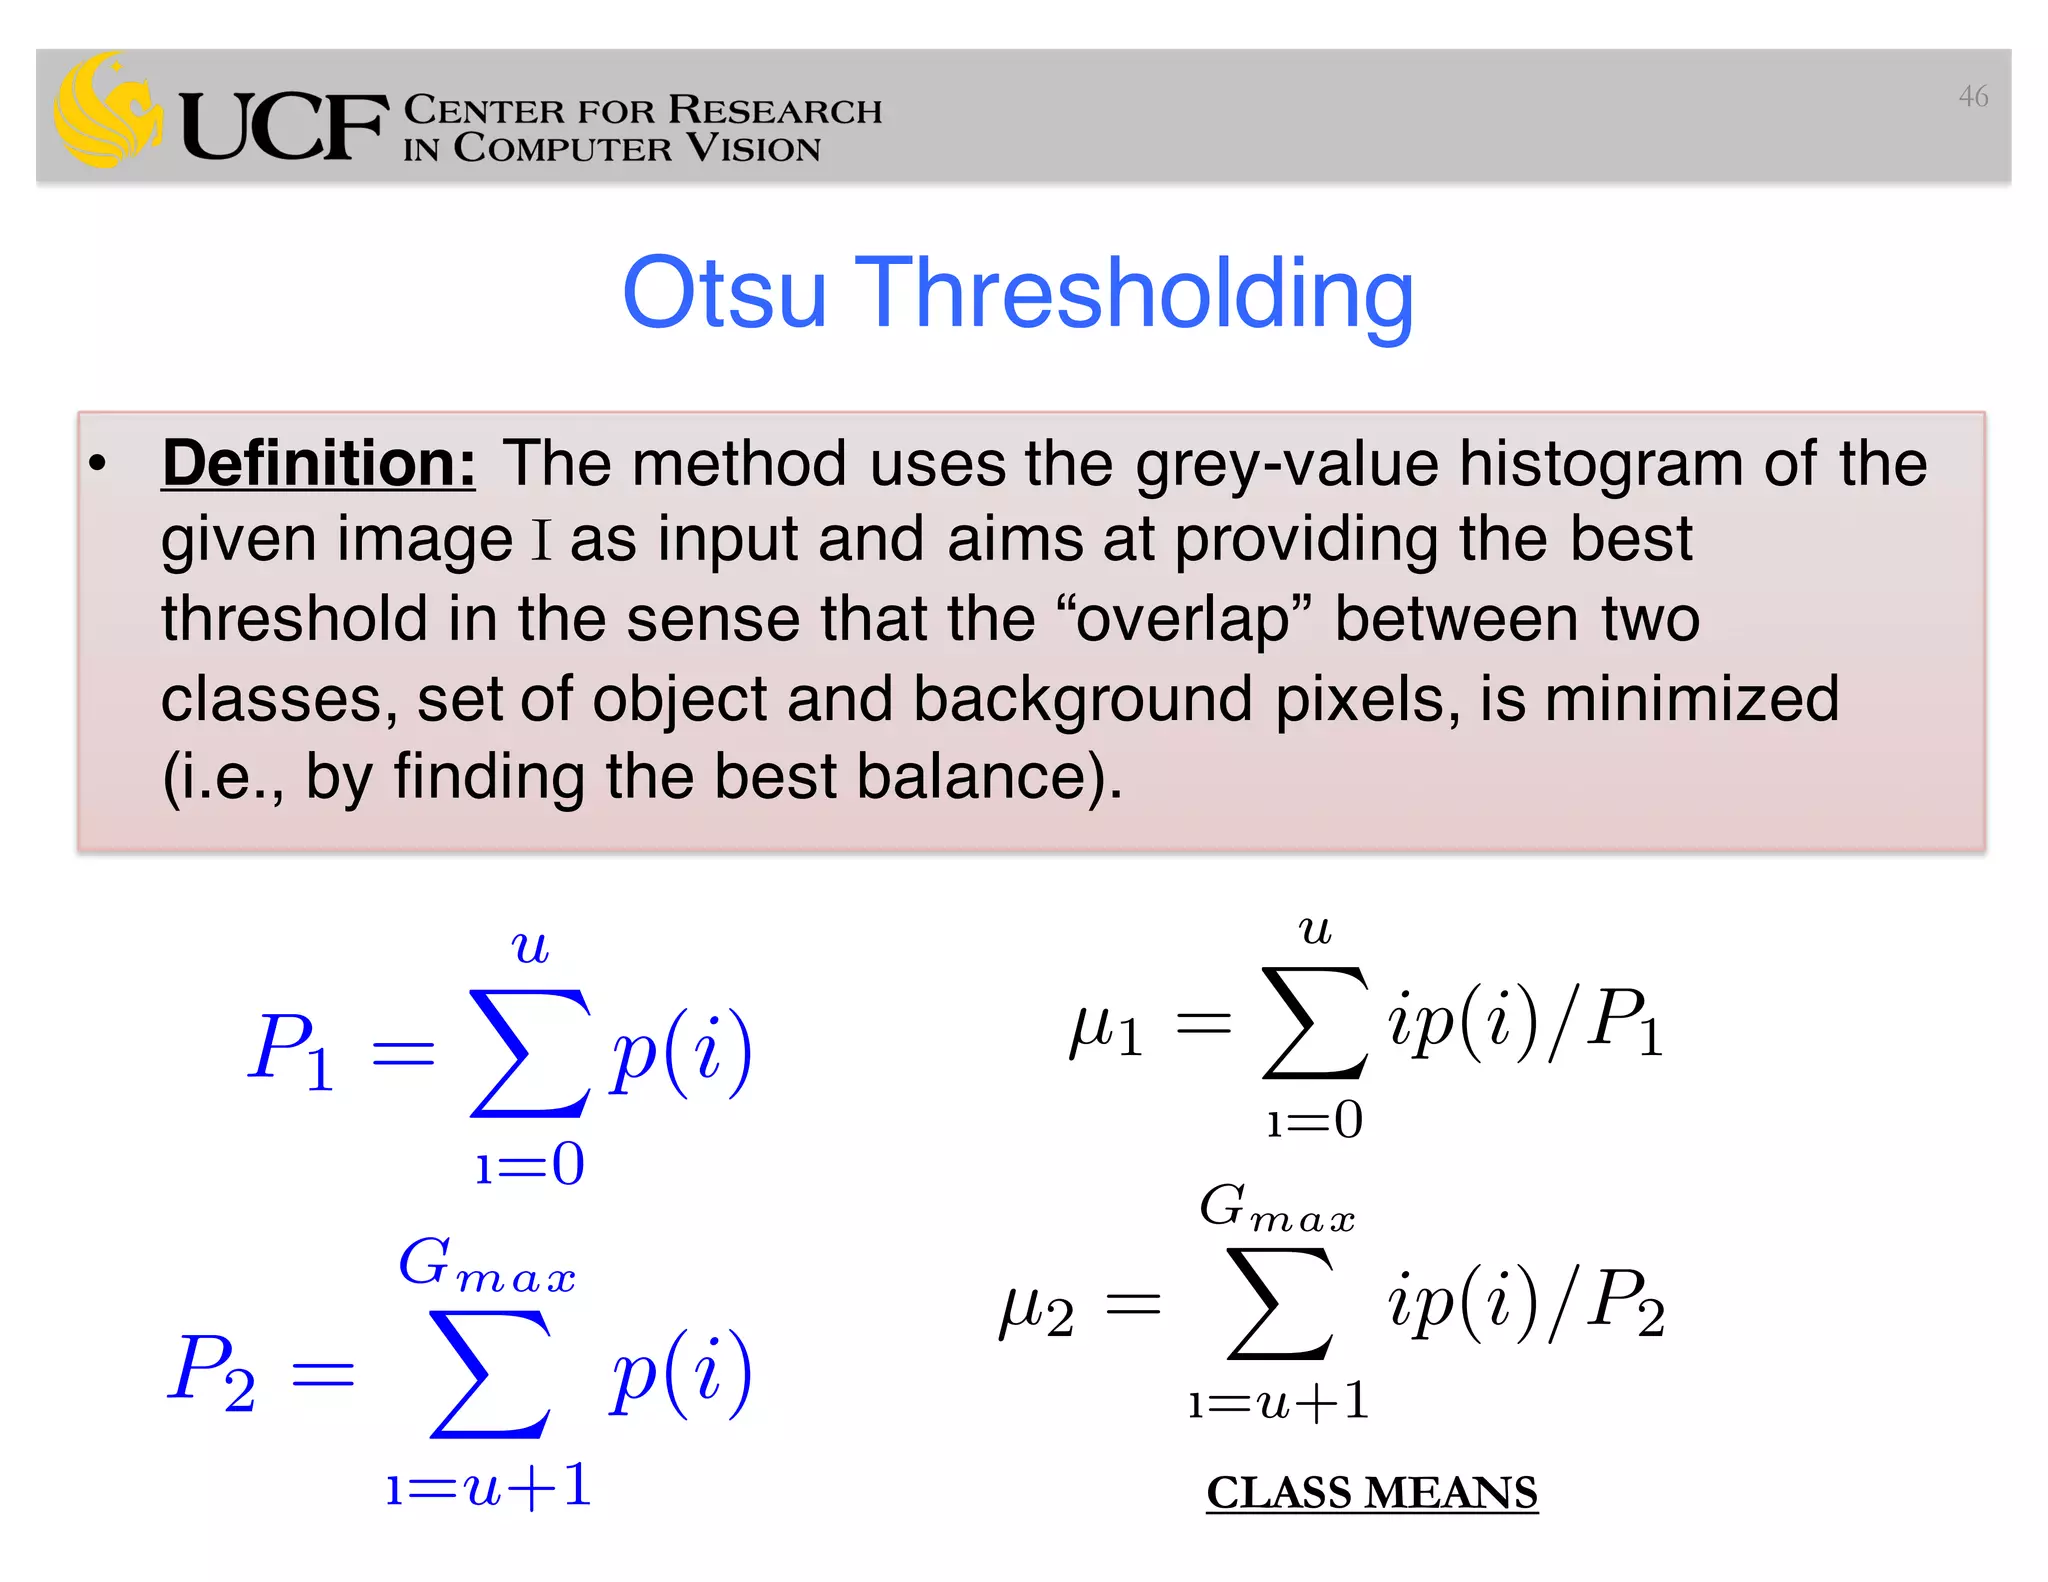
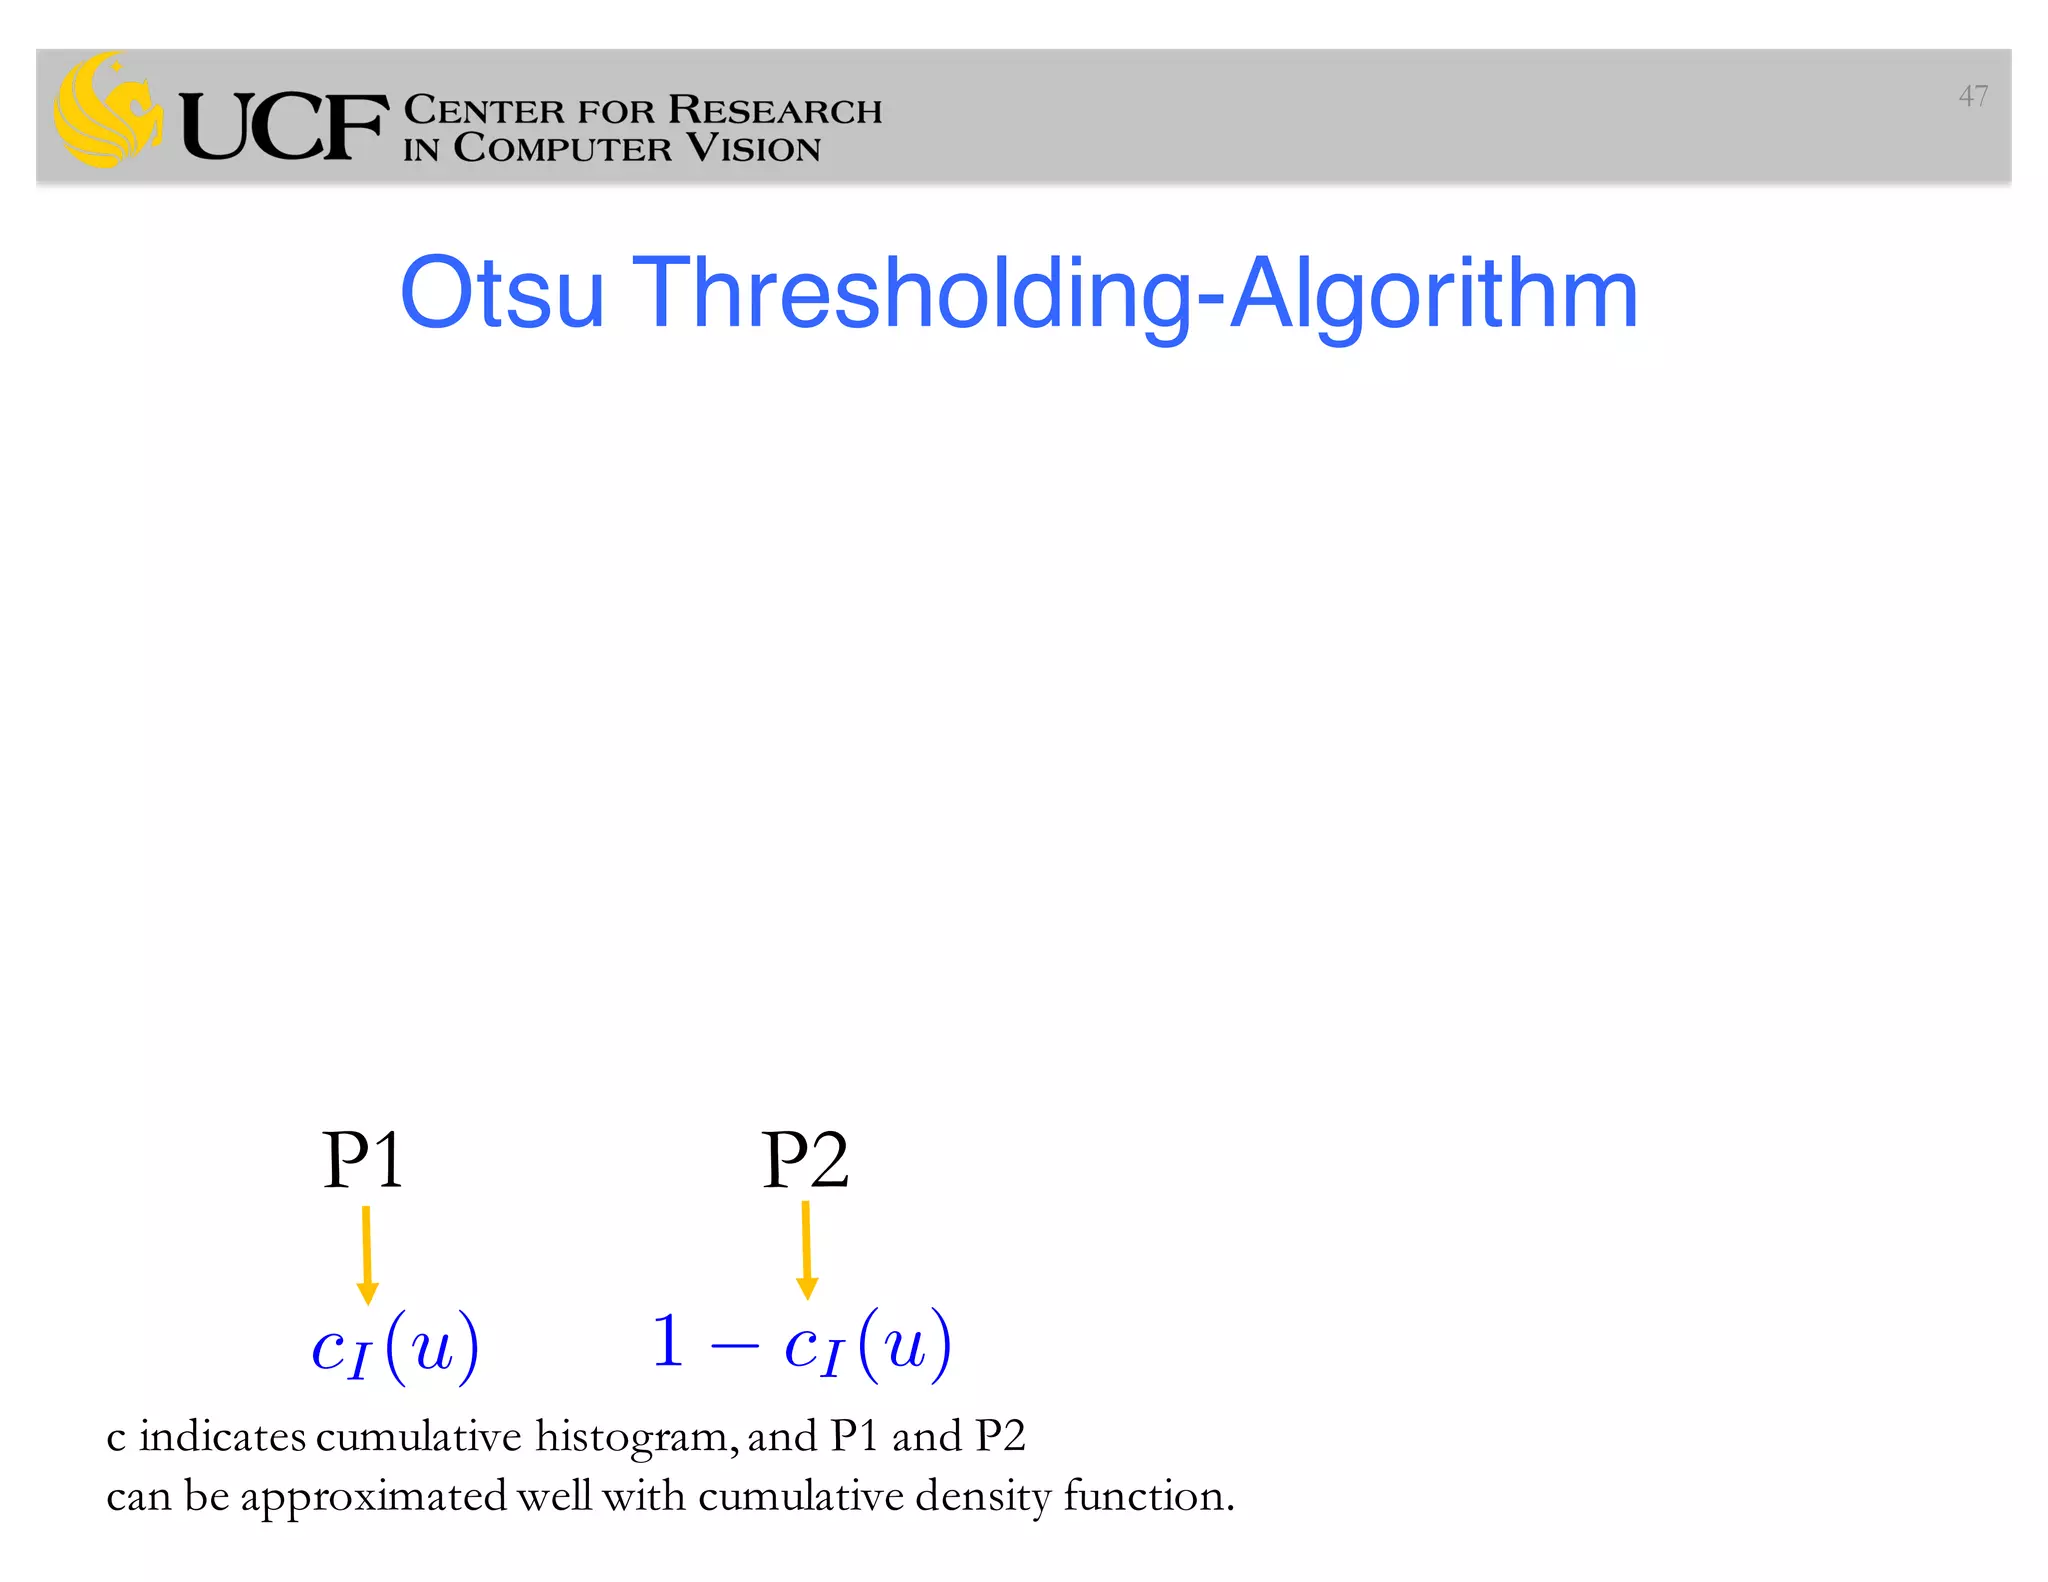
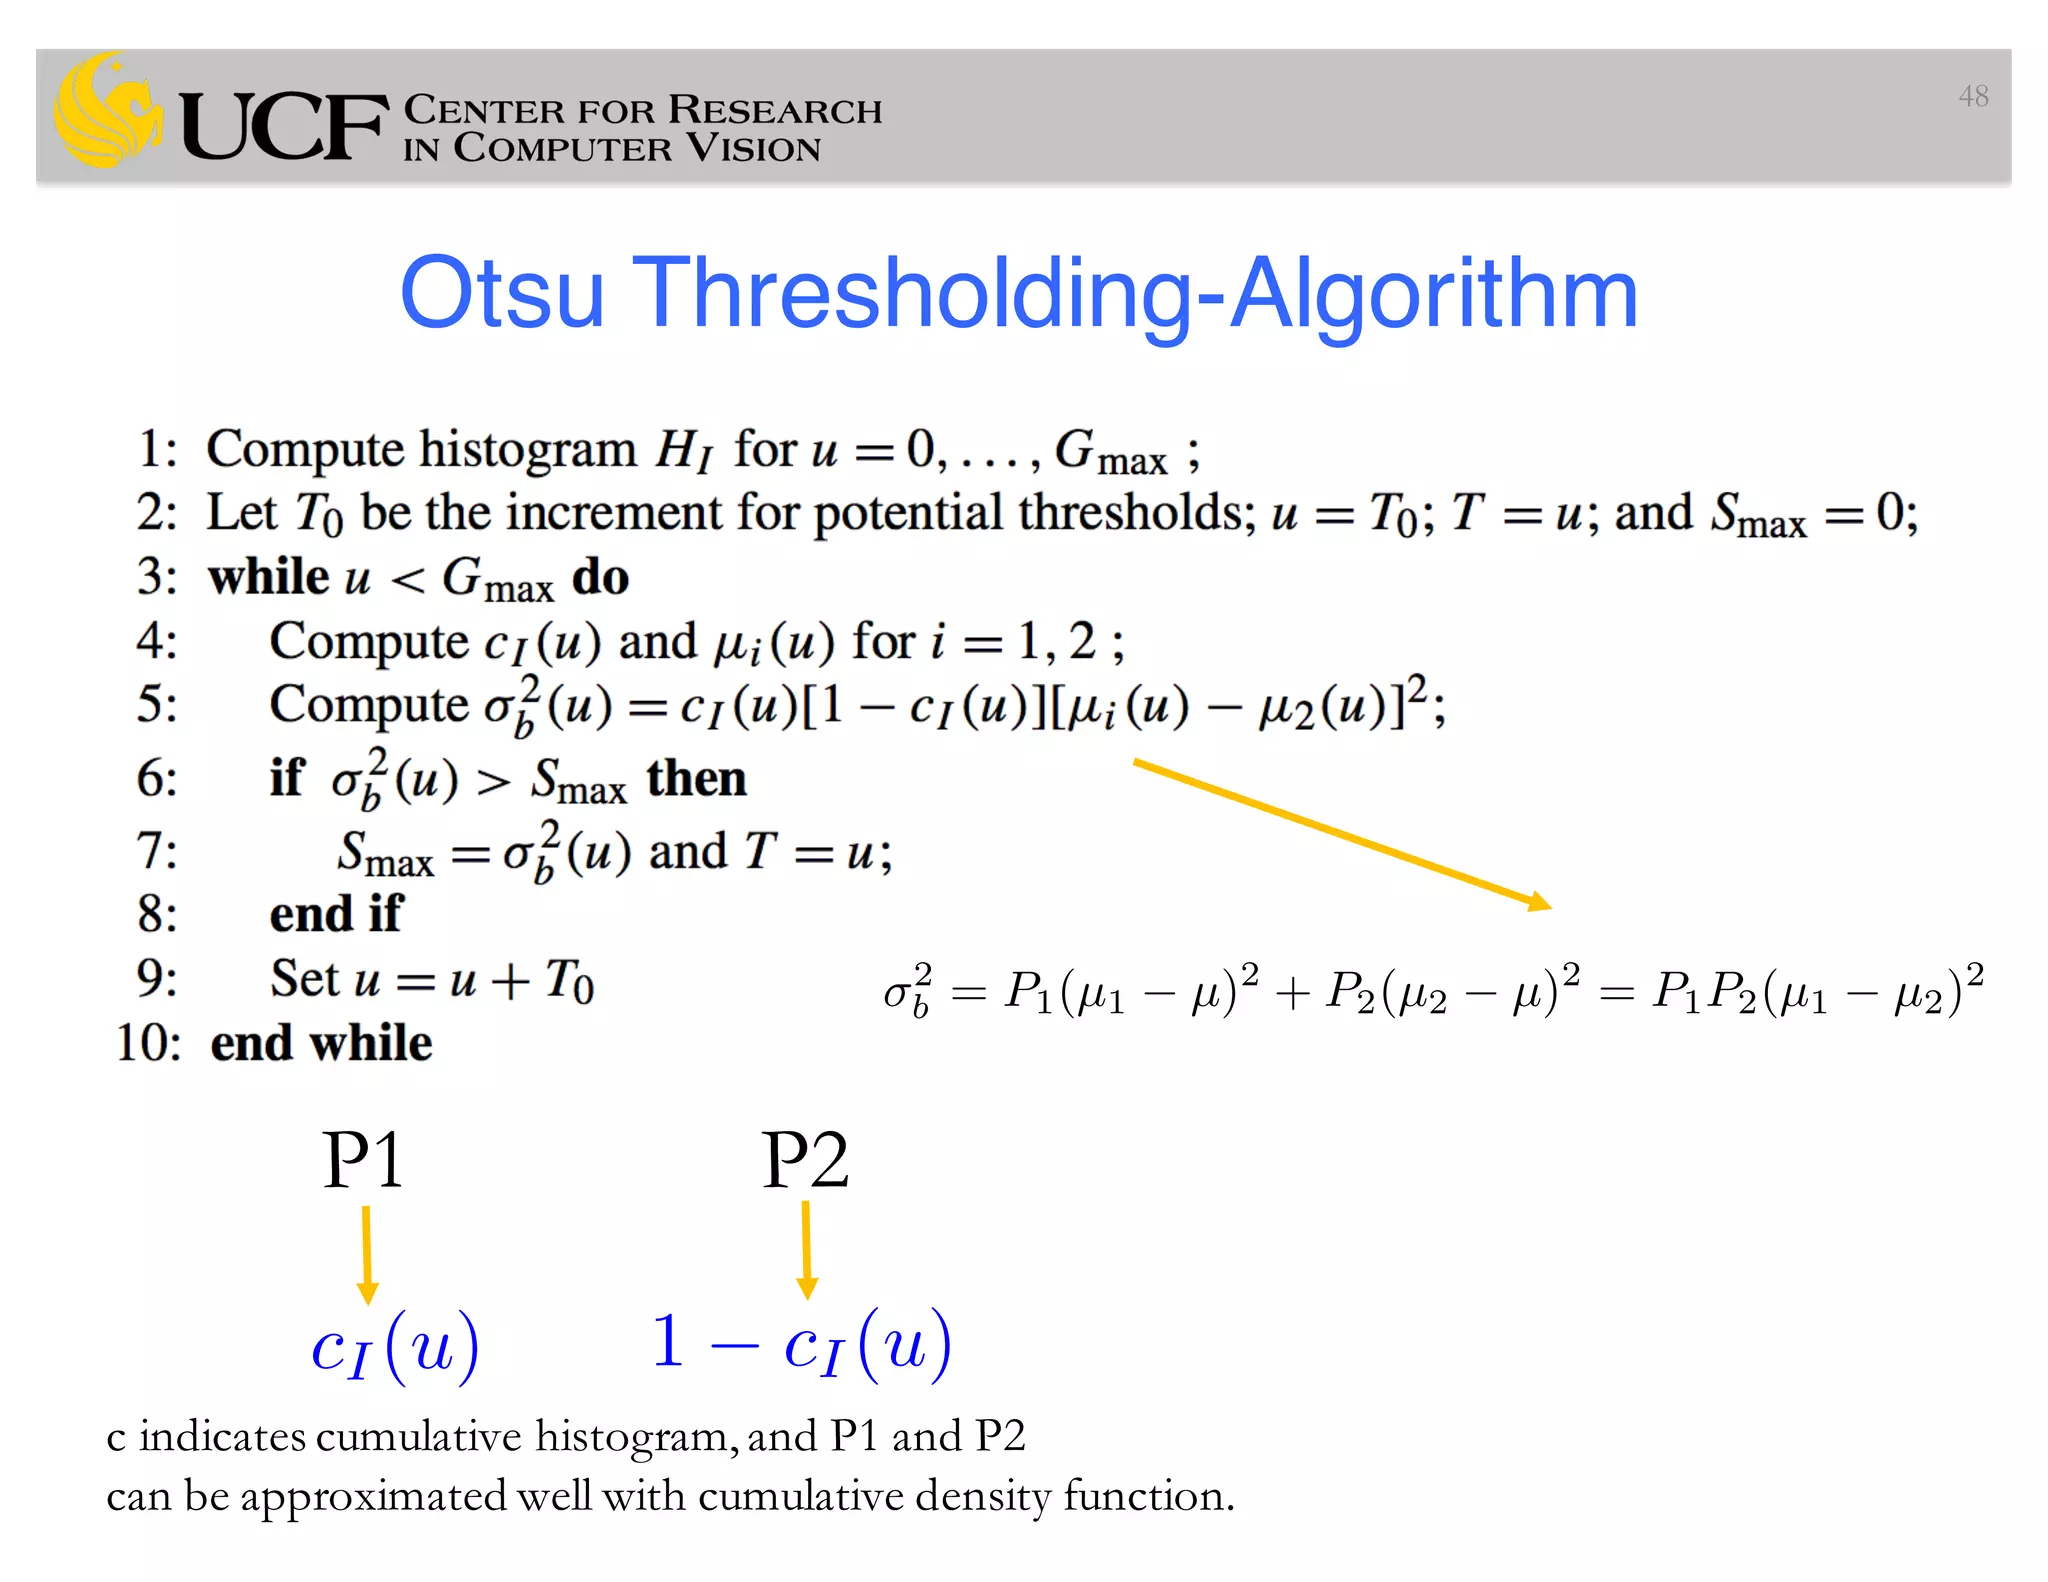
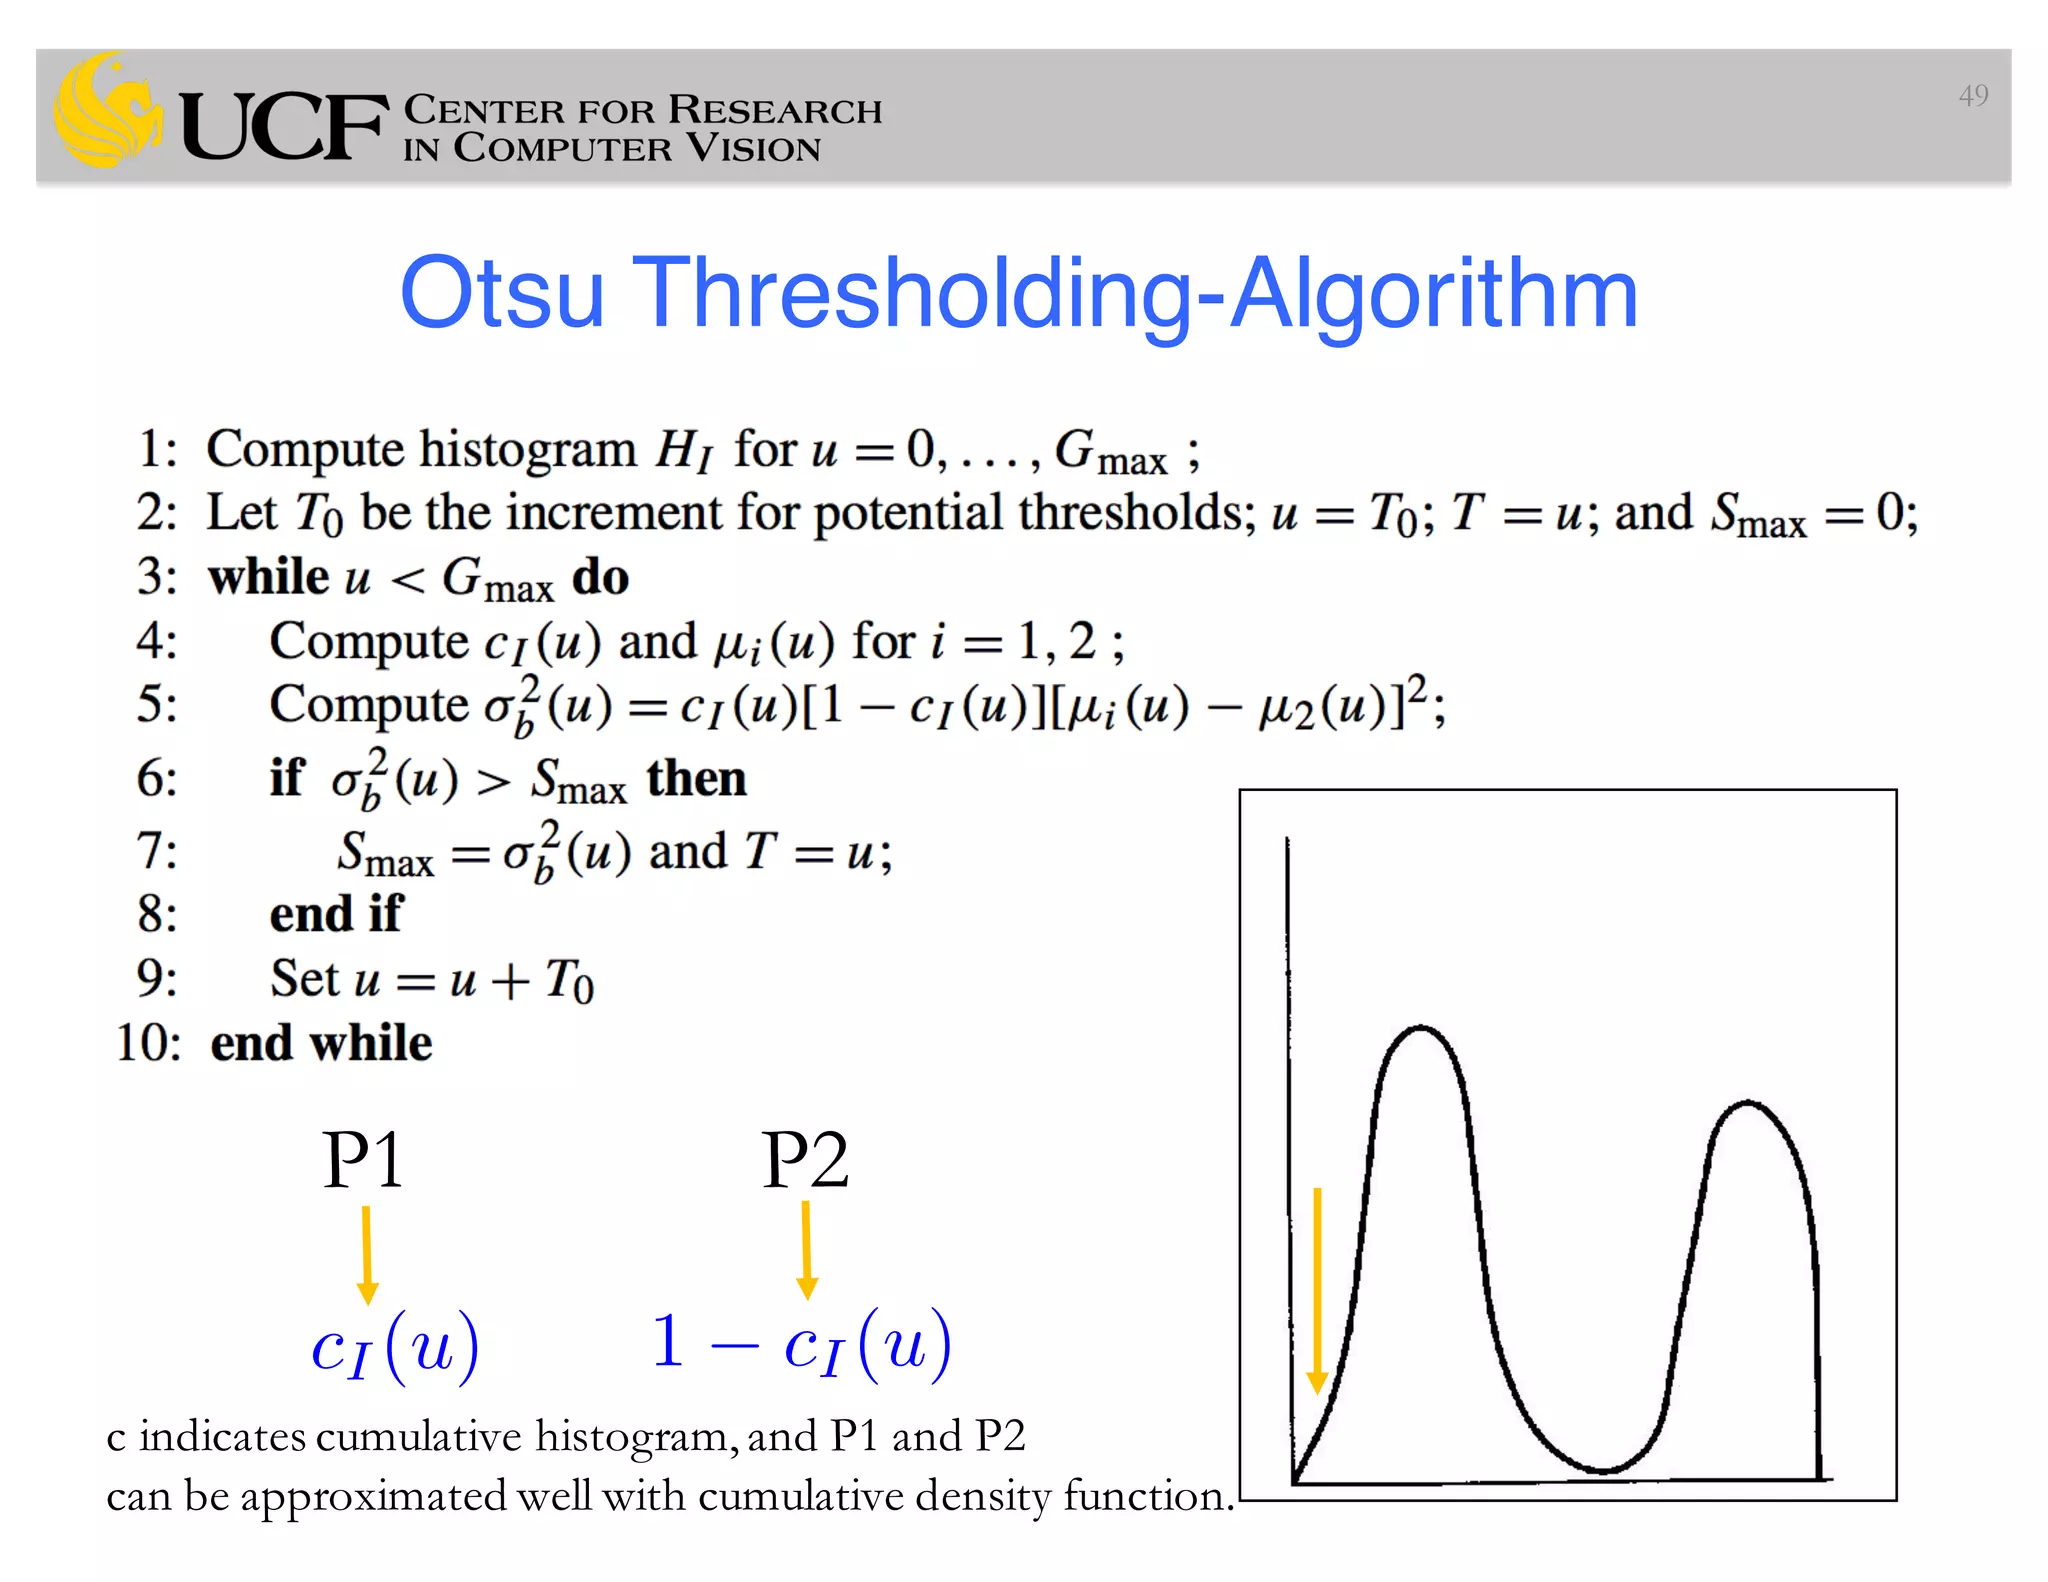
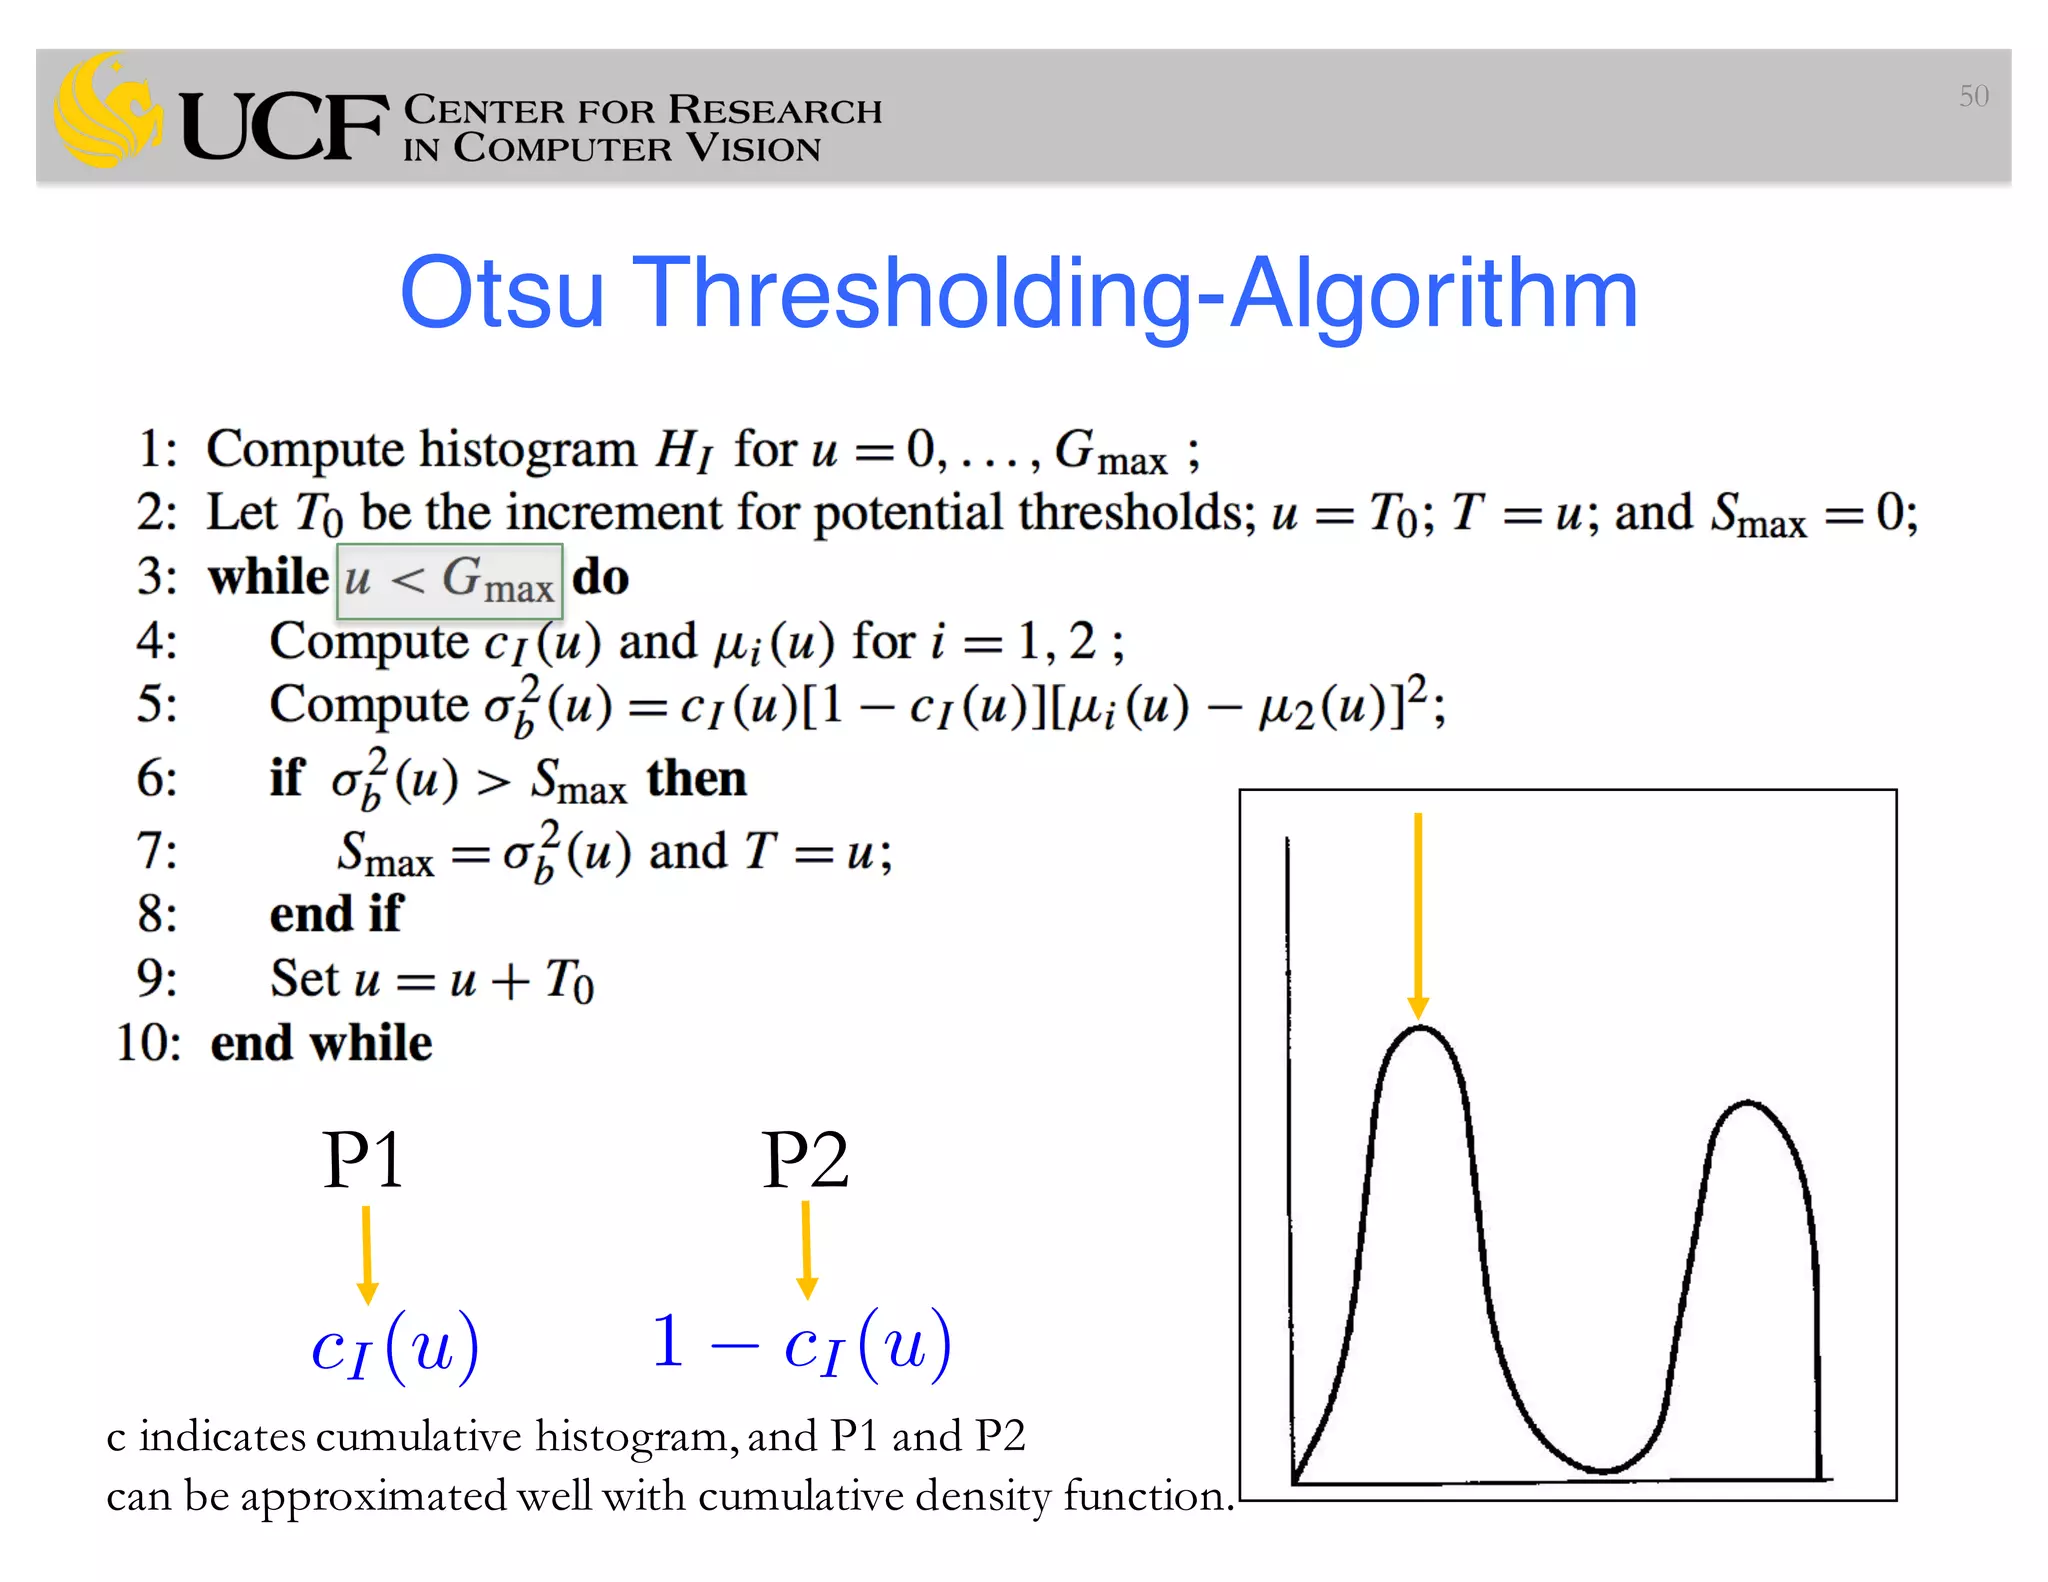
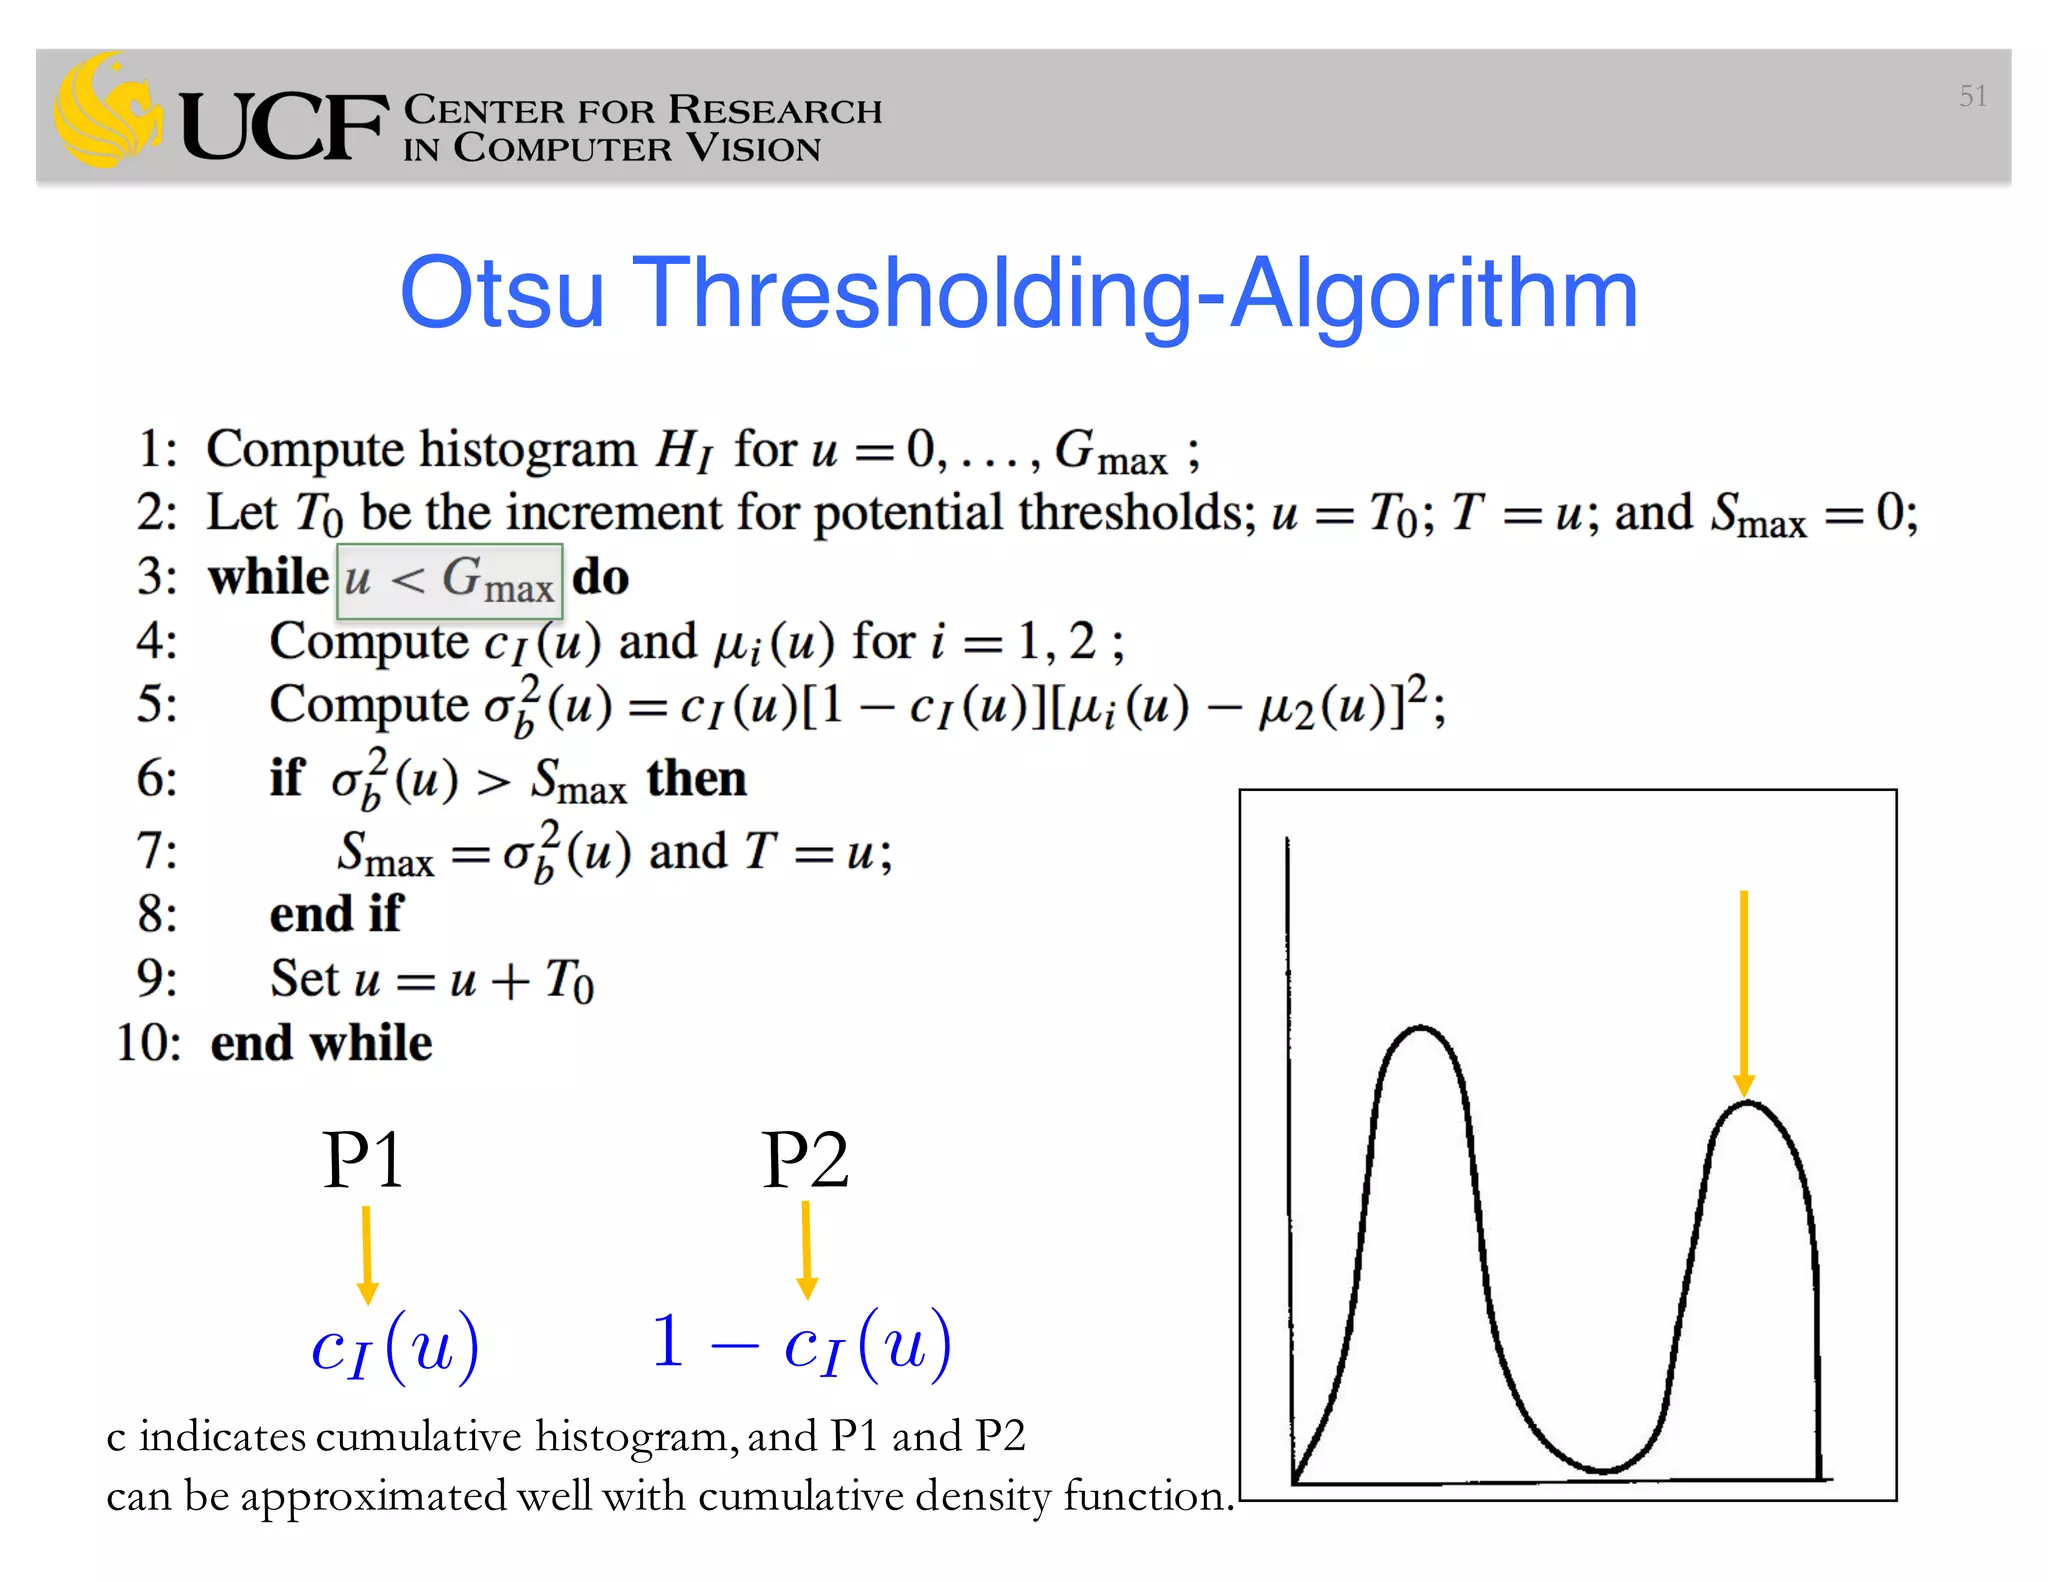
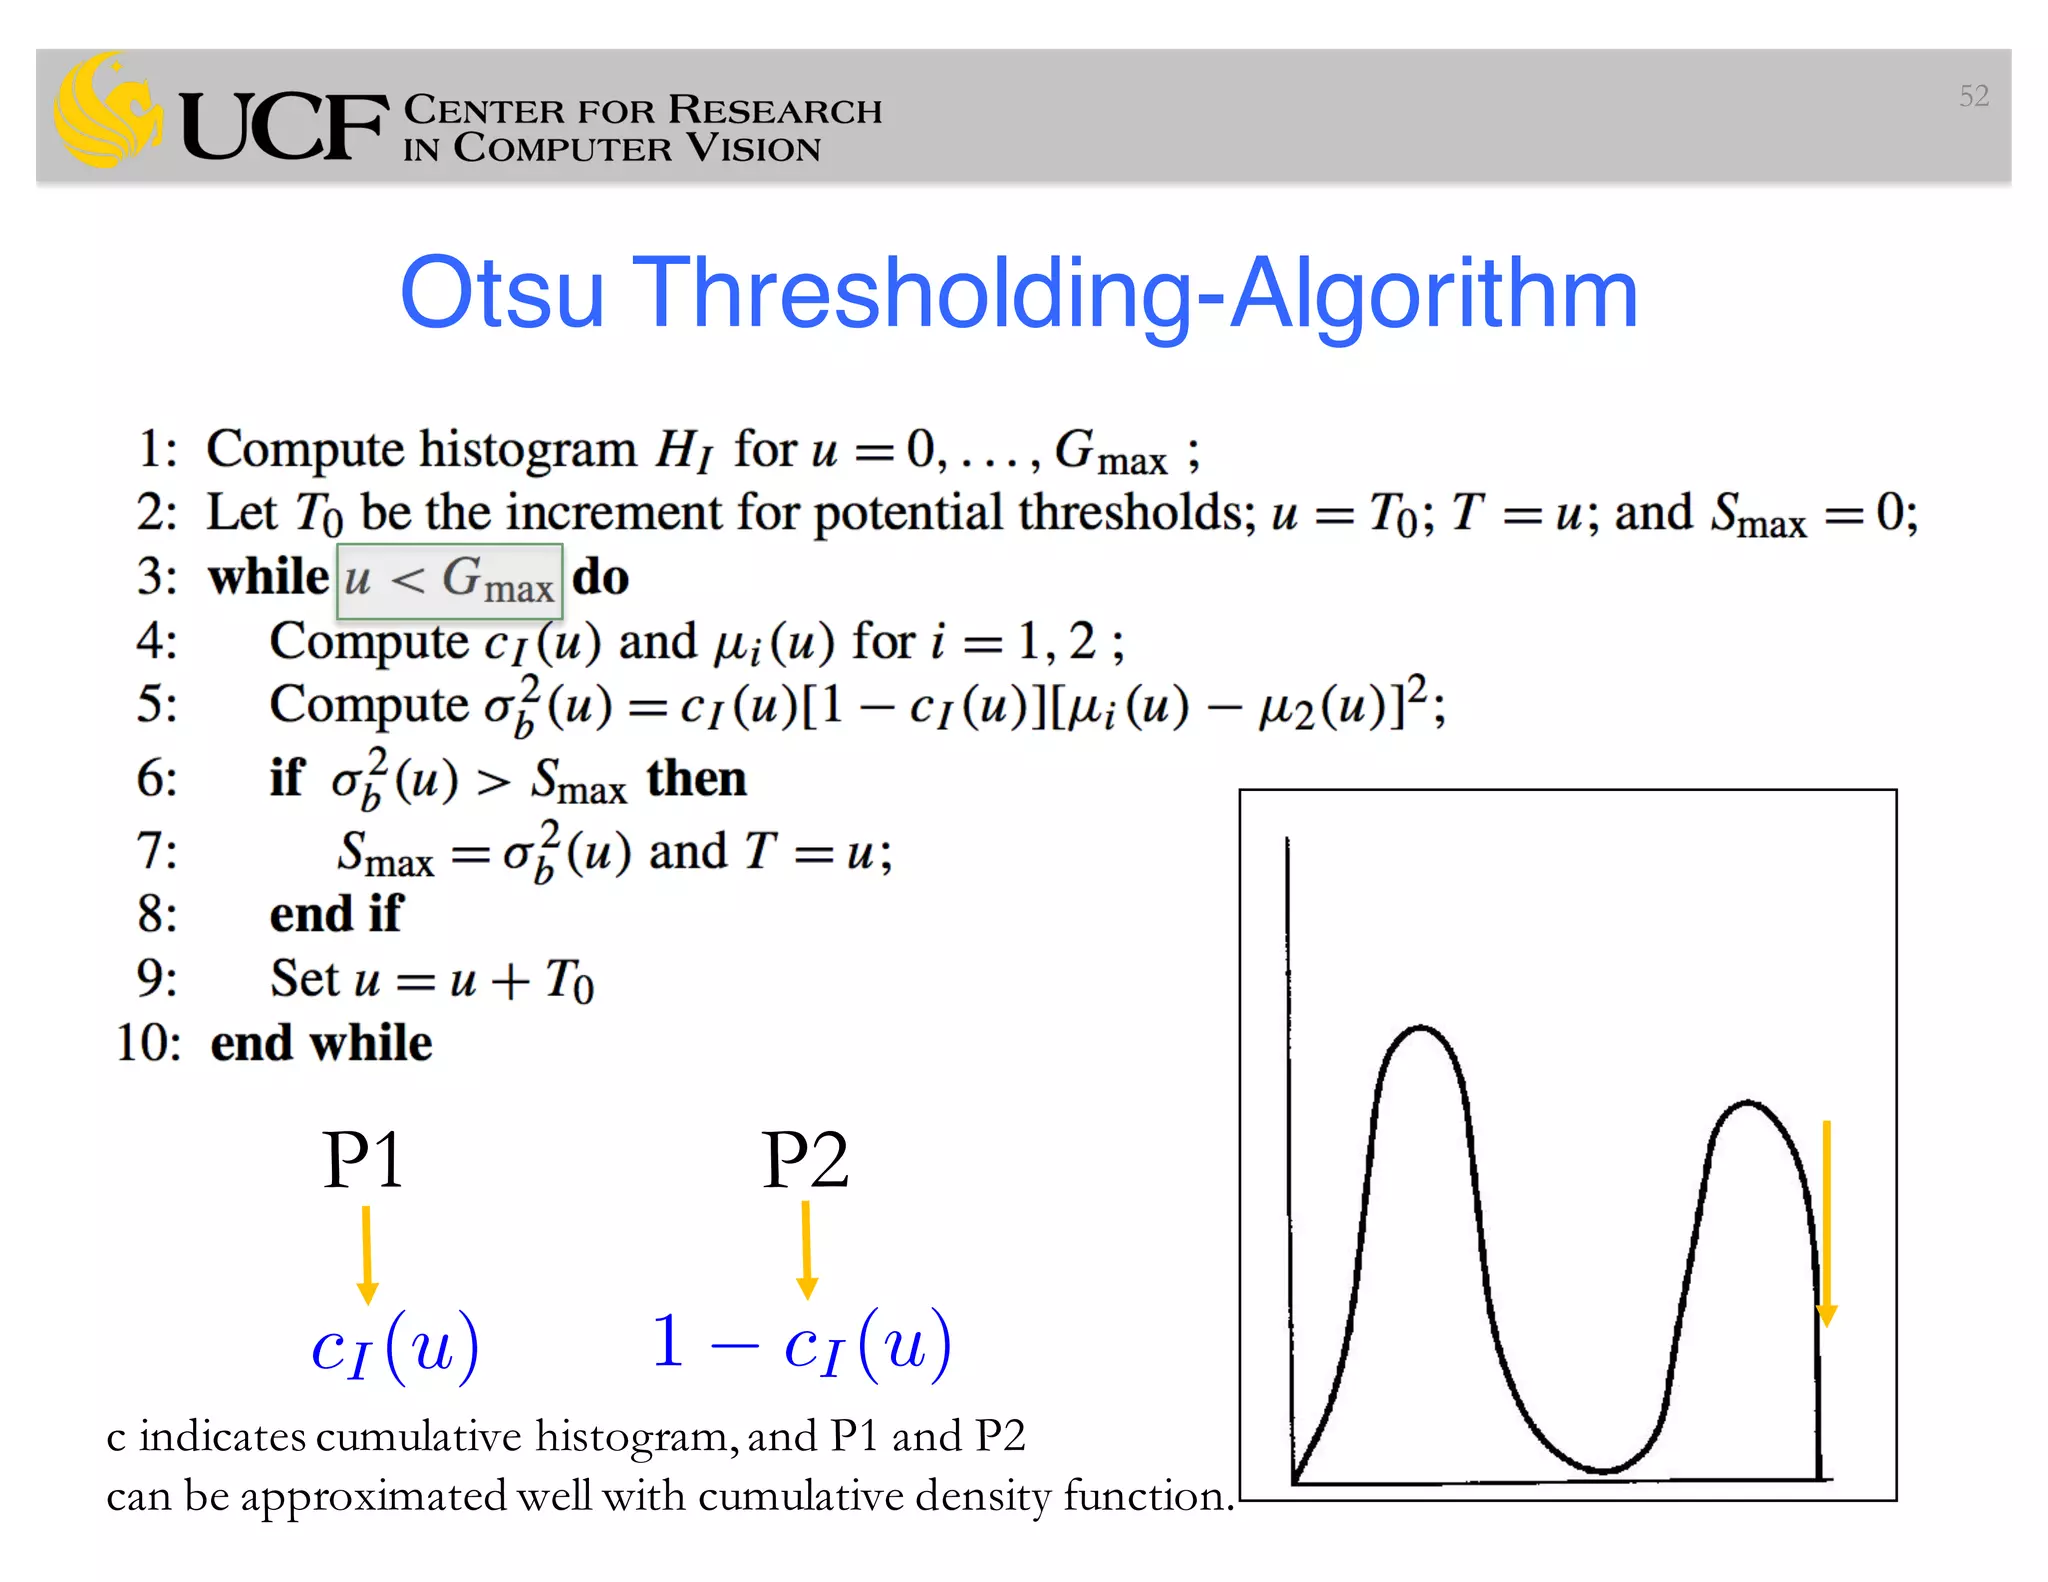
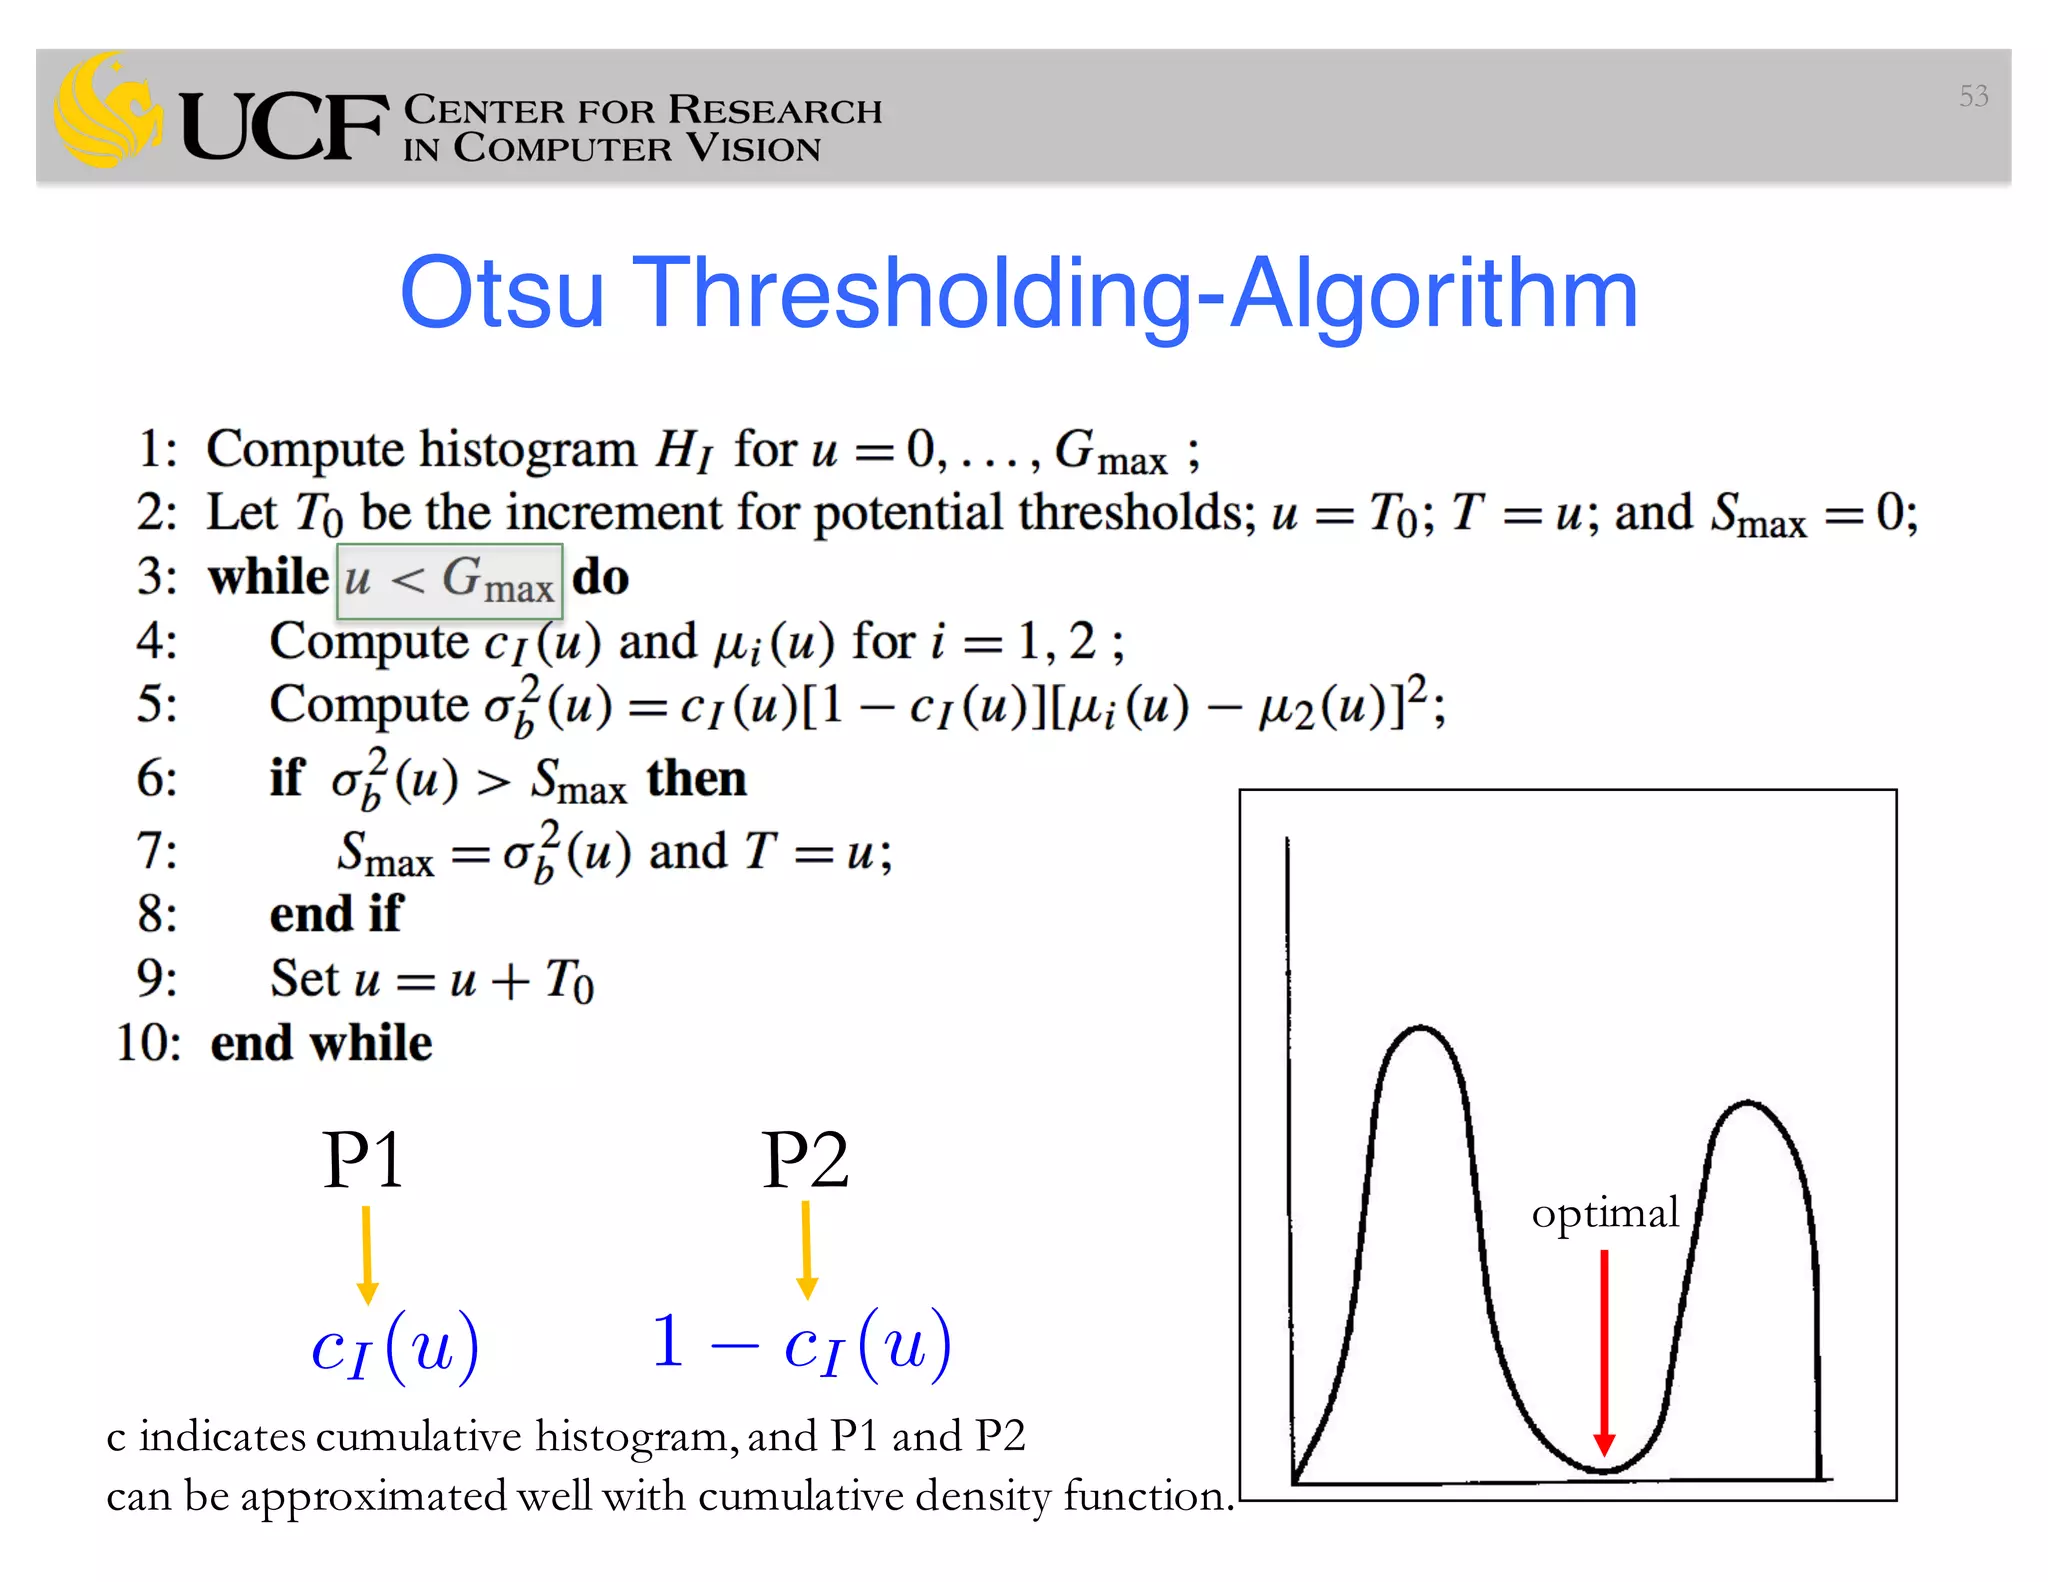
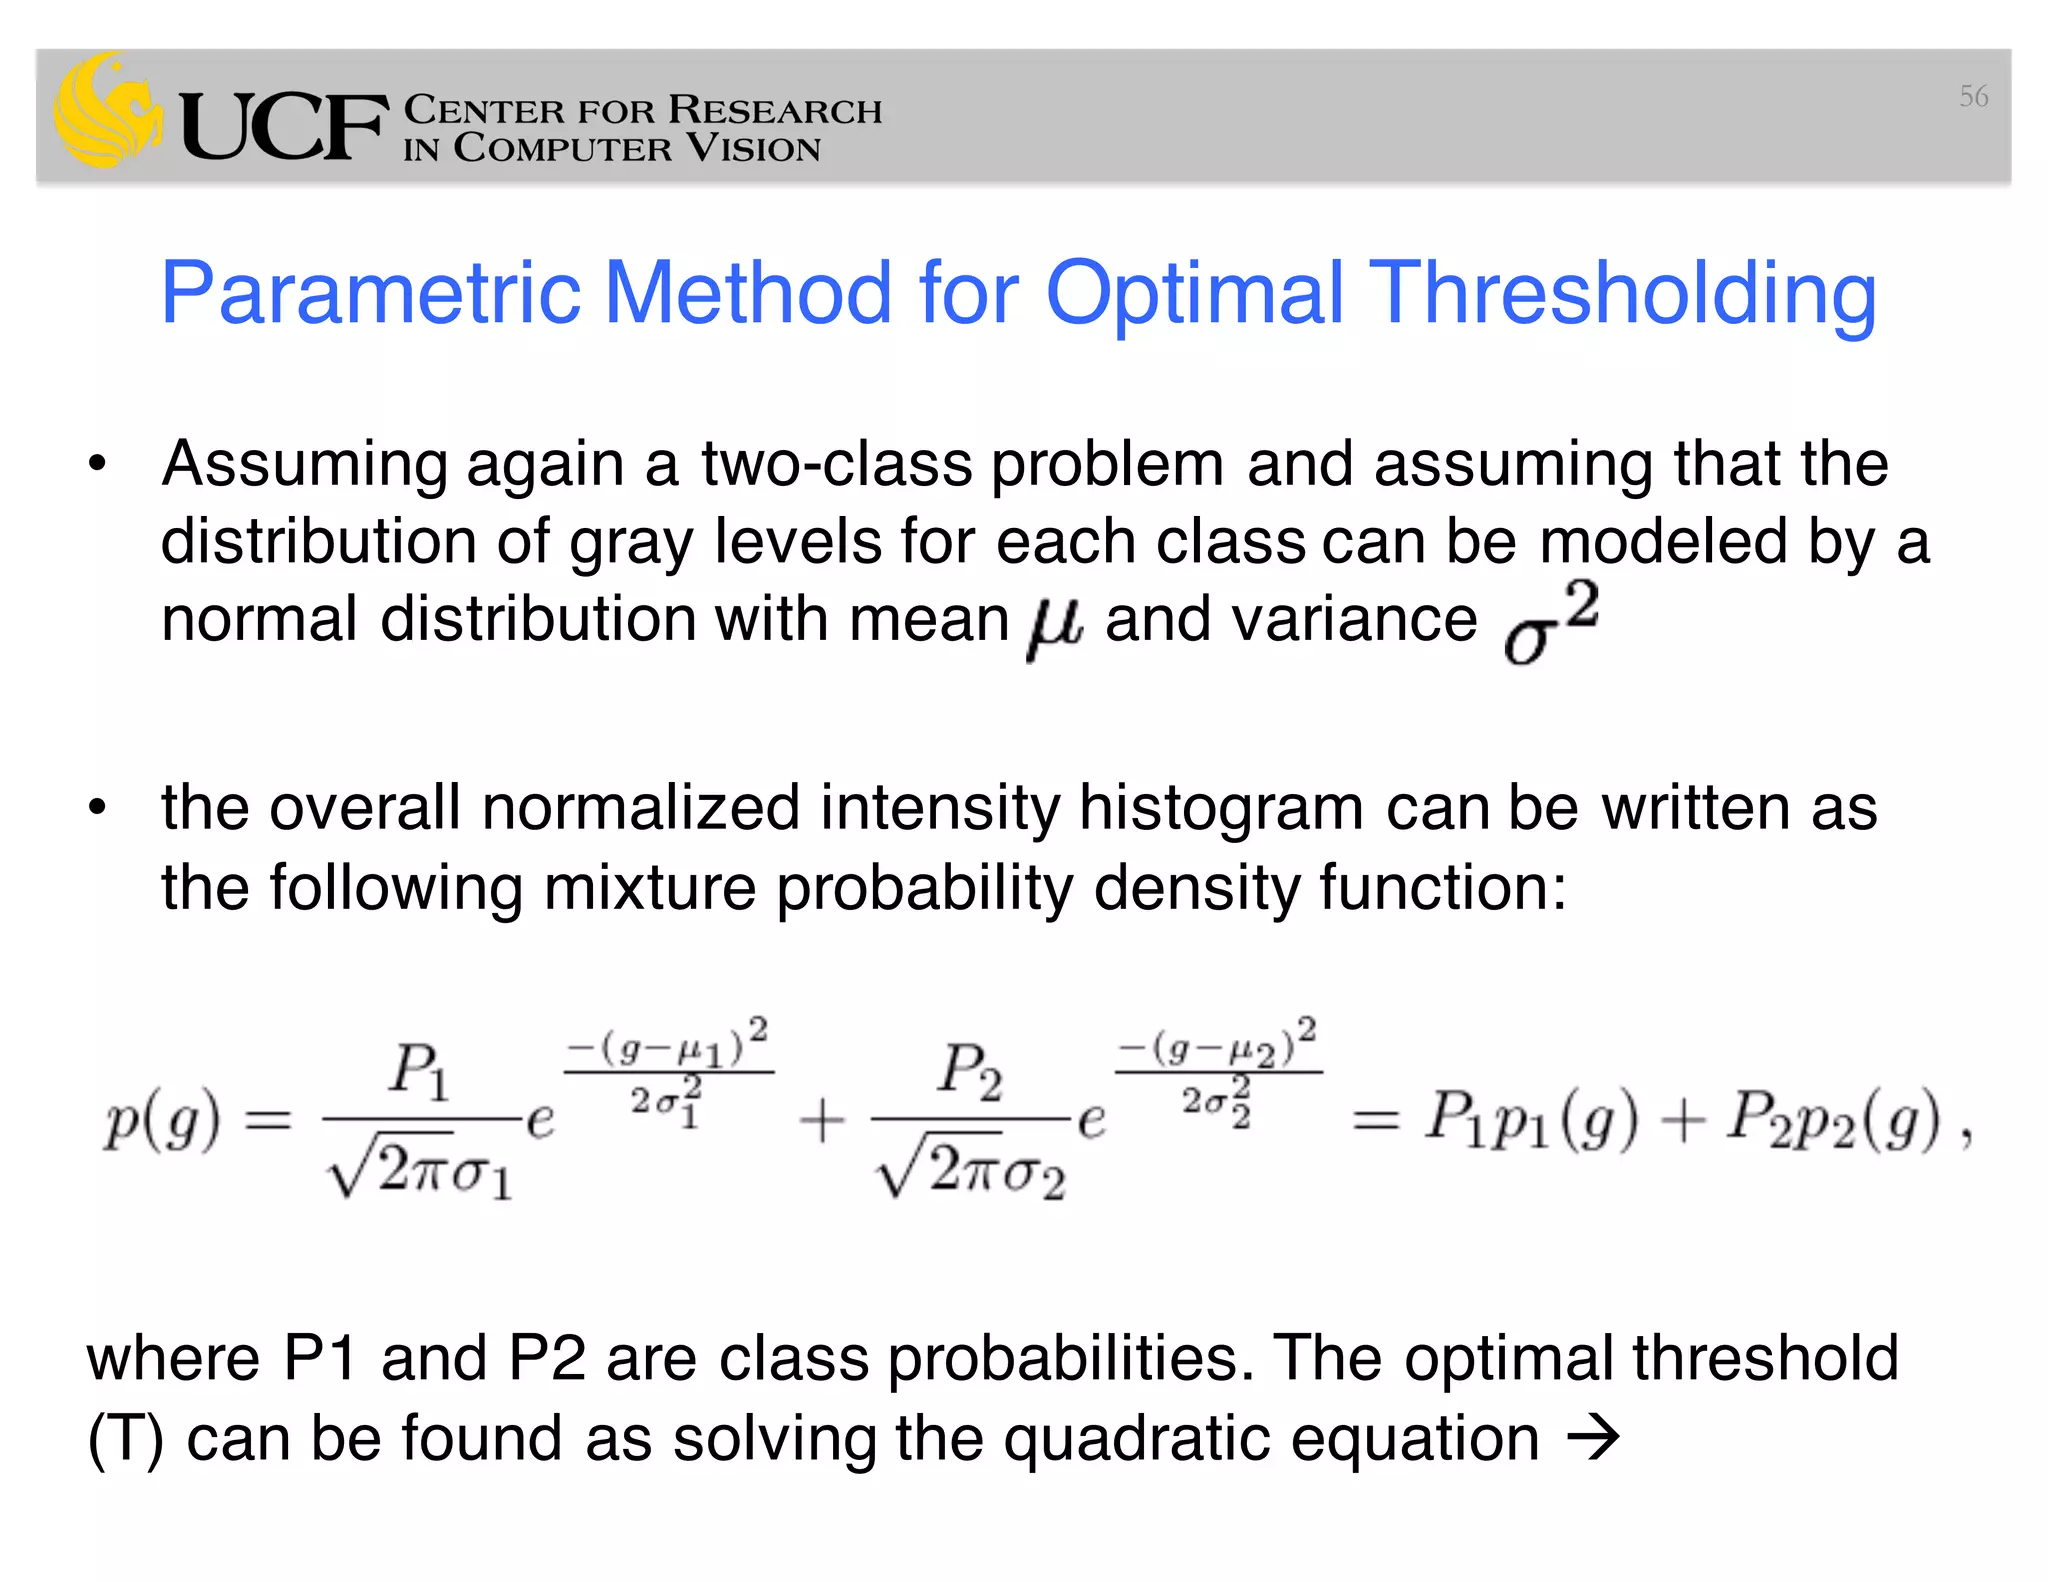
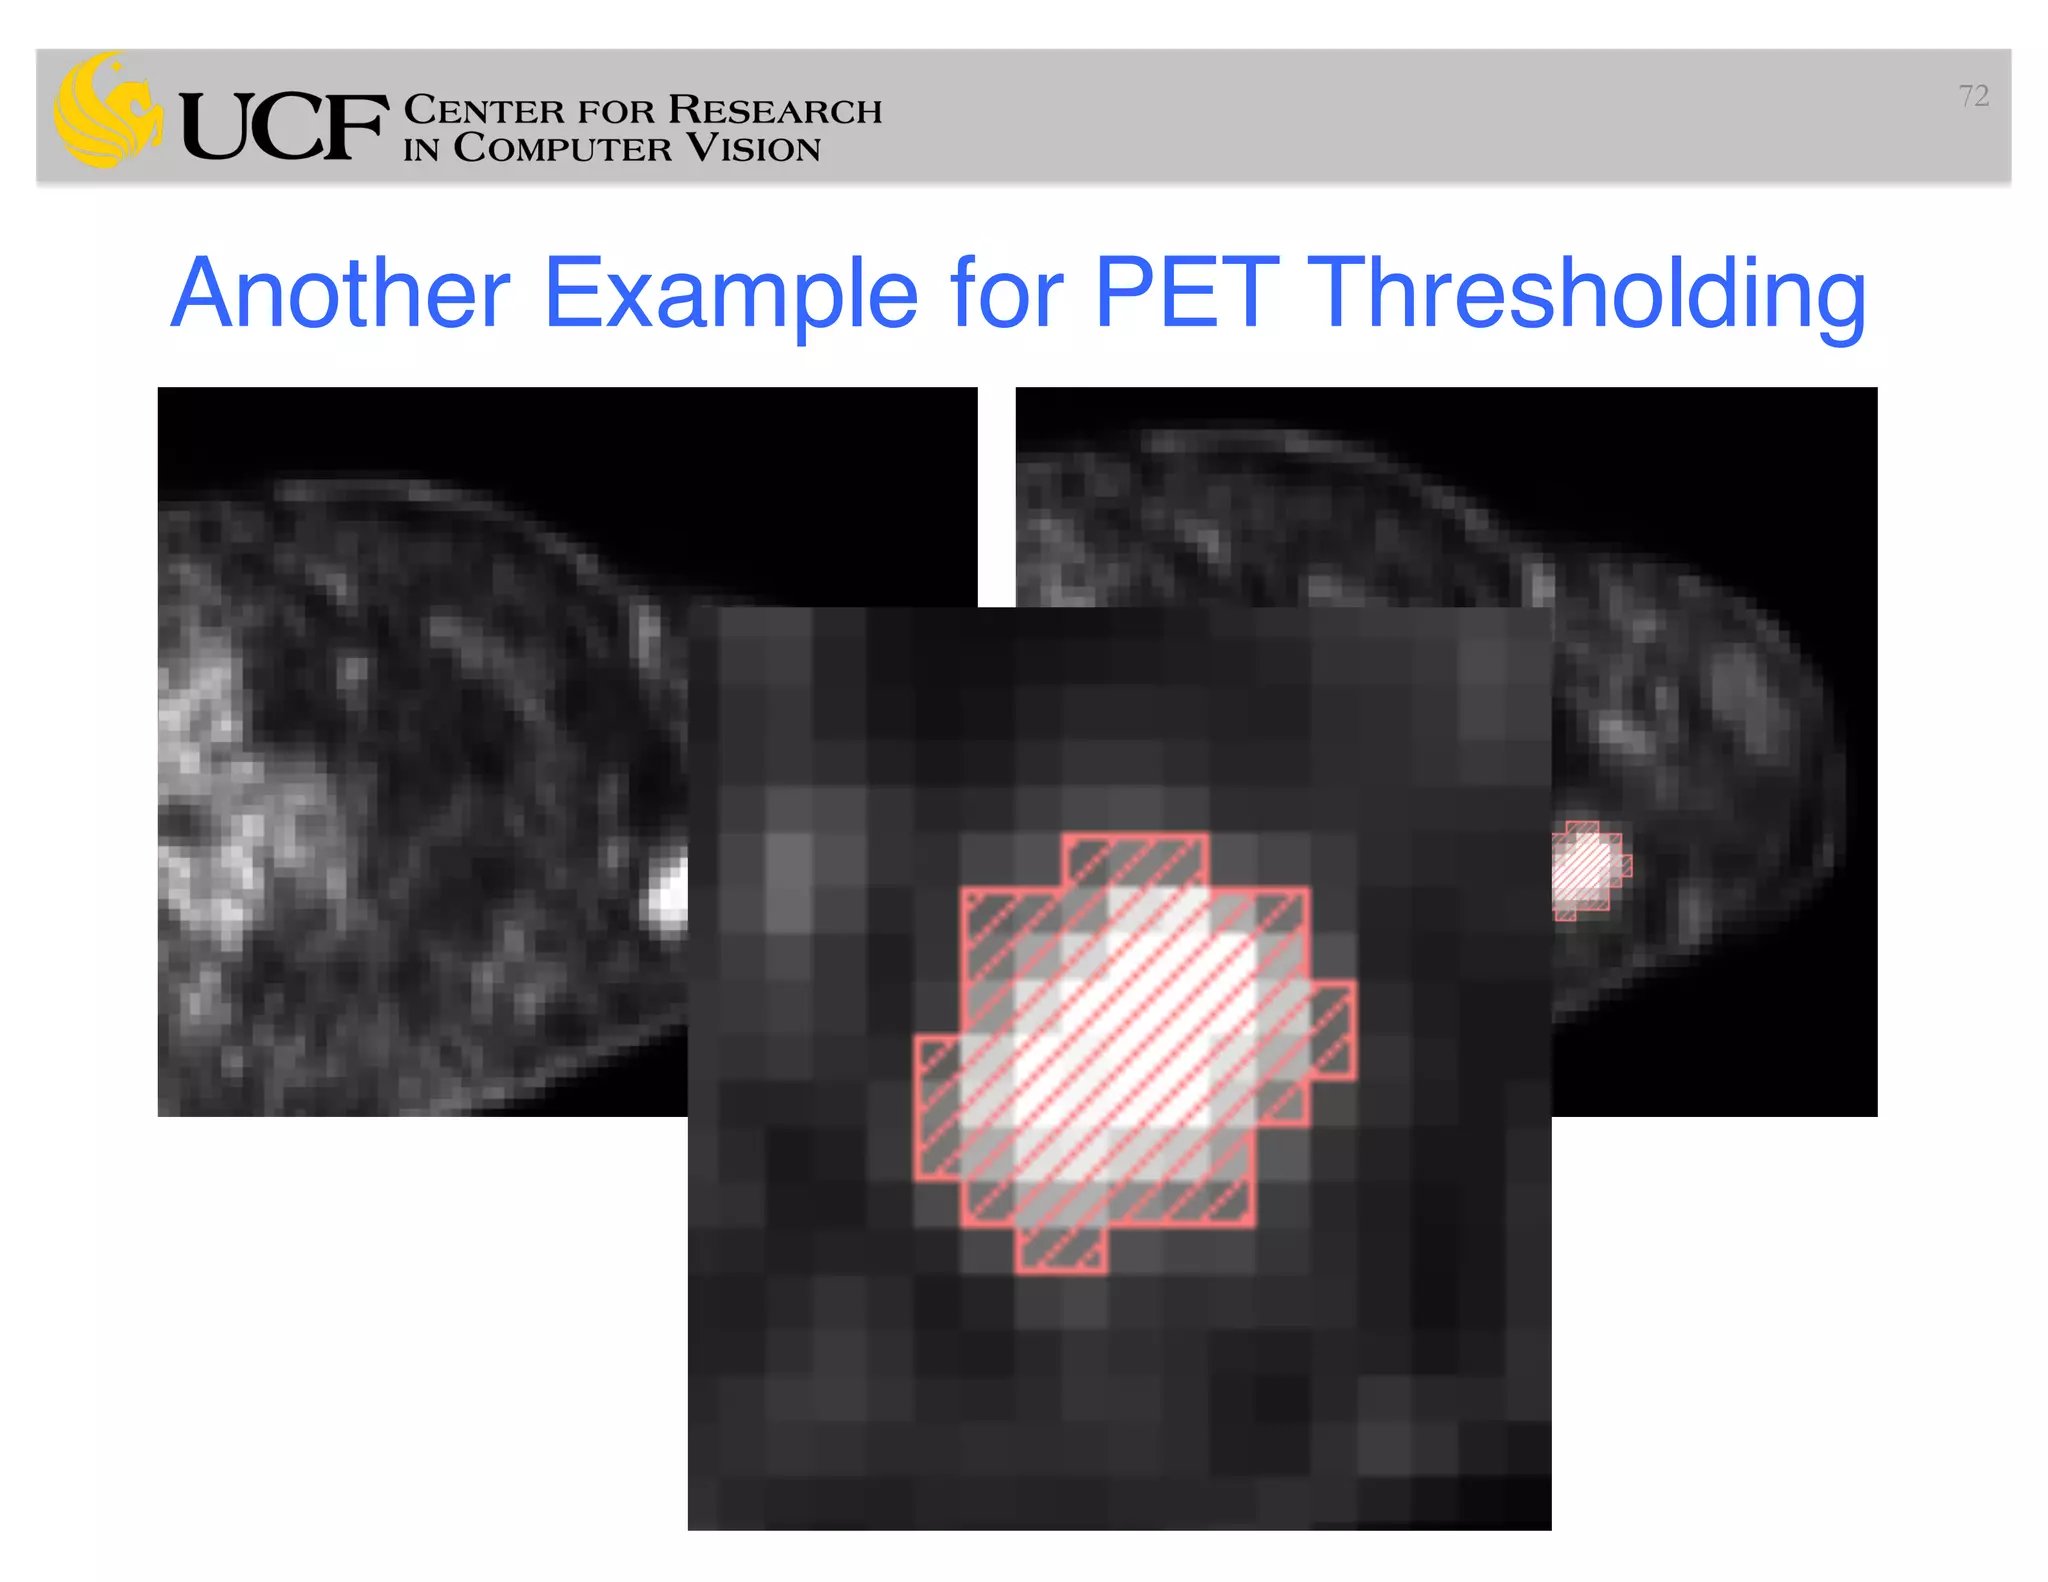
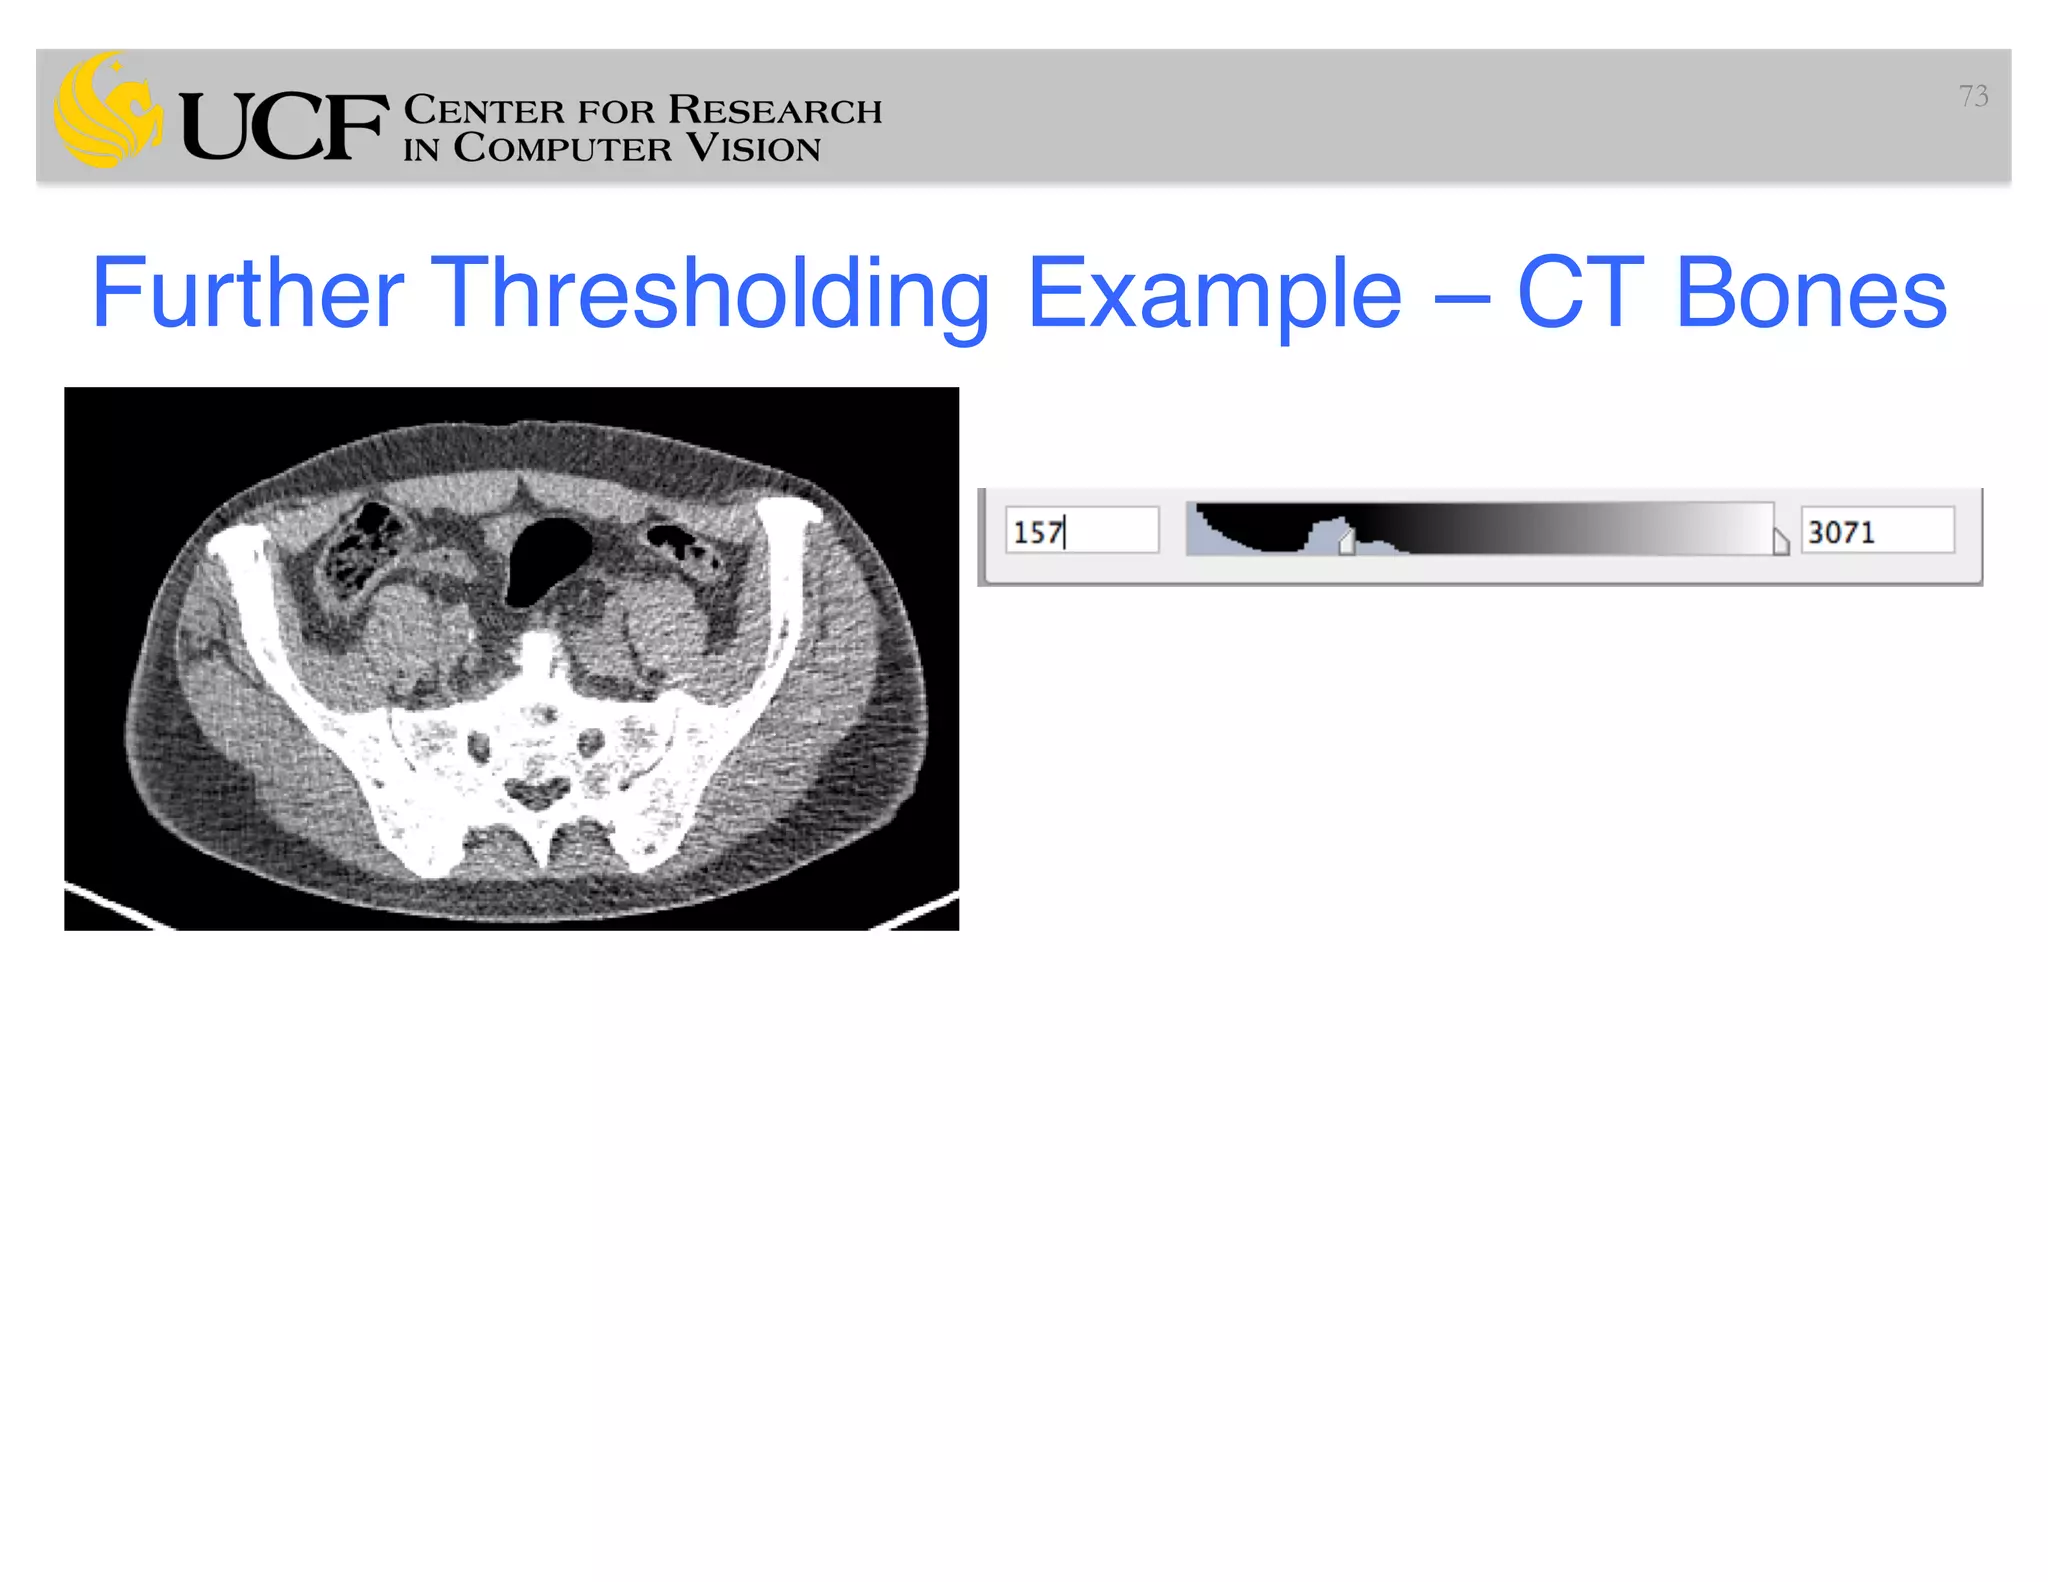
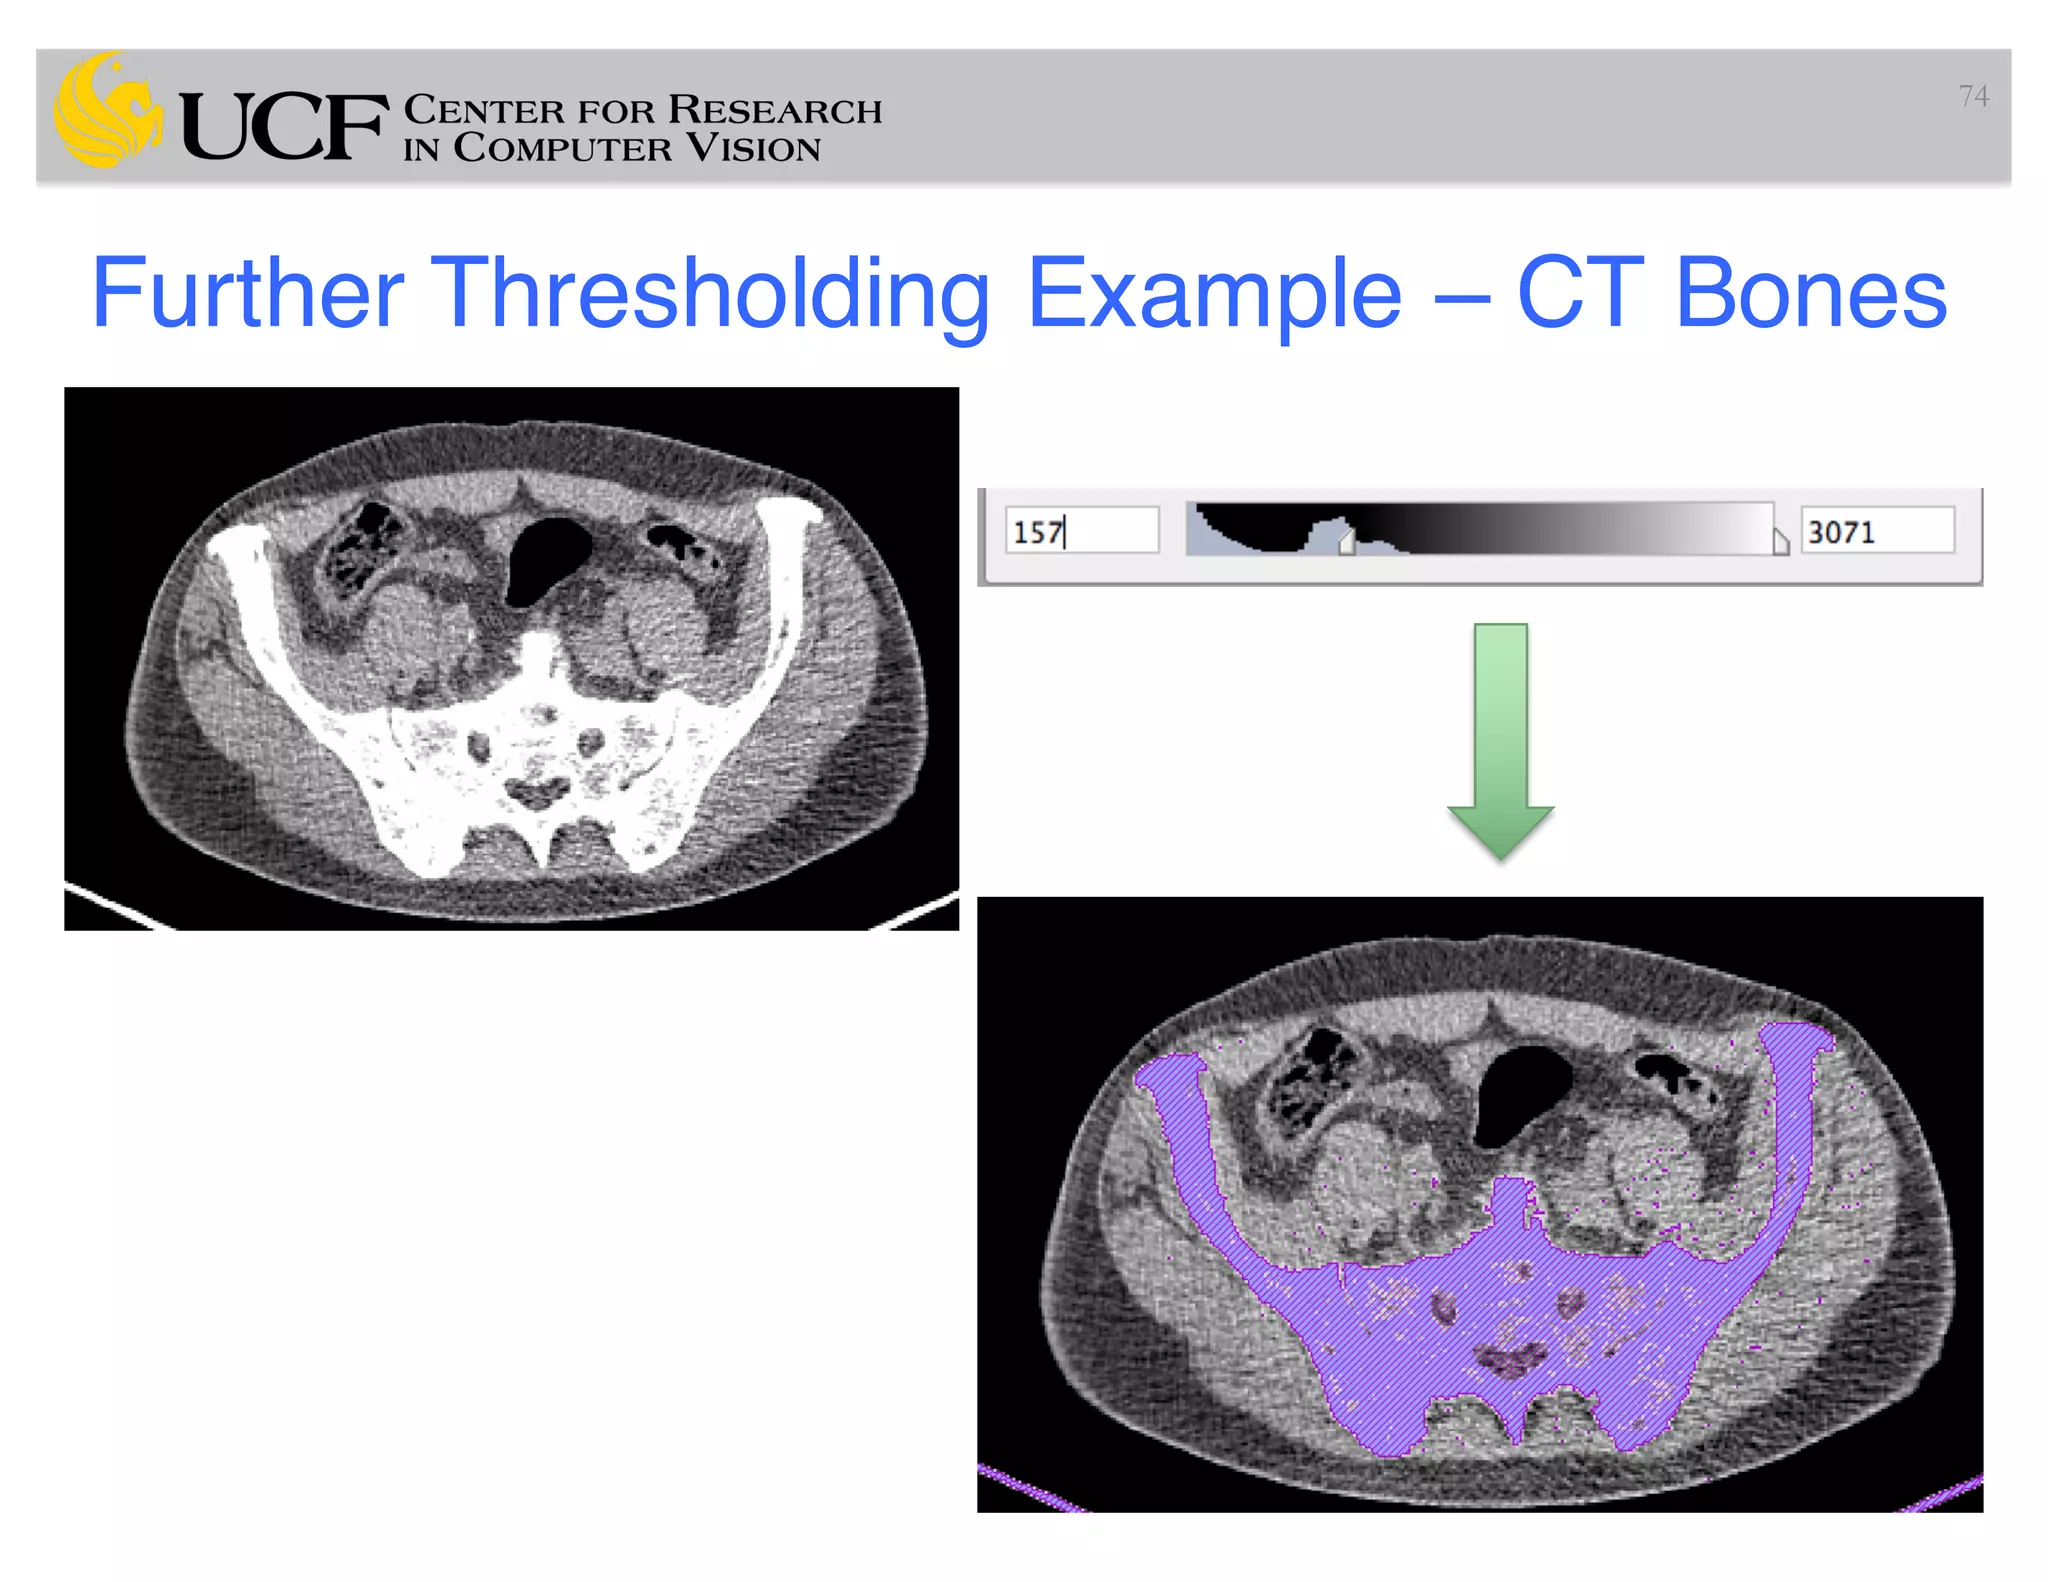
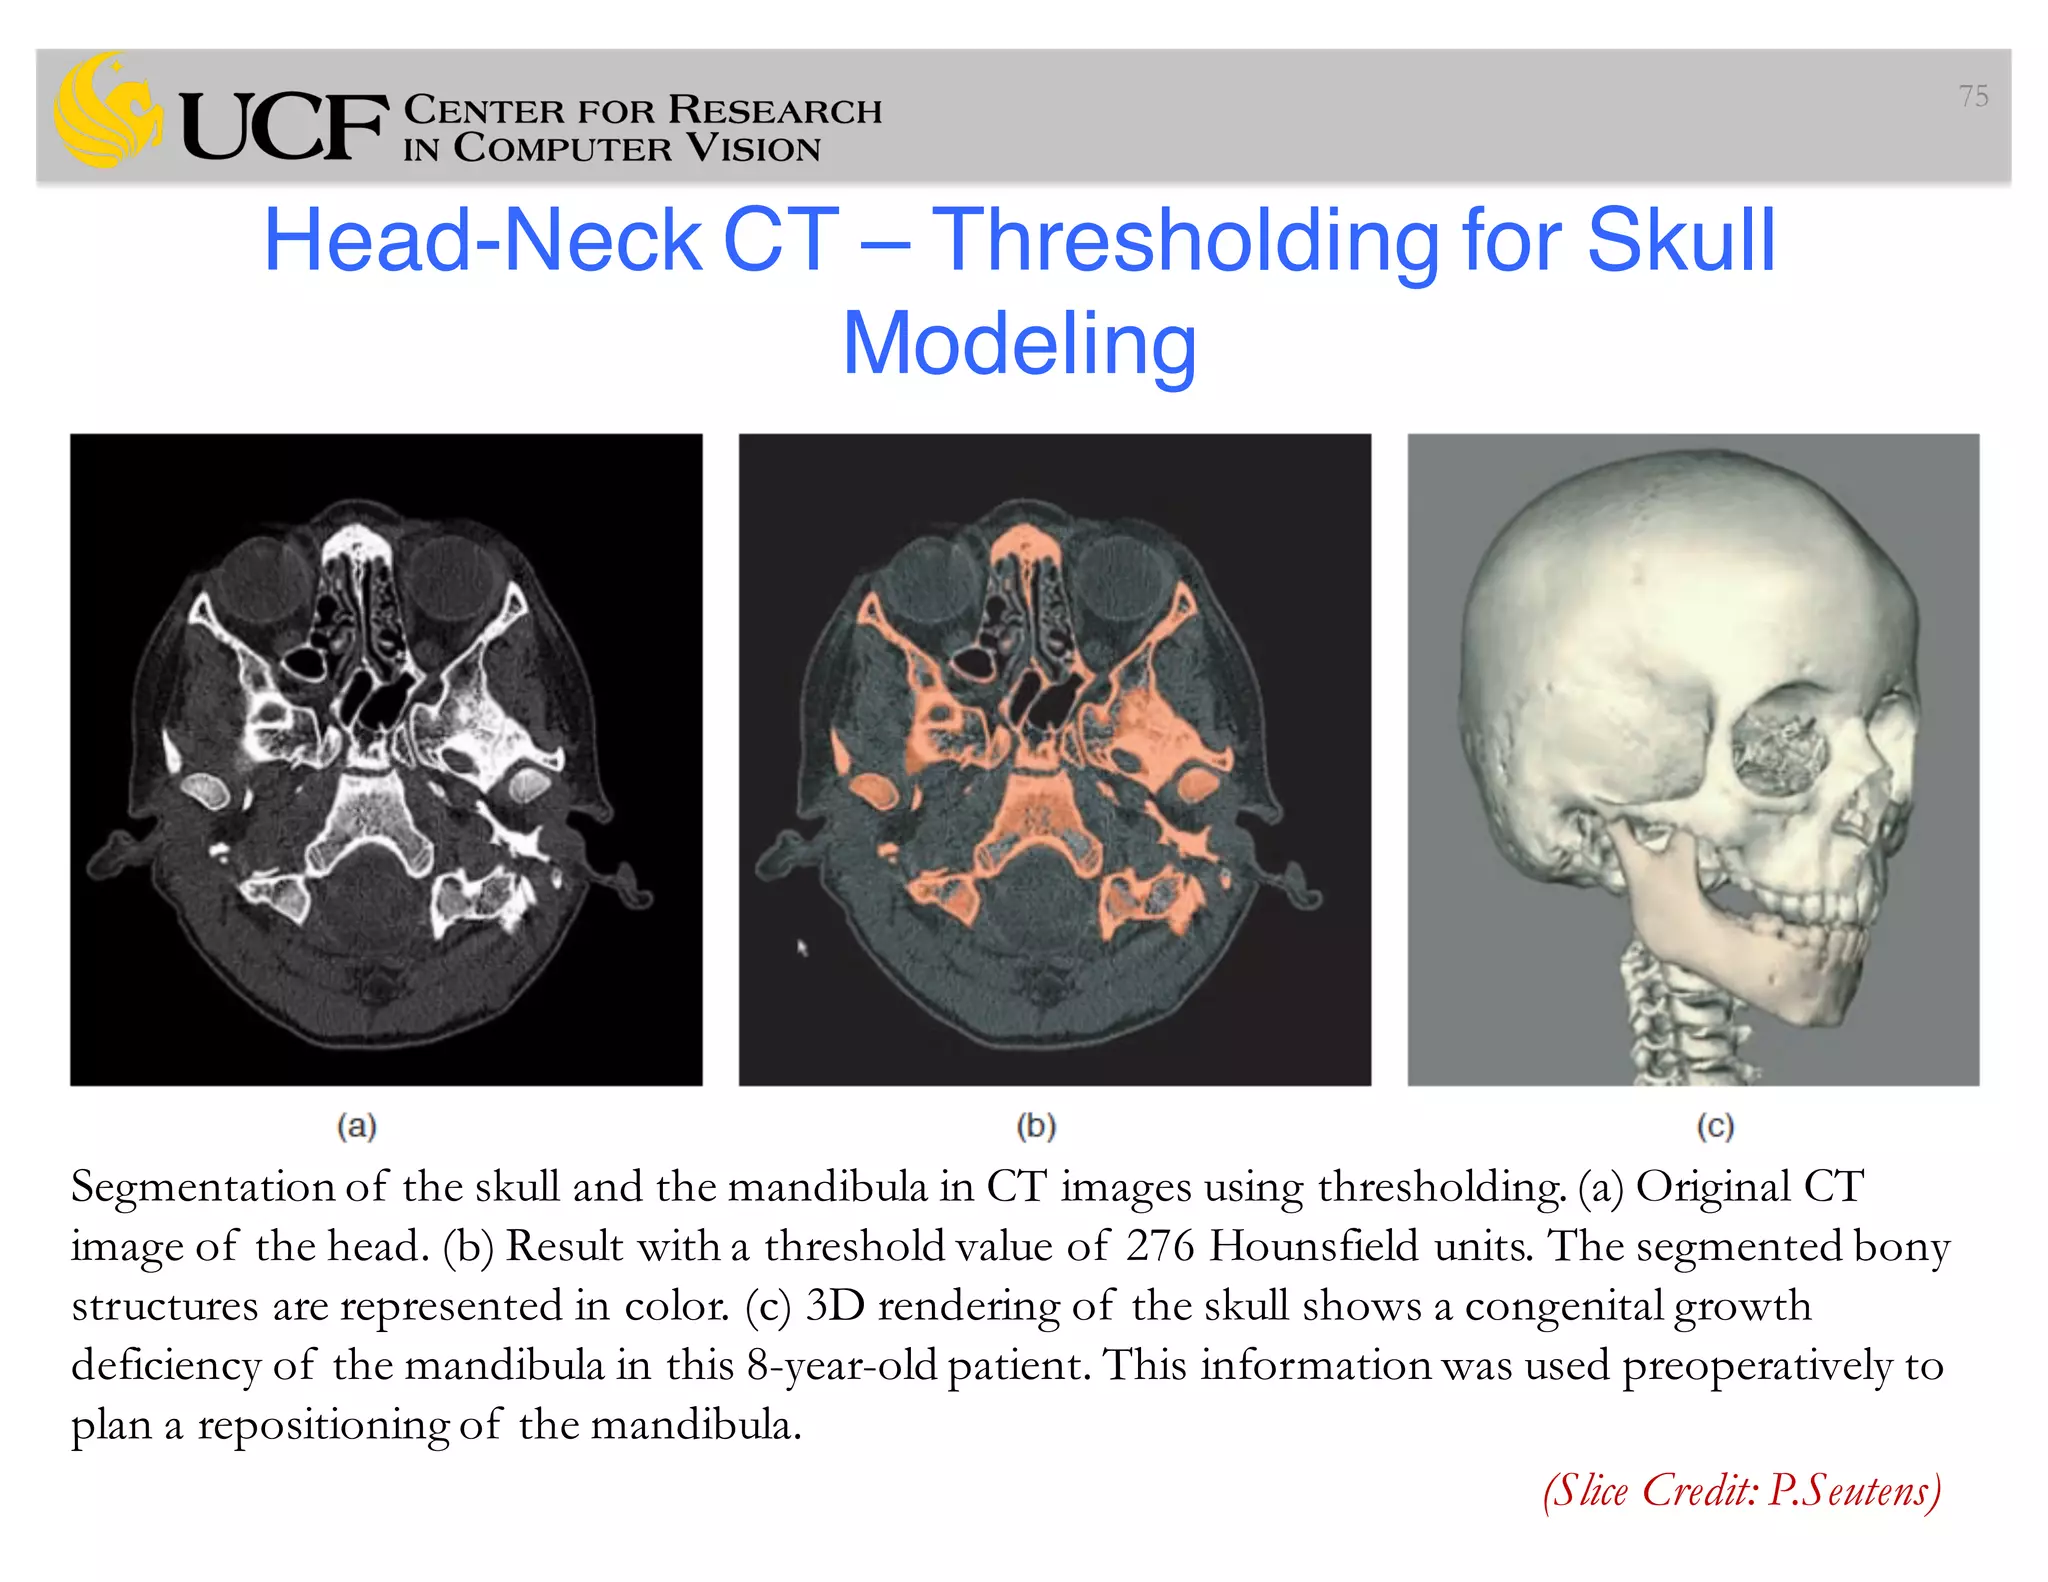
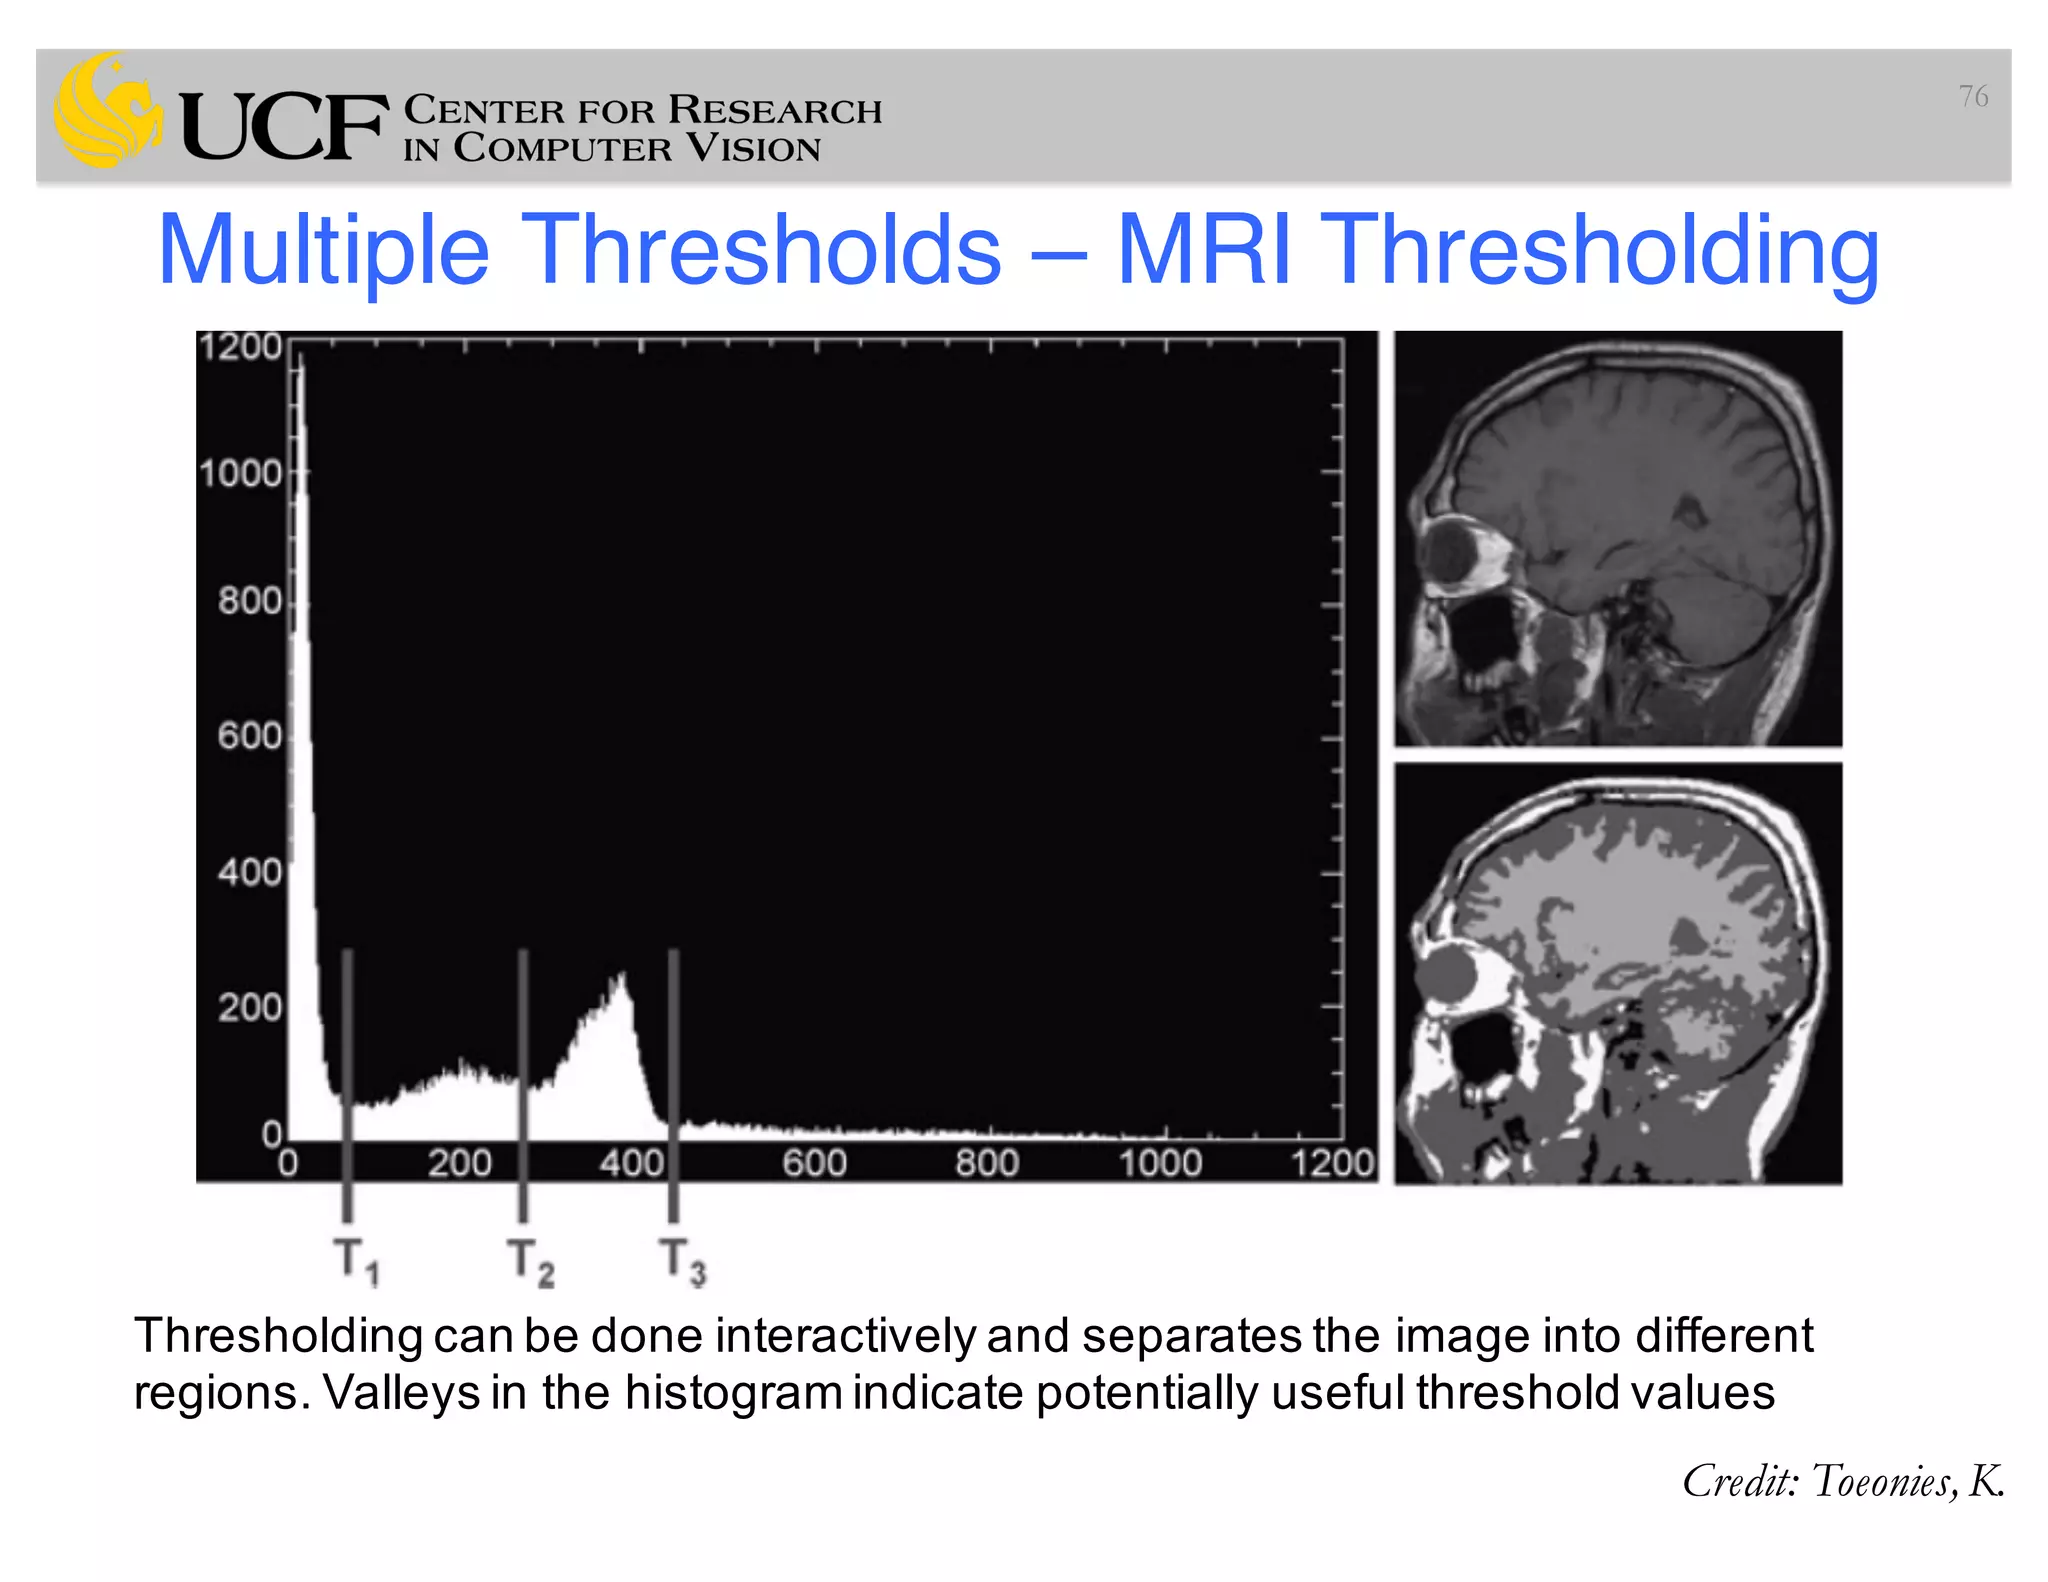

The document discusses medical image segmentation, focusing on its various methods and applications in radiology, particularly in tumor delineation and quantification of anatomical structures. It covers basic segmentation techniques such as thresholding, including Otsu's method, and highlights the importance of segmentation in diagnosing diseases using tools that aid in visualizing 3D anatomical relationships. The document also addresses different classification methods for segmentation and the challenges associated with each approach.