Download to read offline

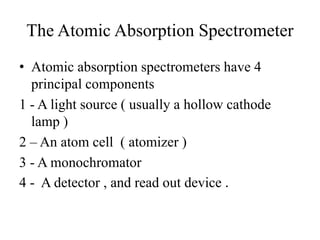
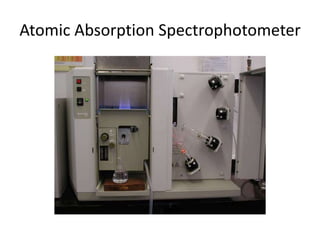
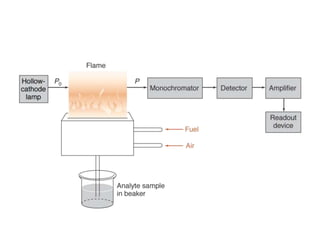
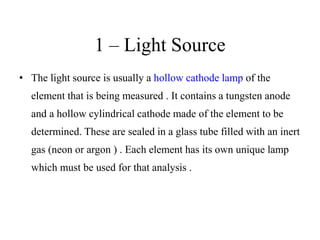
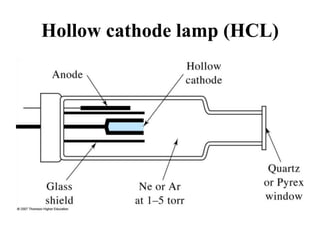
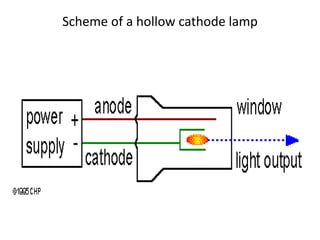
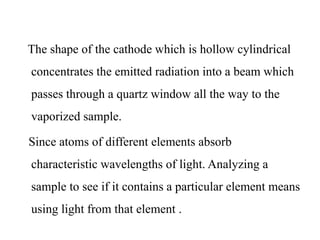
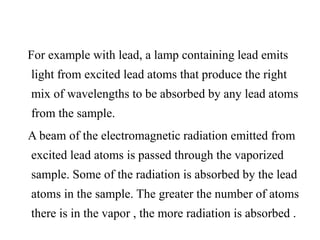
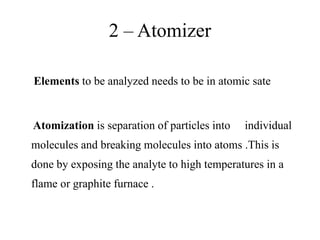
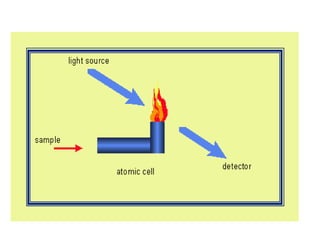
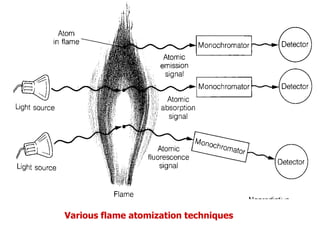
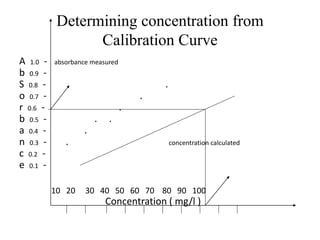
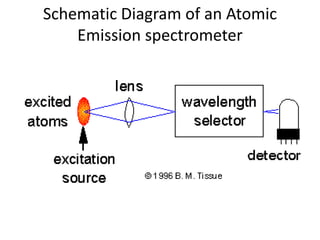
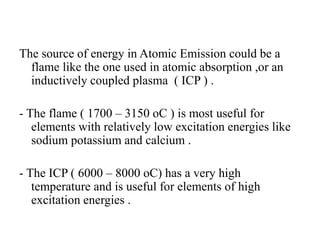
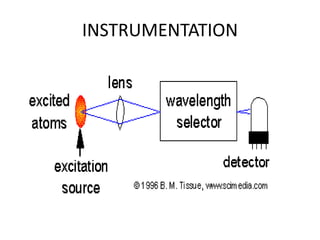
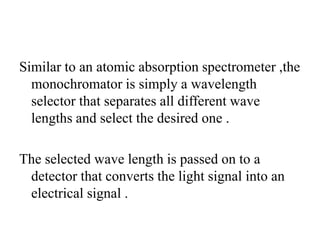
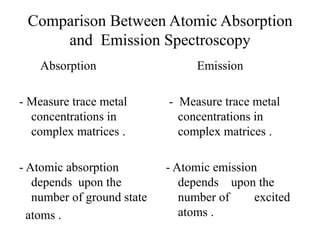

Atomic absorption spectroscopy is an analytical technique that measures the concentration of elements by using the absorption of light by ground state atoms. It works by vaporizing samples using a flame or furnace and passing light from a hollow cathode lamp of the element of interest through the vapor. The amount of light absorbed is measured and the concentration is determined using a calibration curve. Atomic emission spectroscopy similarly uses high temperatures to excite sample atoms, which then emit light of element-specific wavelengths that is measured to determine concentration. Both techniques use similar instrumentation including a light source, atomizer, monochromator, and detector.