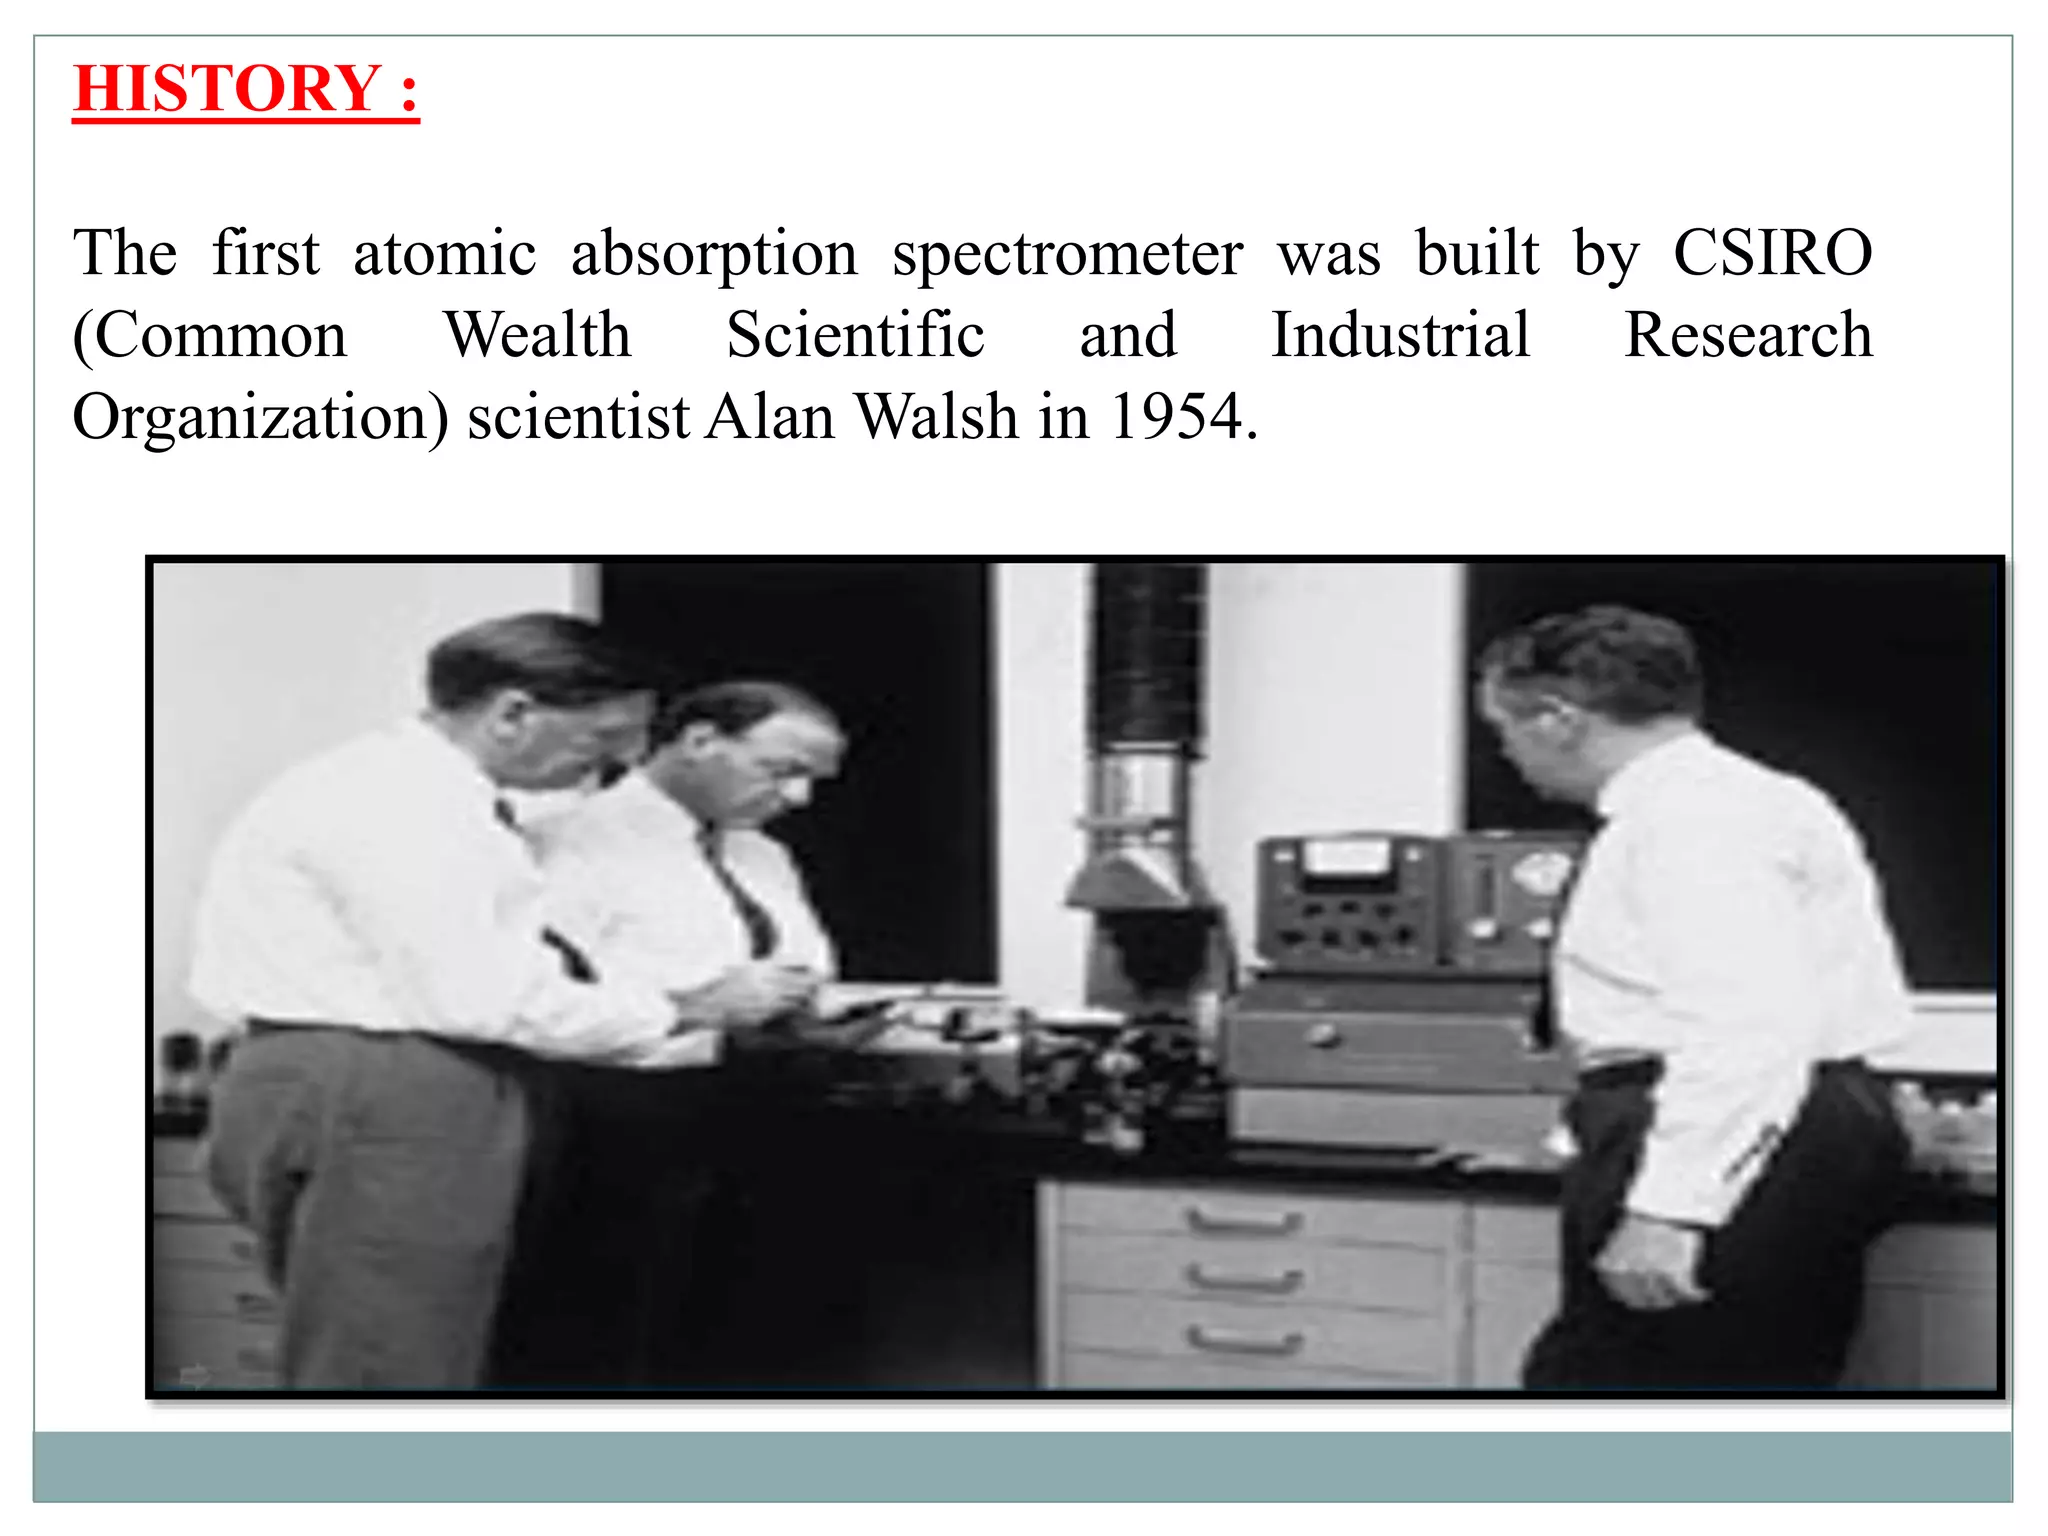
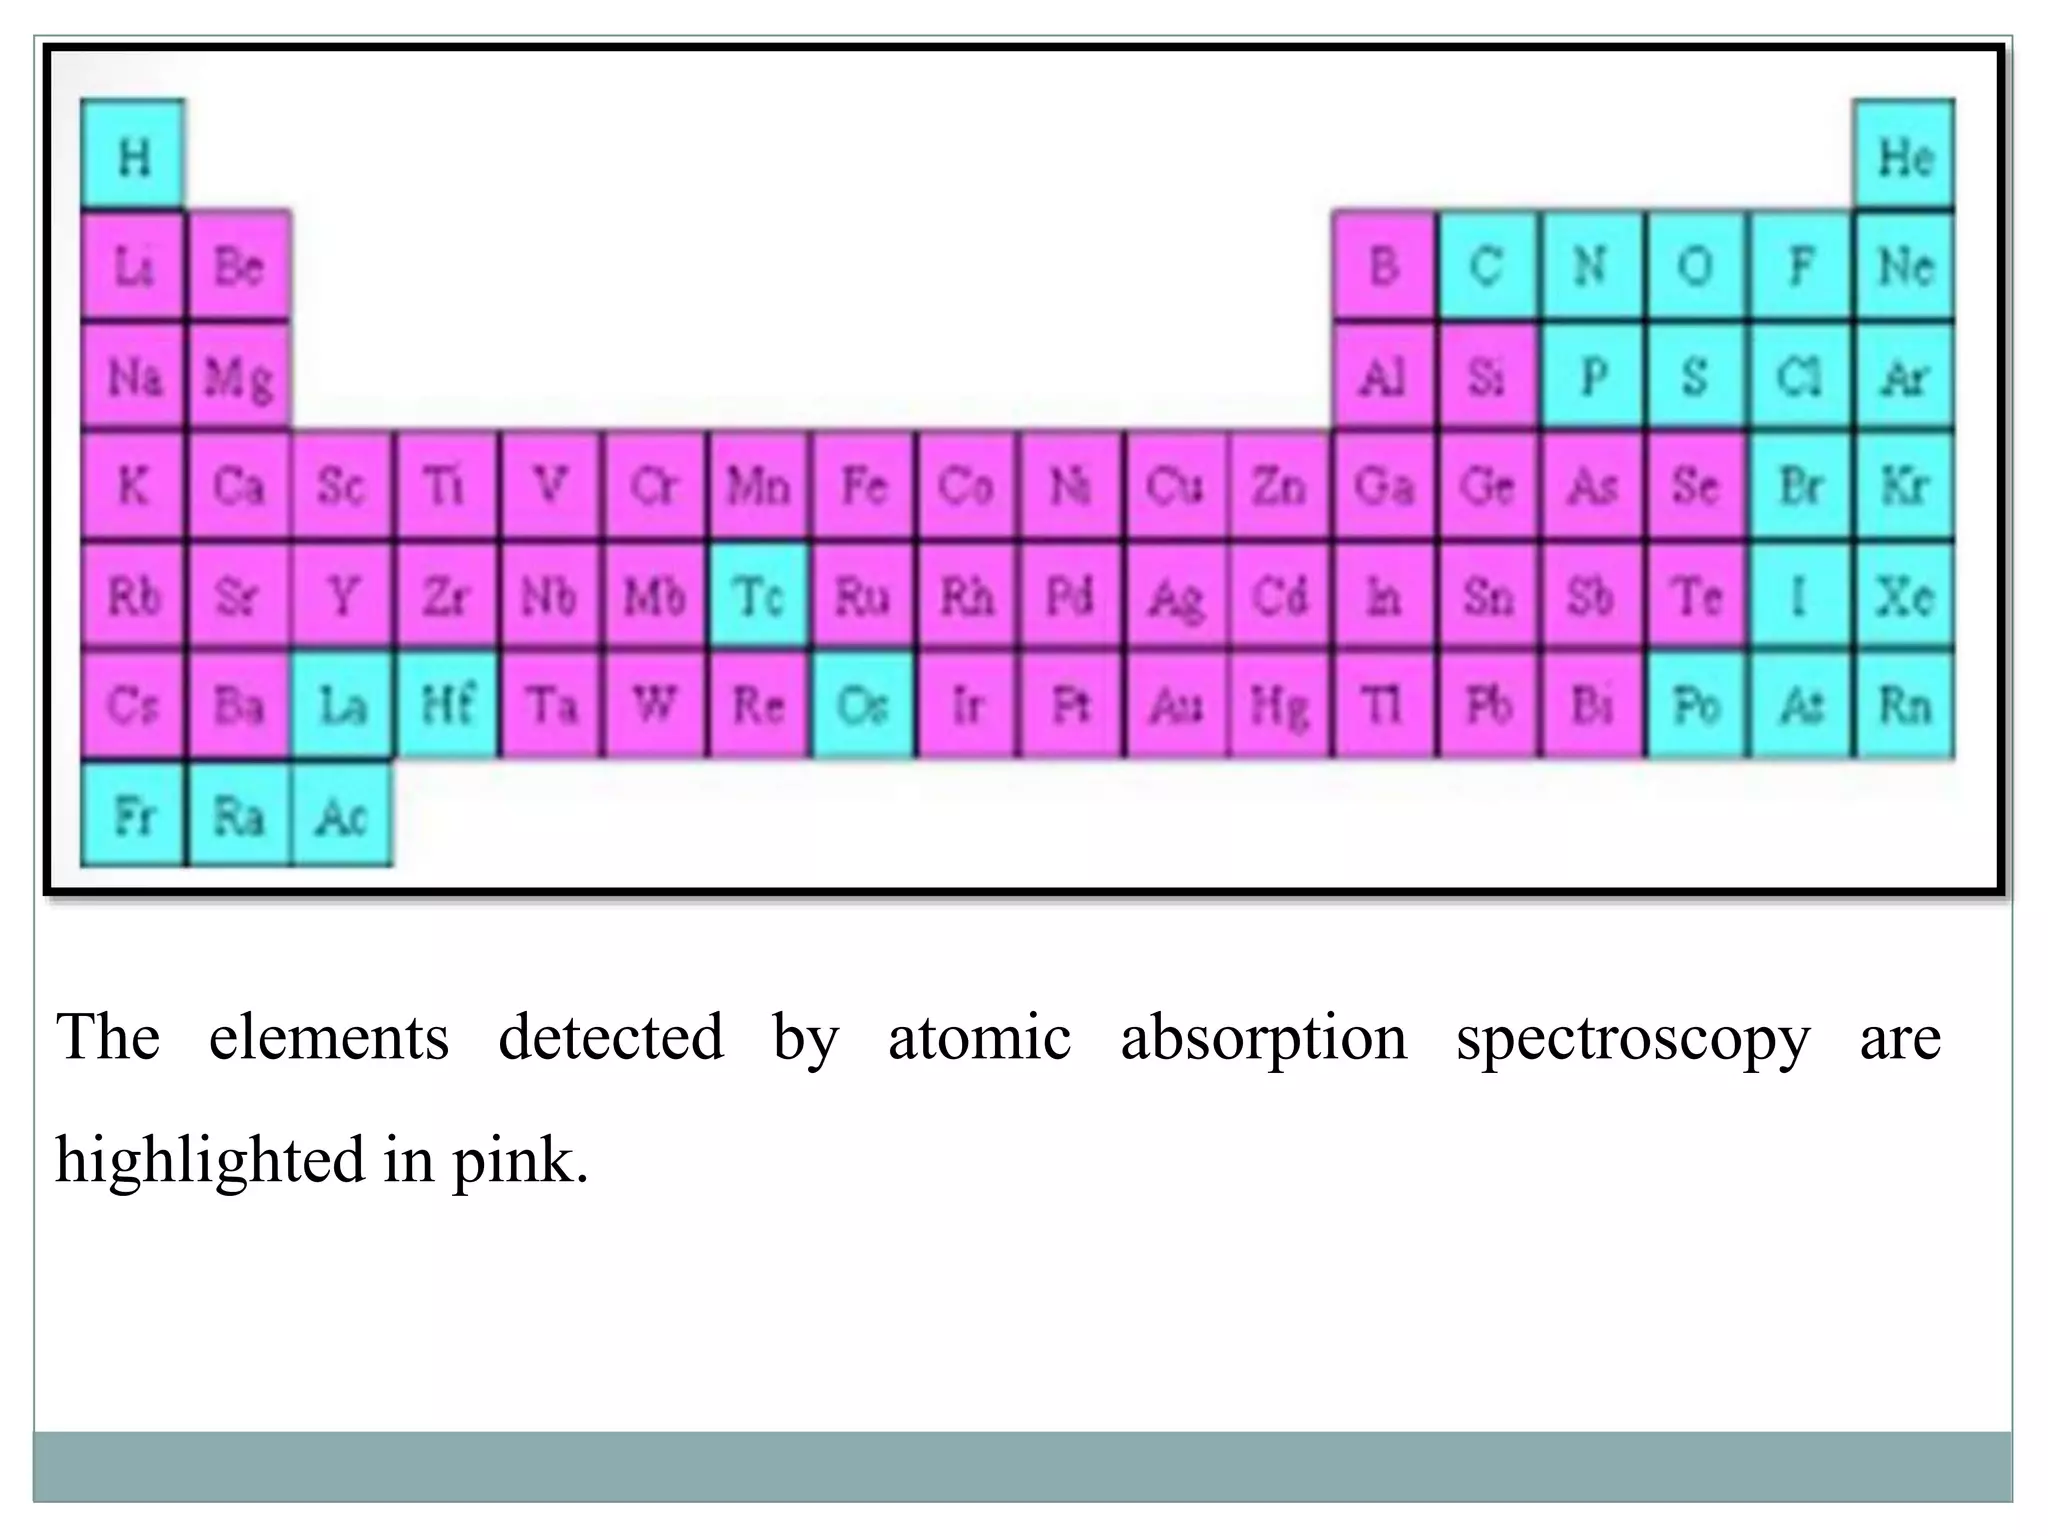
Atomic absorption spectroscopy is an analytical technique that measures the concentration of an element by detecting the amount of light absorbed by atoms of that element in the gaseous state. The document discusses the history, principle, instrumentation, interferences, calibration curve, and applications of atomic absorption spectroscopy. It also provides examples of experiments including determining vanadium in lubricating oil and lead in contaminated soil.