Atomic Absorption Spectroscopy
Presented by
S.Saravanan
M.Pharm (Pharmaceutics)
Sri Ramachandra University
Introduction
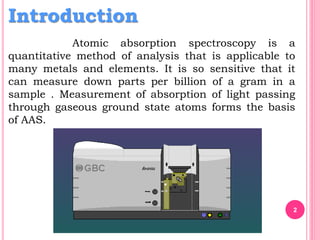
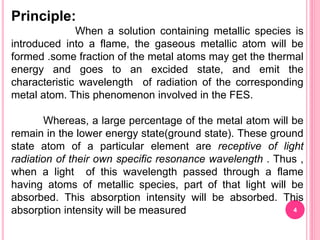
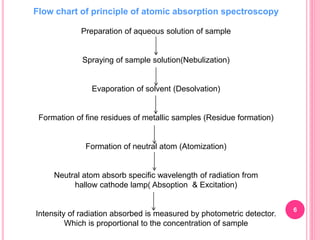
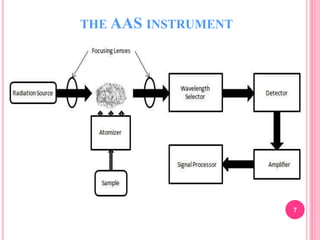
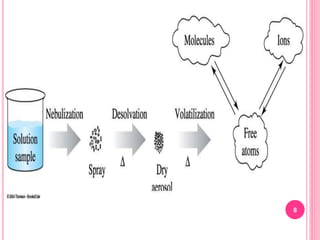
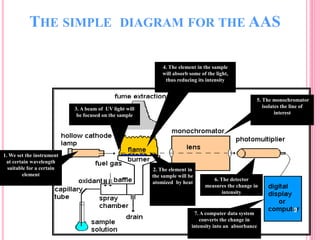
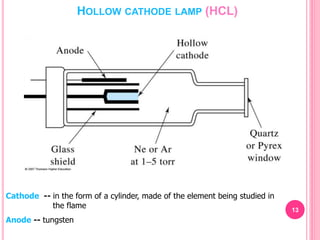
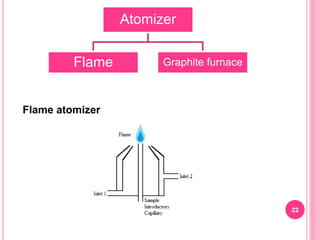
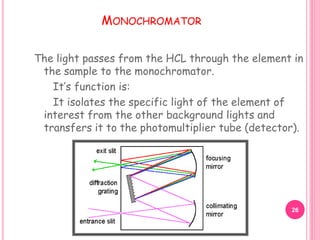
Atomic absorption spectroscopy is a
quantitative method of analysis that is applicable to
many metals and elements. It is so sensitive that it
can measure down parts per billion of a gram in a
sample . Measurement of absorption of light passing
through gaseous ground state atoms forms the basis
of AAS.
2
COMMONLY ENCOUNTERED TOXIC HEAVY
METALS
 Arsenic
 Lead
 Mercury
 Cadmium
 Iron
 Aluminum
3
Principle:
When a solution containing metallic species is
introduced into a flame, the gaseous metallic atom will be
formed .some fraction of the metal atoms may get the thermal
energy and goes to an excided state, and emit the
characteristic wavelength of radiation of the corresponding
metal atom. This phenomenon involved in the FES.
Whereas, a large percentage of the metal atom will be
remain in the lower energy state(ground state). These ground
state atom of a particular element are receptive of light
radiation of their own specific resonance wavelength . Thus ,
when a light of this wavelength passed through a flame
having atoms of metallic species, part of that light will be
absorbed. This absorption intensity will be absorbed. This
absorption intensity will be measured 4
This absorption intensity will be proportional to the
concentration of the atom in the ground state.
Mathematically the total amount of light absorbed may be
given by the following equation.
At the lambda wavelength the total amount of
light absorbed = ( e2 / mc).Nf
Where, e= charge of electron
M= mass of electron
C= speed of light
N=total number of atom that can absorb at specific
wavelength.
5
Flow chart of principle of atomic absorption spectroscopy
Preparation of aqueous solution of sample
Spraying of sample solution(Nebulization)
Evaporation of solvent (Desolvation)
Formation of fine residues of metallic samples (Residue formation)
Formation of neutral atom (Atomization)
Neutral atom absorb specific wavelength of radiation from
hallow cathode lamp( Absoption & Excitation)
Intensity of radiation absorbed is measured by photometric detector.
Which is proportional to the concentration of sample
6
:
THE AAS INSTRUMENT
7
8
THE SIMPLE DIAGRAM FOR THE AAS
1. We set the instrument
at certain wavelength
suitable for a certain
element
2. The element in
the sample will be
atomized by heat
3. A beam of UV light will
be focused on the sample
5. The monochromator
isolates the line of
interest
4. The element in the sample
will absorb some of the light,
thus reducing its intensity
6. The detector
measures the change in
intensity
7. A computer data system
converts the change in
intensity into an absorbance
9
10
Difference between AAS & FES
FES AAS
Measurement of emitted radiation
forms the basis of FES.
Measurement of intensity of
absorbed radiation is basis of AAS.
Intensity of emitted radiation is
directly proportional to the number
of atoms in excited state.
Intensity of absorbed radiation is
directly proportional to the number
of atoms in ground state.
Here excitation process and signal
response is influenced by flame
temperature.
Here absorption intensity and
signal response is independent to
temperature.
Relationship between emission
intensity Vs concentration in not
that much linear.
Absorption intensity Vs
concentration is very much linear.
11
Advantages of AAS
 Highly specific in nature – atom of a particular
element can only absorb radiation of their own
characteristic wavelength other elements cannot
be interfered in the study. Ex: light of a particular
wavelength can easily be absorbed by specific
element to which it is characteristic.
 Variation in flame temperature shows relatively
less effect in AAS than FES.
 High sensitive.
12
Disadvantages of AAS
 Need of separate lamp for each element to be
determined is main limitation of AAS.
 This technique cannot be used very successfully
for the elements which produce oxides in the
flame. Ex: Al, Ti, W, Mo, Si.
 In aqueous solution, the predominant anion effect
interfere the signal to a significant level.
 AAS is applicable to analysis of metals only.
 The one more major difficulty encountered with
AAS is the presence of incompletely absorbed
background emission from the source and
scattered light from the optical system. As
background becomes more intense relative to the
absorption of the analyte, the precision of the
measurement decreases dramatically..
HOLLOW CATHODE LAMP (HCL)
Cathode -- in the form of a cylinder, made of the element being studied in
the flame
Anode -- tungsten
13
1. A large voltage across the anode and cathode will cause the
inert gas to ionize.
2. The inert gas ions will then be accelerated into the cathode,
sputtering off atoms from the cathode.
3. Both the inert gas and the sputtered cathode atoms will in
turn be excited by collisions with each other.
4. When these excited atoms decay to lower energy levels they
emit a few spectral lines characteristic of the element of
interest.
5. The light is emitted directionally through the lamp's window,
a window made of a glass transparent in the UV and visible
wavelengths.
6. The light can then be detected and a spectrum can be
determined.
14
Burners:
1. Mecker burner,
2. Total consumption burner,
3. Laminar flow burner.
Total consumption burner
15
Laminar flow burner
Chopper:
It is a rotating wheel lies between HCL and Atomizer.
It is used to give Pulsating light. On rotation, it breaks the steady
light from the lamp into an intermittent or pulsating light
16
Nebulizer:
18
Common fuels and oxidants used in flame spectroscopy
 The technique requires a liquid sample to be
aspirated, aerosolized, and mixed with
combustible gases, such as acetylene and air
or acetylene and nitrous oxide.
 The mixture is ignited in a flame whose
temperature ranges from 2100 to 2800 ºC.
Flame Atomic Absorption Spectroscopy:
19
The process of lighting the AAS flame involves:
turning on first the fuel then the oxidant and then
lighting the flame with the instrument's auto
ignition system.
The flame breaks down the analyte's matrix  create
the elemental form of the analyte atom.
Ignition:
20
During combustion, atoms of the element of
Interest in the sample are reduced to
free,
unexcited ground state atoms, which absorb
light at characteristic wavelengths.
21
Atomizer
Flame Graphite furnace
22
Flame atomizer
23
Graphite furnace technique
process
drying ashing atomization
24
Graphite furnace technique
Advantages
Small sample sizes ( as low as 0.5 uL)
Very little or no sample preparation is needed
Sensitivity is enhanced
( 10 -10 –10-13 g , 100- 1000 folds)
Direct analysis of solid samples
25
Graphite furnace technique
Disadvantages
Background absorption effects
Analyte may be lost at the ashing stage
The sample may not be completely atomized
The precision was poor than the flame method
(5%-10% vs 1%)
The analytical range is relatively narrow
(less than two orders of magnitude)
MONOCHROMATOR
The light passes from the HCL through the element in
the sample to the monochromator.
It’s function is:
It isolates the specific light of the element of
interest from the other background lights and
transfers it to the photomultiplier tube (detector).
26
PHOTOMULTIPLIER TUBE (PMT)
Before an analyte is aspirated, a measured signal is
generated by the PMT as light from the HCL passes
through the flame. When analyte atoms are present in
the flame--while the sample is aspirated--some of that
light is absorbed by those atoms. This causes a
decrease in PMT signal that is proportional to the
amount of analyte
.
PMT
27
The PMT detects the amount of reduction of
the light intensity due to absorption by the
analyte, and this can be directly related to
the amount of the element in the sample.
The PMT converts the light signal into an
electrical
signal and a computer system translates
it into
absorbance.
28
PhotomultiplierTube
e-
Light
Dynode
Dynode
Dynode
Photocathode
Current
Convert light energy to electrical energy
29
Application:
 Estimation of trace elements in biological fluids (Eg:
Urine, blood etc…)
 Estimation of elements like copper, Nickel and Zinc in
food product.
 Estimation of Magnesium, Zin etc in blood.
 Estimation of Mercury in thiomersol solution.
 Estimation of Lead in calcium carbonate, petrol etc.
 Estimation of elements in soil samples, water supply,
effluents, ceramics etc.
30
Applications:
31
1. Qualitative Analysis:
• Different HCL lamp is been used for each element to be tested.
• As qualitative analysis involves the checking of one element at a time.It means
that process is very laborious.
2. Quantitative Analysis:
• This technique is based on the determination of the amount of radiation
absorbed by the sample.
• If the value of radiation absorbed is substituted in equation,the number of
absorbing atoms in light path is been determined.
Total amount of light absorbed= e2/mc.Nf
Calibration Curve:
The first job in quantitative analysis is preparation of calibration curve.
• In order to prepare this curve, the read out device should be adjusted to 100%
transmission with blank and 0% transmittance when no radiation energy is
entering the monochromator slit.
• A series of standard samples of that element which is to be determined
quantitatively is aspirated into the burner and the percentage of absorption is
measured.
Absorbance(A)=Slope(m) x Concentration(c)
3. Simultaneous multi component analysis:
 If a multi element emission source is available, one can do
simultaneous multi-component analysis.
 Previously, such determinations are not been made due to
lack of such a multi-element hallow cathode.
 The Mitchell(1973) described a multi element atomic
absorption using a multi-element hallow cathode source and
vidiocon detection system.
 Using spectral region from 2320 to 3281A0.
 Mitchell detect 8 elements(zn,cd,Ni,Co,Fe,Mu,Cu,Ag)
simultaneously.
32
4. Determination of metallic elements in Biological material:
 By this procedure, we extract the trace elements and go to estimation
using 50% hydrogen peroxide.
 It also has been used in combination with concentrated sulphuric acid
and nitric acid.
5. Determination of metallic elements in Food Industry:
 Copper,Zinc,Nickel are the most common toxic elements of interest to
food analyst for solid food stuffs.
 The most common procedure is to extract the trace metals by
digestion with the dilute sulphuric acid or with nitric acid or with 50%
hydrogen peroxide.
6. Determination of calcium,mg,Na,K in blood serum:
 Dilute the sample serum 10,0 or 50 times in the presence of
lanthanium chloride which overcome the possible under estimation of
calcium due to phosphate suppression.
 Then, the test solution are aspirated to the atomic absorption
spectrum and the absorbance measured and compared with aqueous
standard solution.
33
34
Click Here To Show Movie
REFERENCE:
1. Instrumental methods of chemical analysis by
R.Chatwal and A.Anand.Page no:2.343 to 2.388.
2. Principles of Instrumental Analysis by SK009,
Holler,Nieman Page number:206 to 229.
3. Instrumental methods of chemical analysis by:
H.Kaur.
4. A textbook of pharmaceutical Analysis by Ravi
shankar.
5. www.analytepharma.com
6. www.pharmainstrument.in
35
Thank you
36

APA seminar

  • 1.
    Atomic Absorption Spectroscopy Presentedby S.Saravanan M.Pharm (Pharmaceutics) Sri Ramachandra University
  • 2.
    Introduction Atomic absorption spectroscopyis a quantitative method of analysis that is applicable to many metals and elements. It is so sensitive that it can measure down parts per billion of a gram in a sample . Measurement of absorption of light passing through gaseous ground state atoms forms the basis of AAS. 2
  • 3.
    COMMONLY ENCOUNTERED TOXICHEAVY METALS  Arsenic  Lead  Mercury  Cadmium  Iron  Aluminum 3
  • 4.
    Principle: When a solutioncontaining metallic species is introduced into a flame, the gaseous metallic atom will be formed .some fraction of the metal atoms may get the thermal energy and goes to an excided state, and emit the characteristic wavelength of radiation of the corresponding metal atom. This phenomenon involved in the FES. Whereas, a large percentage of the metal atom will be remain in the lower energy state(ground state). These ground state atom of a particular element are receptive of light radiation of their own specific resonance wavelength . Thus , when a light of this wavelength passed through a flame having atoms of metallic species, part of that light will be absorbed. This absorption intensity will be absorbed. This absorption intensity will be measured 4
  • 5.
    This absorption intensitywill be proportional to the concentration of the atom in the ground state. Mathematically the total amount of light absorbed may be given by the following equation. At the lambda wavelength the total amount of light absorbed = ( e2 / mc).Nf Where, e= charge of electron M= mass of electron C= speed of light N=total number of atom that can absorb at specific wavelength. 5
  • 6.
    Flow chart ofprinciple of atomic absorption spectroscopy Preparation of aqueous solution of sample Spraying of sample solution(Nebulization) Evaporation of solvent (Desolvation) Formation of fine residues of metallic samples (Residue formation) Formation of neutral atom (Atomization) Neutral atom absorb specific wavelength of radiation from hallow cathode lamp( Absoption & Excitation) Intensity of radiation absorbed is measured by photometric detector. Which is proportional to the concentration of sample 6
  • 7.
  • 8.
  • 9.
    THE SIMPLE DIAGRAMFOR THE AAS 1. We set the instrument at certain wavelength suitable for a certain element 2. The element in the sample will be atomized by heat 3. A beam of UV light will be focused on the sample 5. The monochromator isolates the line of interest 4. The element in the sample will absorb some of the light, thus reducing its intensity 6. The detector measures the change in intensity 7. A computer data system converts the change in intensity into an absorbance 9
  • 10.
    10 Difference between AAS& FES FES AAS Measurement of emitted radiation forms the basis of FES. Measurement of intensity of absorbed radiation is basis of AAS. Intensity of emitted radiation is directly proportional to the number of atoms in excited state. Intensity of absorbed radiation is directly proportional to the number of atoms in ground state. Here excitation process and signal response is influenced by flame temperature. Here absorption intensity and signal response is independent to temperature. Relationship between emission intensity Vs concentration in not that much linear. Absorption intensity Vs concentration is very much linear.
  • 11.
    11 Advantages of AAS Highly specific in nature – atom of a particular element can only absorb radiation of their own characteristic wavelength other elements cannot be interfered in the study. Ex: light of a particular wavelength can easily be absorbed by specific element to which it is characteristic.  Variation in flame temperature shows relatively less effect in AAS than FES.  High sensitive.
  • 12.
    12 Disadvantages of AAS Need of separate lamp for each element to be determined is main limitation of AAS.  This technique cannot be used very successfully for the elements which produce oxides in the flame. Ex: Al, Ti, W, Mo, Si.  In aqueous solution, the predominant anion effect interfere the signal to a significant level.  AAS is applicable to analysis of metals only.  The one more major difficulty encountered with AAS is the presence of incompletely absorbed background emission from the source and scattered light from the optical system. As background becomes more intense relative to the absorption of the analyte, the precision of the measurement decreases dramatically..
  • 13.
    HOLLOW CATHODE LAMP(HCL) Cathode -- in the form of a cylinder, made of the element being studied in the flame Anode -- tungsten 13
  • 14.
    1. A largevoltage across the anode and cathode will cause the inert gas to ionize. 2. The inert gas ions will then be accelerated into the cathode, sputtering off atoms from the cathode. 3. Both the inert gas and the sputtered cathode atoms will in turn be excited by collisions with each other. 4. When these excited atoms decay to lower energy levels they emit a few spectral lines characteristic of the element of interest. 5. The light is emitted directionally through the lamp's window, a window made of a glass transparent in the UV and visible wavelengths. 6. The light can then be detected and a spectrum can be determined. 14
  • 15.
    Burners: 1. Mecker burner, 2.Total consumption burner, 3. Laminar flow burner. Total consumption burner 15
  • 16.
    Laminar flow burner Chopper: Itis a rotating wheel lies between HCL and Atomizer. It is used to give Pulsating light. On rotation, it breaks the steady light from the lamp into an intermittent or pulsating light 16
  • 17.
  • 18.
    18 Common fuels andoxidants used in flame spectroscopy
  • 19.
     The techniquerequires a liquid sample to be aspirated, aerosolized, and mixed with combustible gases, such as acetylene and air or acetylene and nitrous oxide.  The mixture is ignited in a flame whose temperature ranges from 2100 to 2800 ºC. Flame Atomic Absorption Spectroscopy: 19
  • 20.
    The process oflighting the AAS flame involves: turning on first the fuel then the oxidant and then lighting the flame with the instrument's auto ignition system. The flame breaks down the analyte's matrix  create the elemental form of the analyte atom. Ignition: 20
  • 21.
    During combustion, atomsof the element of Interest in the sample are reduced to free, unexcited ground state atoms, which absorb light at characteristic wavelengths. 21
  • 22.
  • 23.
  • 24.
    24 Graphite furnace technique Advantages Smallsample sizes ( as low as 0.5 uL) Very little or no sample preparation is needed Sensitivity is enhanced ( 10 -10 –10-13 g , 100- 1000 folds) Direct analysis of solid samples
  • 25.
    25 Graphite furnace technique Disadvantages Backgroundabsorption effects Analyte may be lost at the ashing stage The sample may not be completely atomized The precision was poor than the flame method (5%-10% vs 1%) The analytical range is relatively narrow (less than two orders of magnitude)
  • 26.
    MONOCHROMATOR The light passesfrom the HCL through the element in the sample to the monochromator. It’s function is: It isolates the specific light of the element of interest from the other background lights and transfers it to the photomultiplier tube (detector). 26
  • 27.
    PHOTOMULTIPLIER TUBE (PMT) Beforean analyte is aspirated, a measured signal is generated by the PMT as light from the HCL passes through the flame. When analyte atoms are present in the flame--while the sample is aspirated--some of that light is absorbed by those atoms. This causes a decrease in PMT signal that is proportional to the amount of analyte . PMT 27
  • 28.
    The PMT detectsthe amount of reduction of the light intensity due to absorption by the analyte, and this can be directly related to the amount of the element in the sample. The PMT converts the light signal into an electrical signal and a computer system translates it into absorbance. 28
  • 29.
  • 30.
    Application:  Estimation oftrace elements in biological fluids (Eg: Urine, blood etc…)  Estimation of elements like copper, Nickel and Zinc in food product.  Estimation of Magnesium, Zin etc in blood.  Estimation of Mercury in thiomersol solution.  Estimation of Lead in calcium carbonate, petrol etc.  Estimation of elements in soil samples, water supply, effluents, ceramics etc. 30
  • 31.
    Applications: 31 1. Qualitative Analysis: •Different HCL lamp is been used for each element to be tested. • As qualitative analysis involves the checking of one element at a time.It means that process is very laborious. 2. Quantitative Analysis: • This technique is based on the determination of the amount of radiation absorbed by the sample. • If the value of radiation absorbed is substituted in equation,the number of absorbing atoms in light path is been determined. Total amount of light absorbed= e2/mc.Nf Calibration Curve: The first job in quantitative analysis is preparation of calibration curve. • In order to prepare this curve, the read out device should be adjusted to 100% transmission with blank and 0% transmittance when no radiation energy is entering the monochromator slit. • A series of standard samples of that element which is to be determined quantitatively is aspirated into the burner and the percentage of absorption is measured. Absorbance(A)=Slope(m) x Concentration(c)
  • 32.
    3. Simultaneous multicomponent analysis:  If a multi element emission source is available, one can do simultaneous multi-component analysis.  Previously, such determinations are not been made due to lack of such a multi-element hallow cathode.  The Mitchell(1973) described a multi element atomic absorption using a multi-element hallow cathode source and vidiocon detection system.  Using spectral region from 2320 to 3281A0.  Mitchell detect 8 elements(zn,cd,Ni,Co,Fe,Mu,Cu,Ag) simultaneously. 32
  • 33.
    4. Determination ofmetallic elements in Biological material:  By this procedure, we extract the trace elements and go to estimation using 50% hydrogen peroxide.  It also has been used in combination with concentrated sulphuric acid and nitric acid. 5. Determination of metallic elements in Food Industry:  Copper,Zinc,Nickel are the most common toxic elements of interest to food analyst for solid food stuffs.  The most common procedure is to extract the trace metals by digestion with the dilute sulphuric acid or with nitric acid or with 50% hydrogen peroxide. 6. Determination of calcium,mg,Na,K in blood serum:  Dilute the sample serum 10,0 or 50 times in the presence of lanthanium chloride which overcome the possible under estimation of calcium due to phosphate suppression.  Then, the test solution are aspirated to the atomic absorption spectrum and the absorbance measured and compared with aqueous standard solution. 33
  • 34.
    34 Click Here ToShow Movie
  • 35.
    REFERENCE: 1. Instrumental methodsof chemical analysis by R.Chatwal and A.Anand.Page no:2.343 to 2.388. 2. Principles of Instrumental Analysis by SK009, Holler,Nieman Page number:206 to 229. 3. Instrumental methods of chemical analysis by: H.Kaur. 4. A textbook of pharmaceutical Analysis by Ravi shankar. 5. www.analytepharma.com 6. www.pharmainstrument.in 35
  • 36.