Download as PDF, PPTX


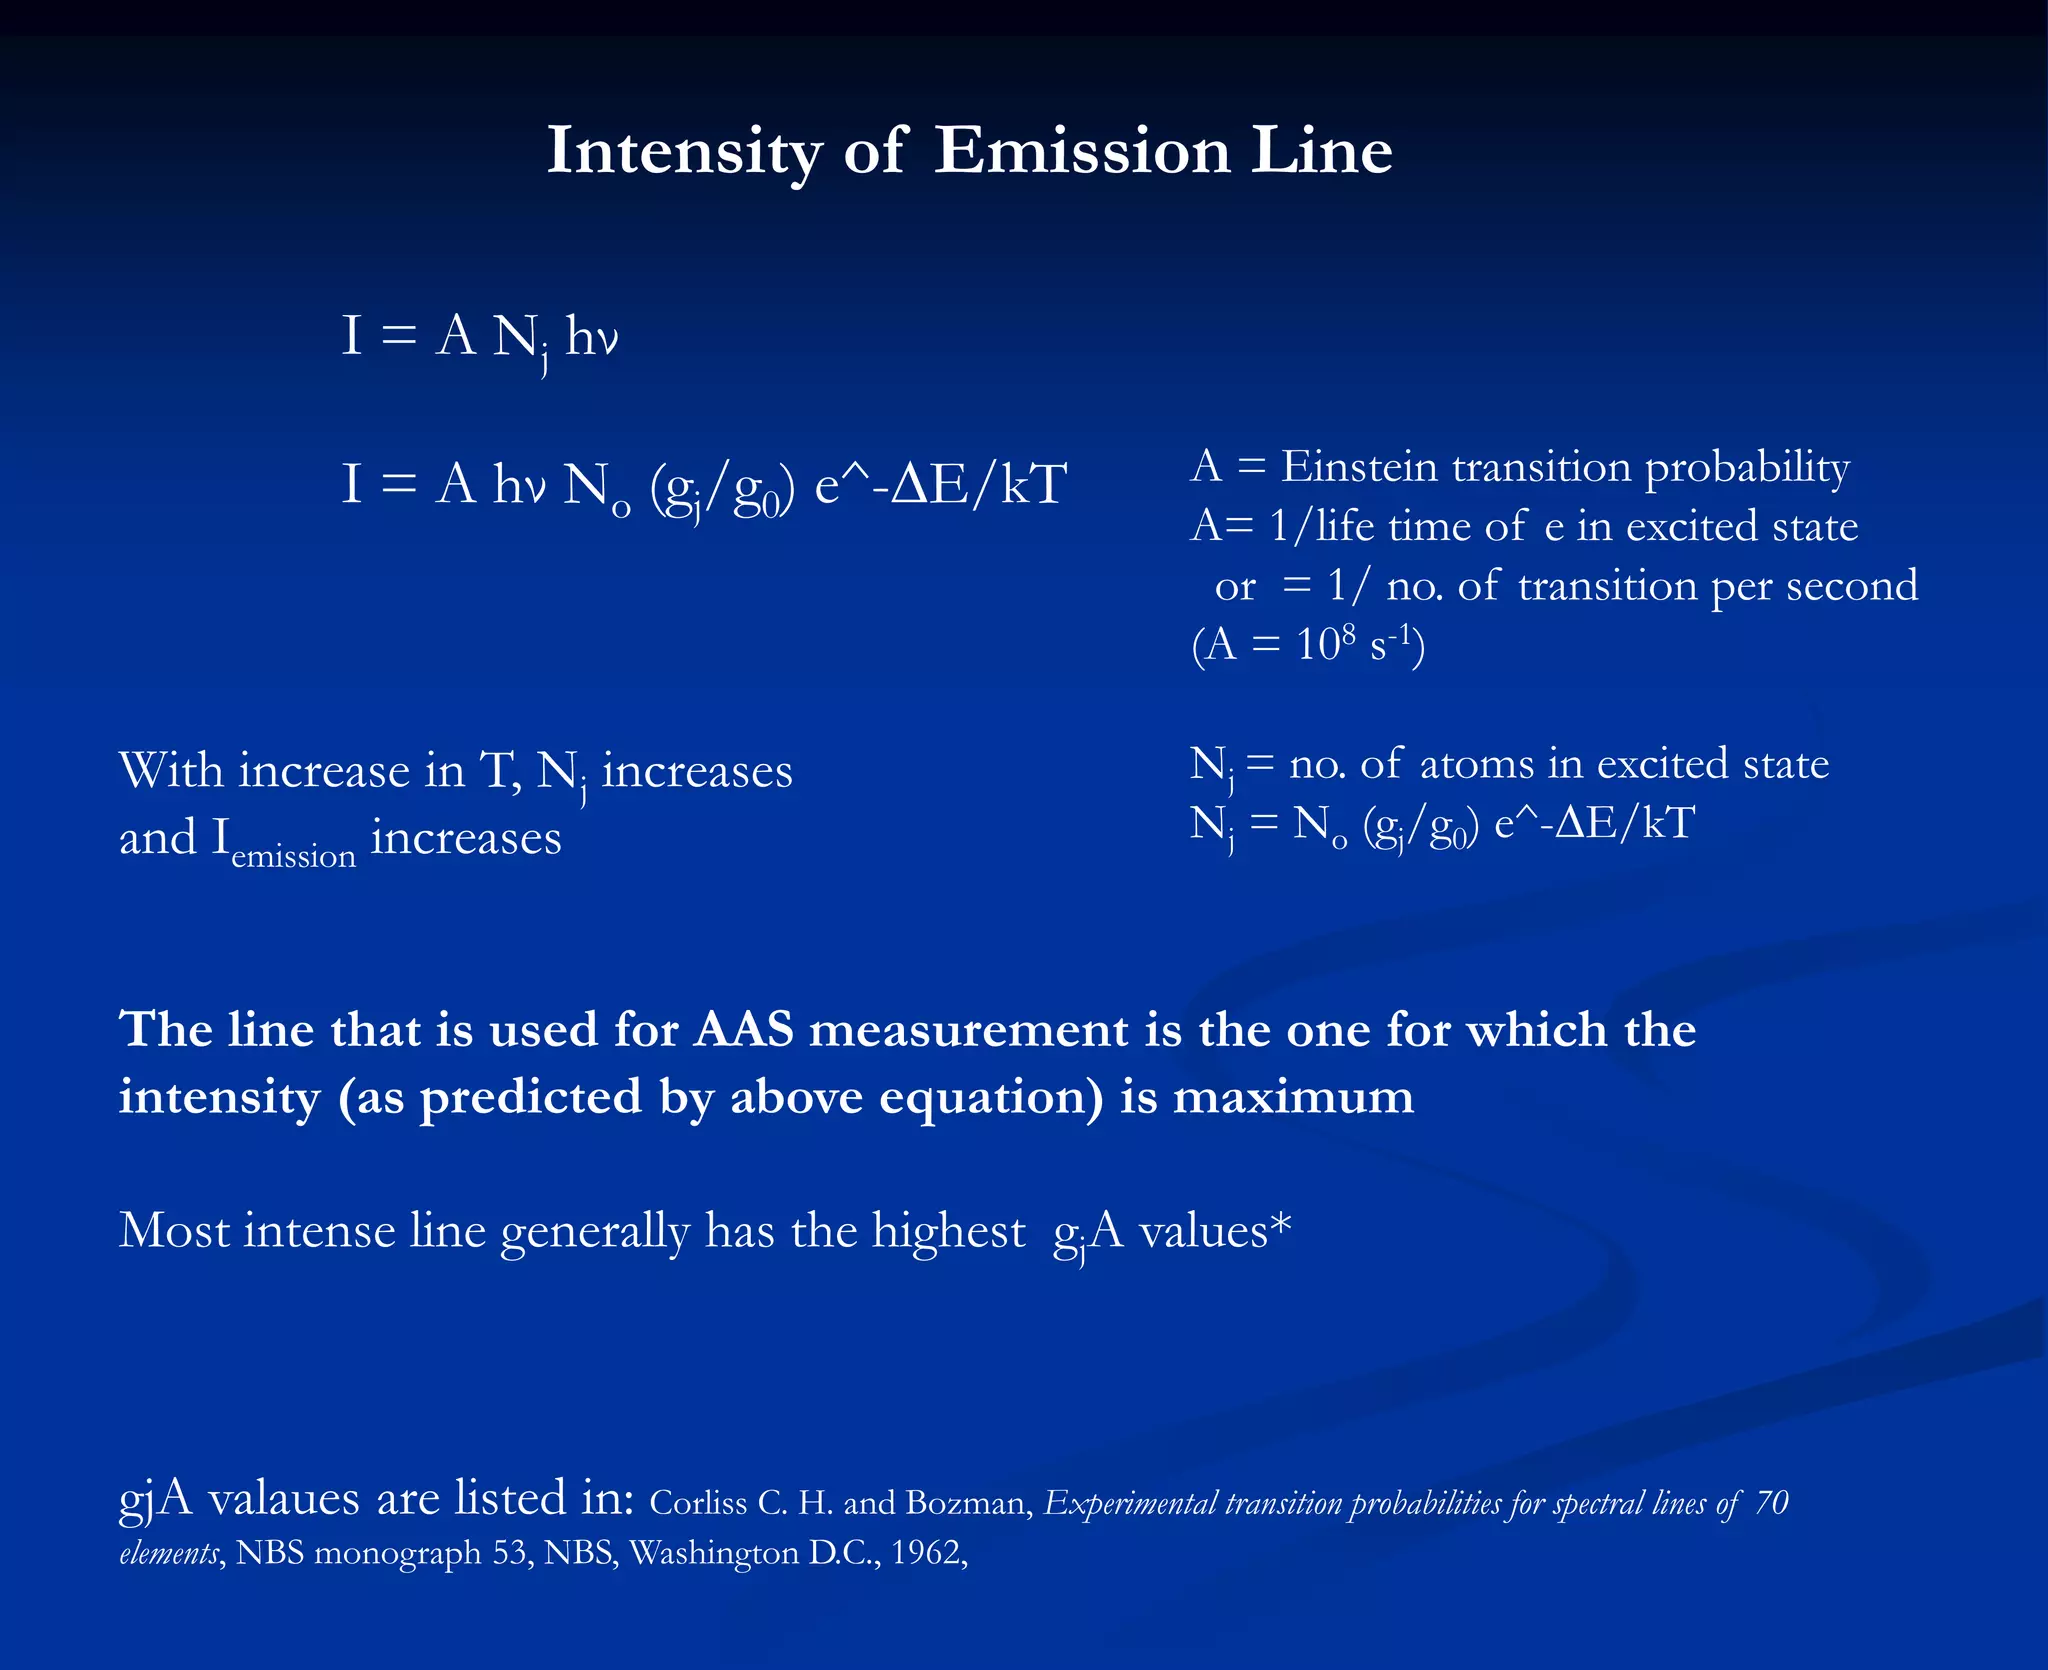


![71
Hydride generation methods
(HGAAS)
For arsenic (As), antimony (Te) and selenium (Se)
As0
(gas) + H2As (V) AsH3
NaBH4
(sol)
heat
in flame[H+]
The reaction of many metalloids with sodium borohydride
and HCl produces a volatile hydride: H2Te, H2Se, H3As,
H3Sb, etc.](https://image.slidesharecdn.com/aas-drsajjad-190127110121/75/Atomic-Absorption-Spectroscopy-AAS-71-2048.jpg)


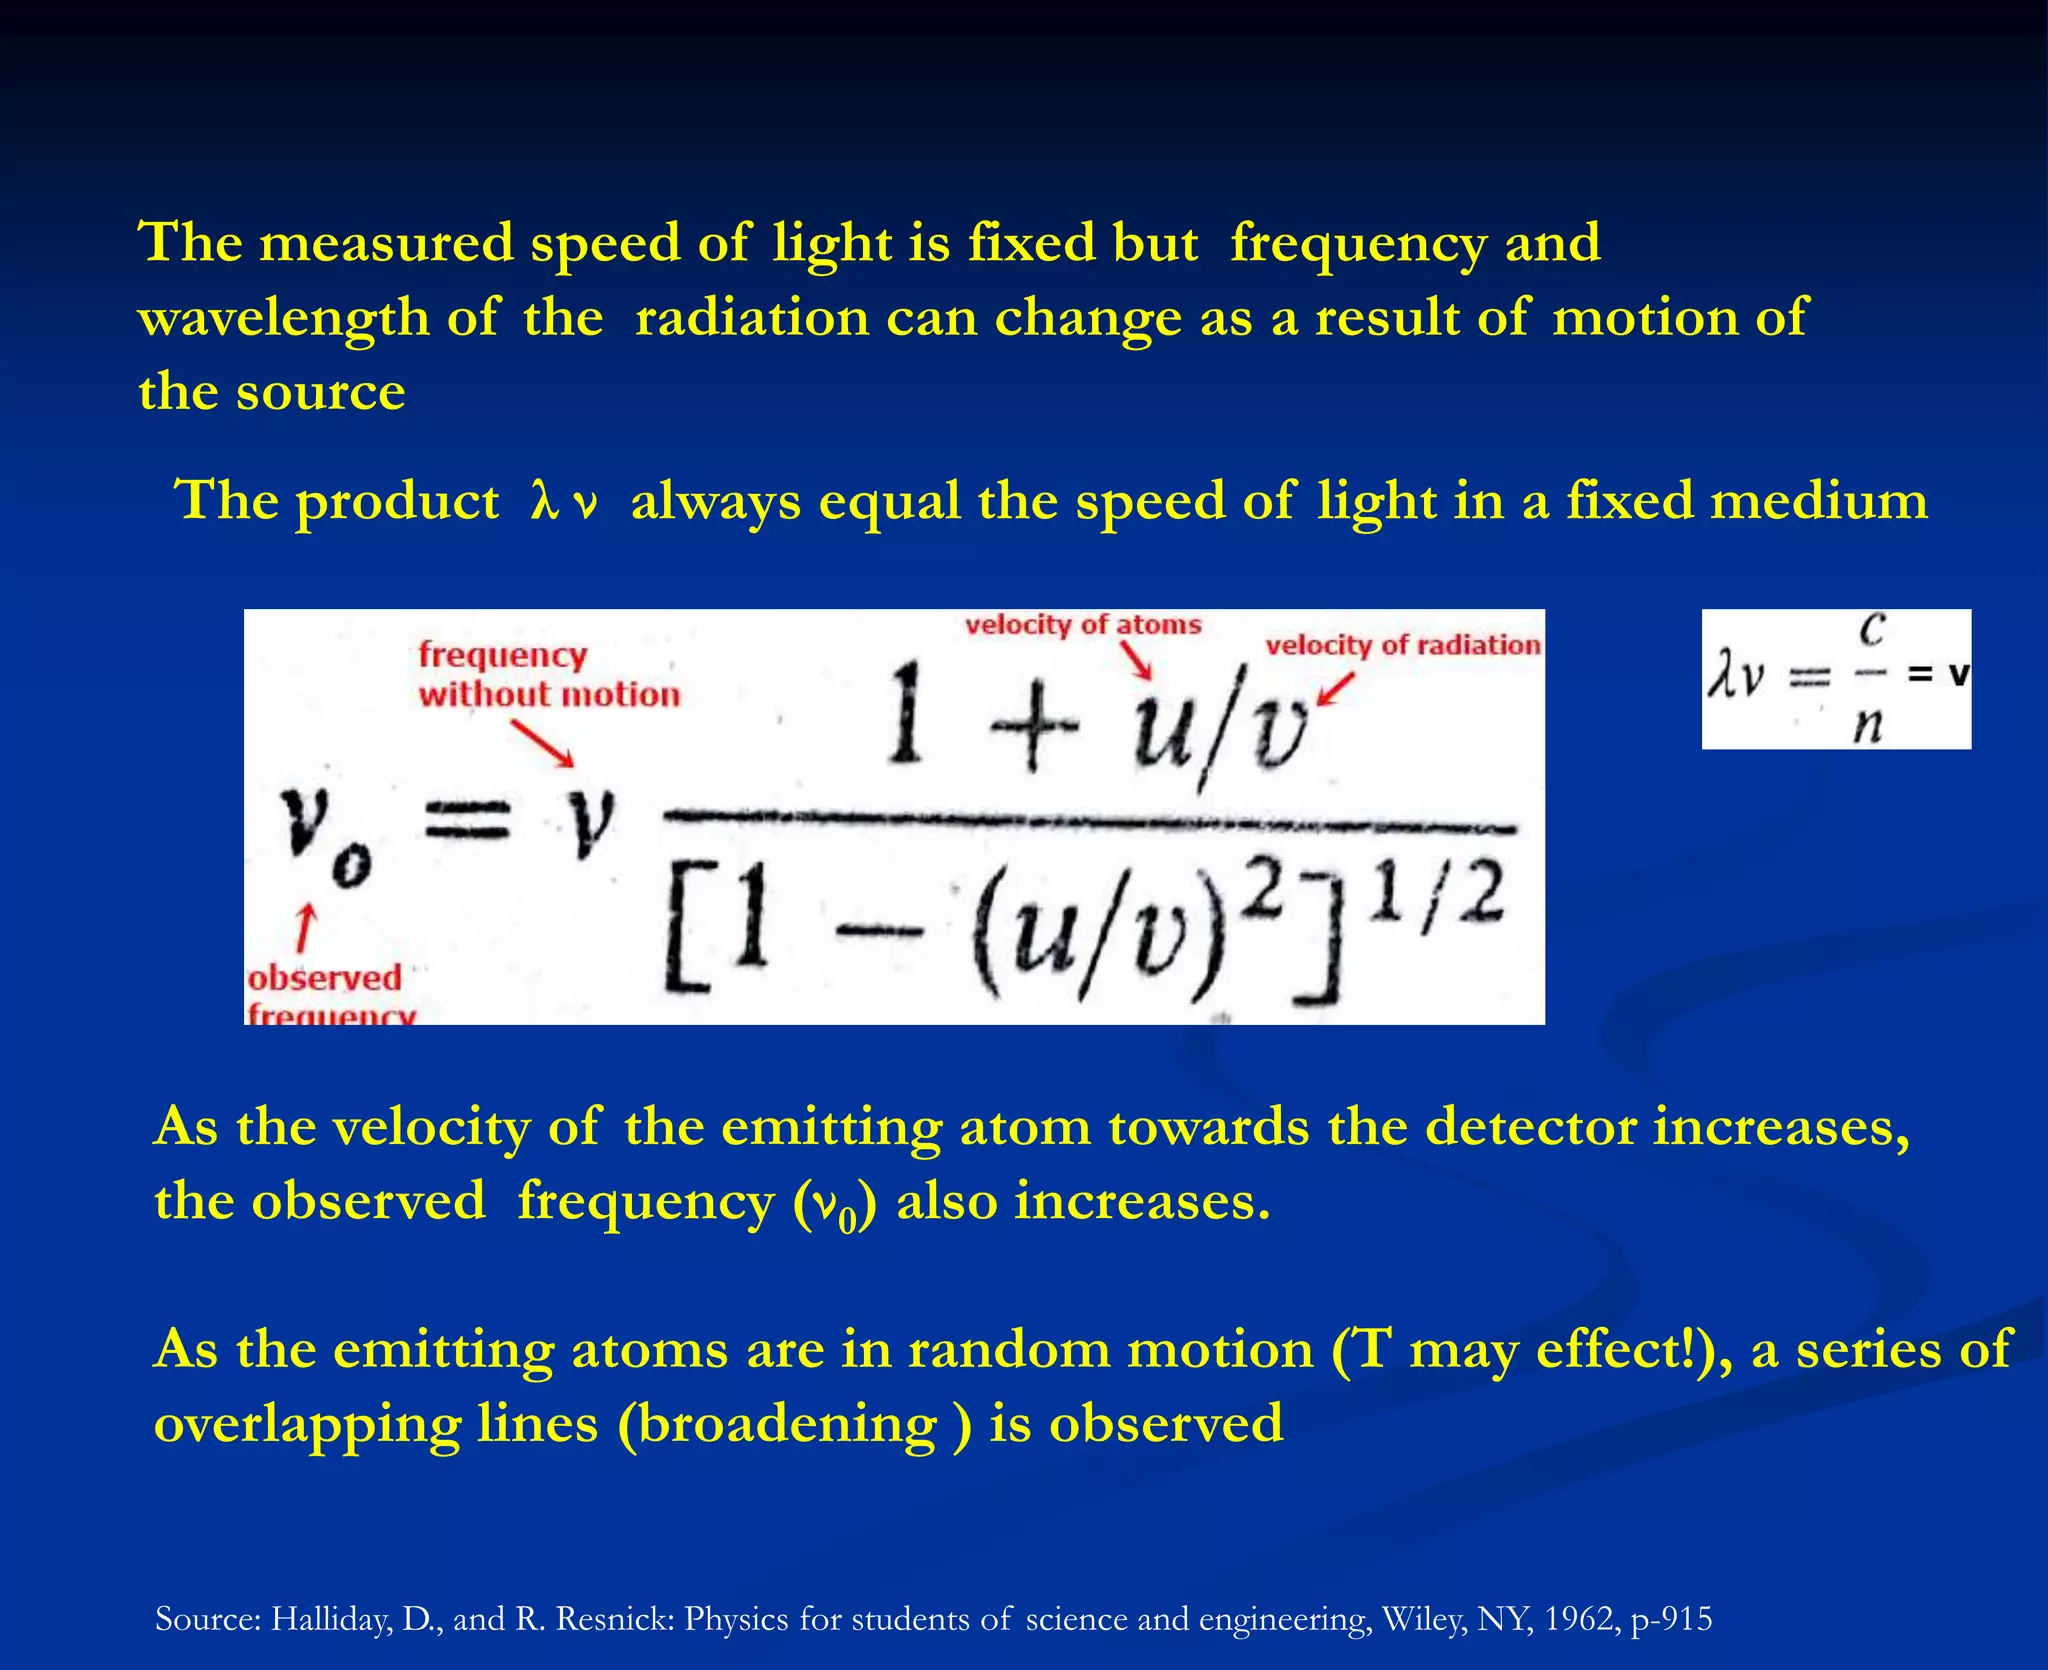
![Sample Problem: pg. 312, #3
Lead is extracted from a sample of blood and analyzed at 283 nm and gave an
absorbance of 0.340 in an AA spectrometer. Using the data provided, graph a
calibration curve and find the concentration of lead ions in the blood sample.
[Pb+2] (ppm) Absorbance Calculated Pb (II) concentraions (ppm) Absorbance
0.000 0.000 0.324 0.340
0.100 0.116
0.200 0.216
0.300 0.310
0.400 0.425
0.500 0.520
y = 1.0505x
R² = 0.9988
0.000
0.100
0.200
0.300
0.400
0.500
0.600
0.000 0.100 0.200 0.300 0.400 0.500 0.600
Absorbance
[Pb+2] (ppm)
Lead (II) Calibration Curve
• The data provided
in the problem
appears in the
upper left hand
corner of this MS
EXCEL worksheet.
• The graph was
used to calculate
the best fit line.
• The equation was
then used to
calculate the
concentration of
Pb (II) ions with an
absorbance of
0.340.
• The result, 0.324
ppm, is displayed
above the graph.](https://image.slidesharecdn.com/aas-drsajjad-190127110121/75/Atomic-Absorption-Spectroscopy-AAS-106-2048.jpg)


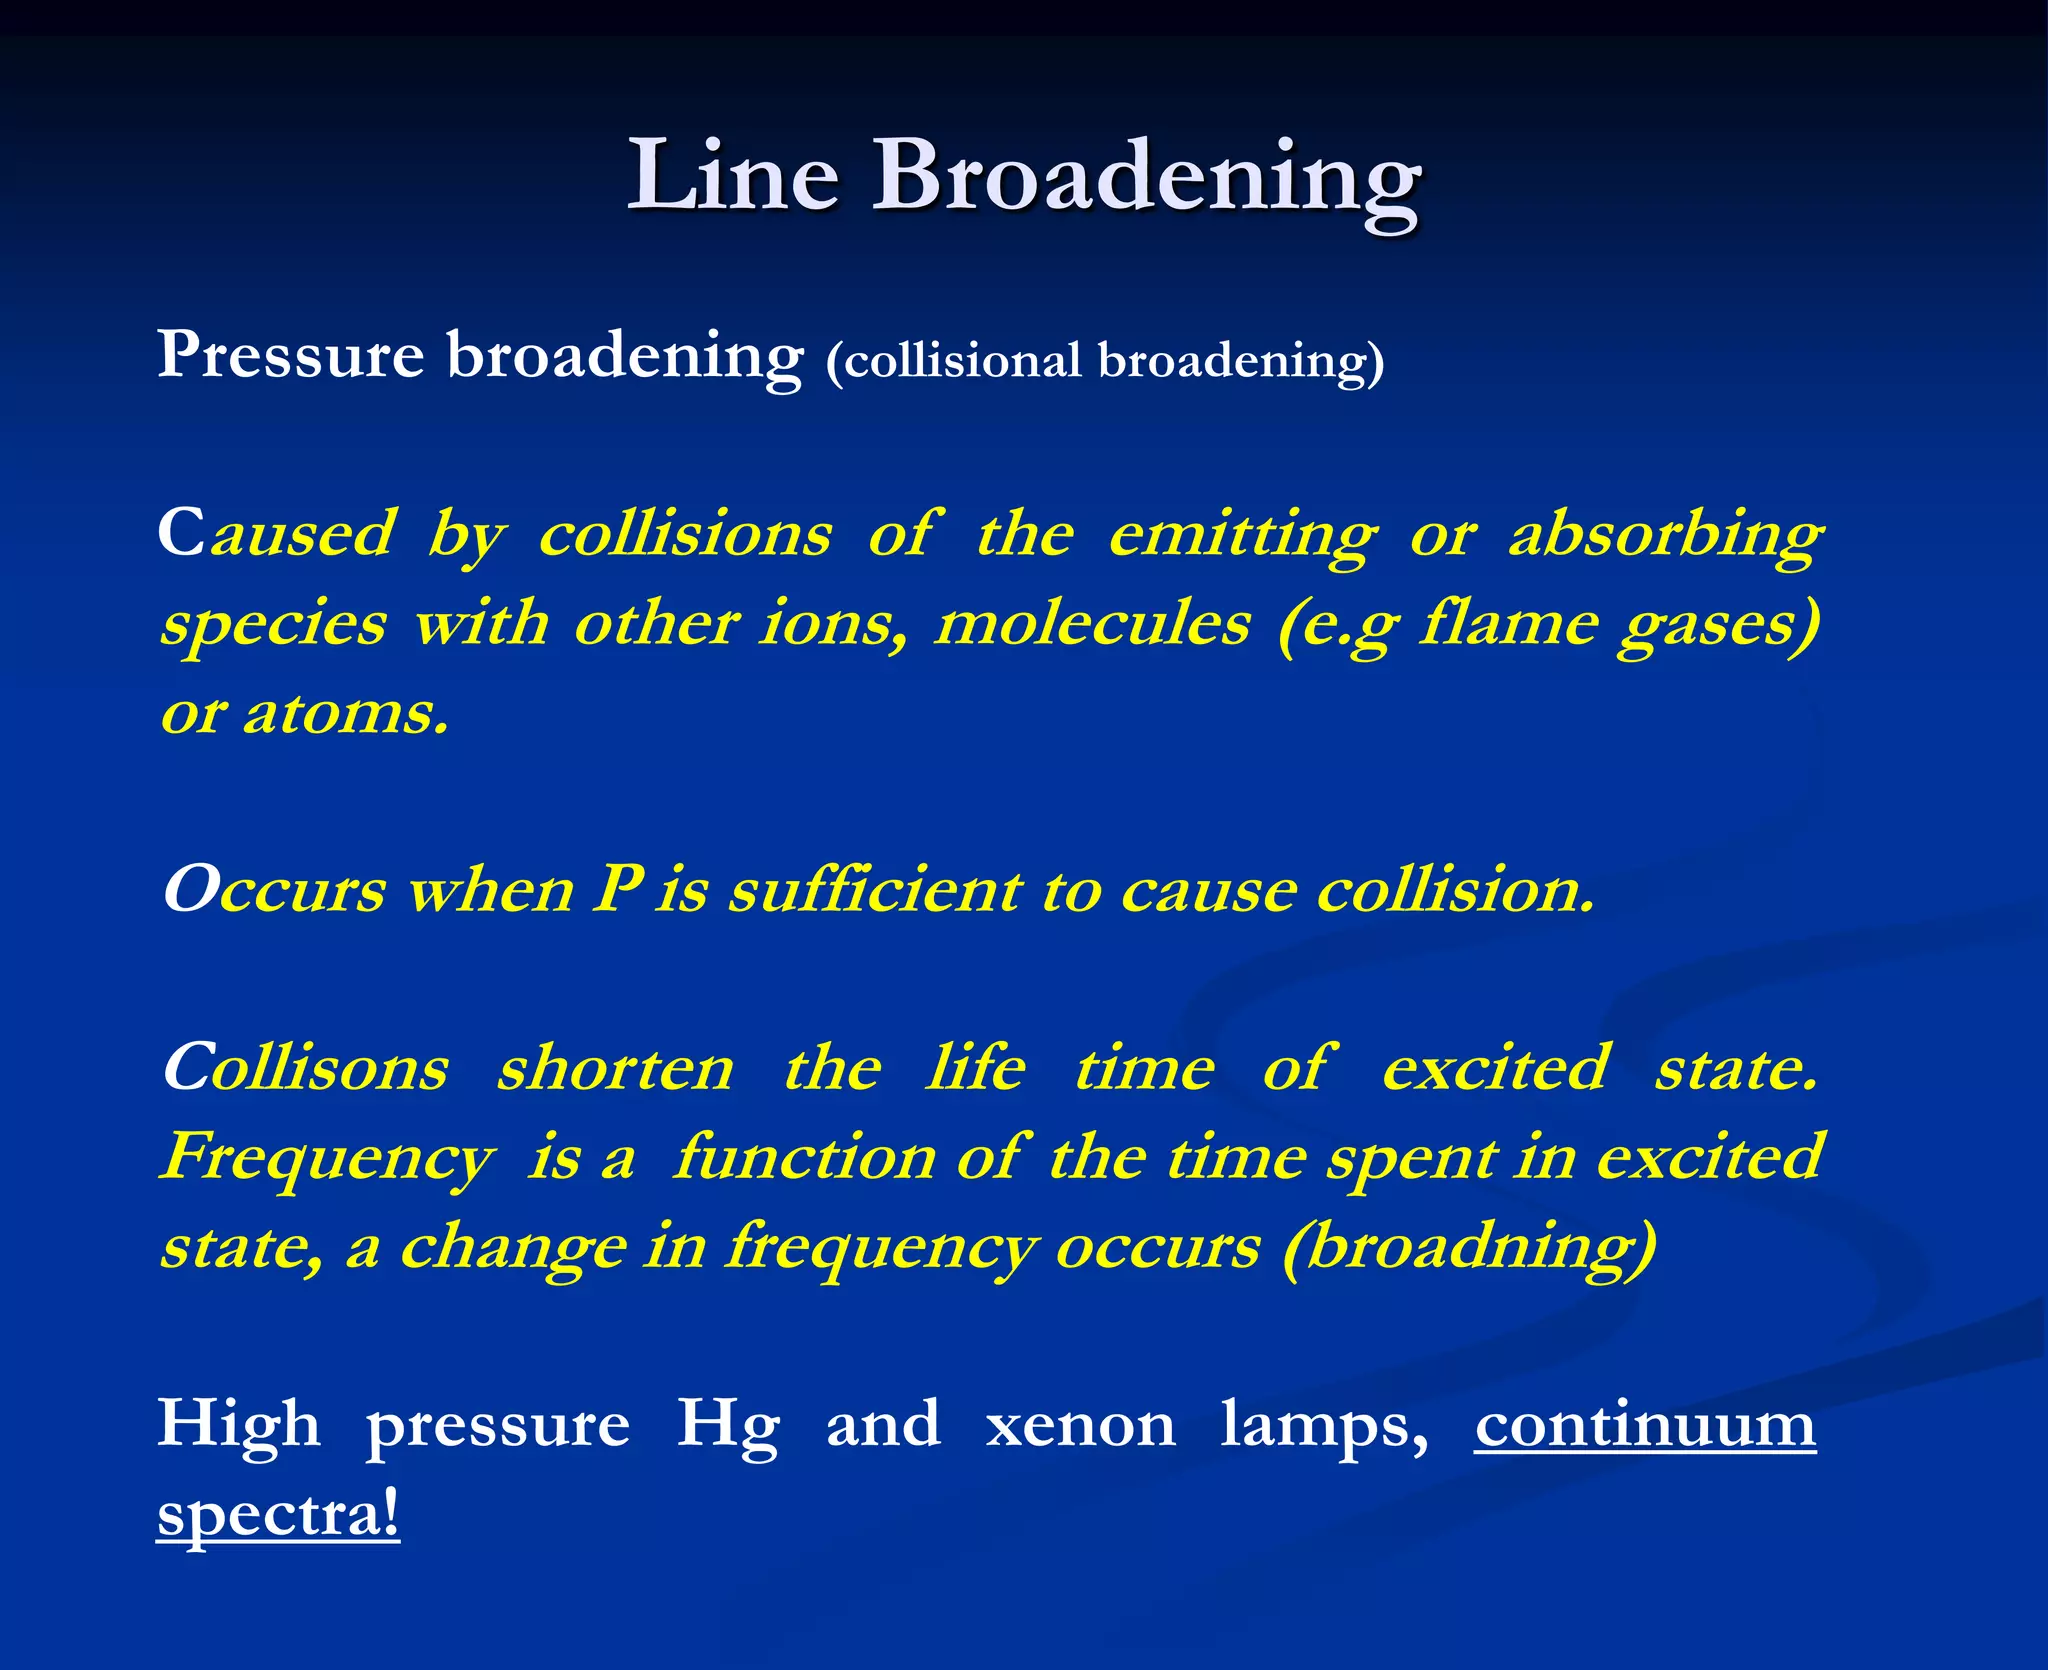
![…Chemical Interferences continued…
(III) Ionization Equilibria: Ionization of
atoms and molecules is small in combustion
mixtures that involve air as the oxidant, and
generally can be neglected. In higher
temperatures of flames where oxygen or nitrous
oxide serves as the oxidant, however, ionization
becomes important, and a significant
concentration of free electrons exists as a
consequence of the equilibrium
M M+ + e-
The equilibrium constant K for this reaction
takes the form
K= [M+][e-]](https://image.slidesharecdn.com/aas-drsajjad-190127110121/75/Atomic-Absorption-Spectroscopy-AAS-129-2048.jpg)

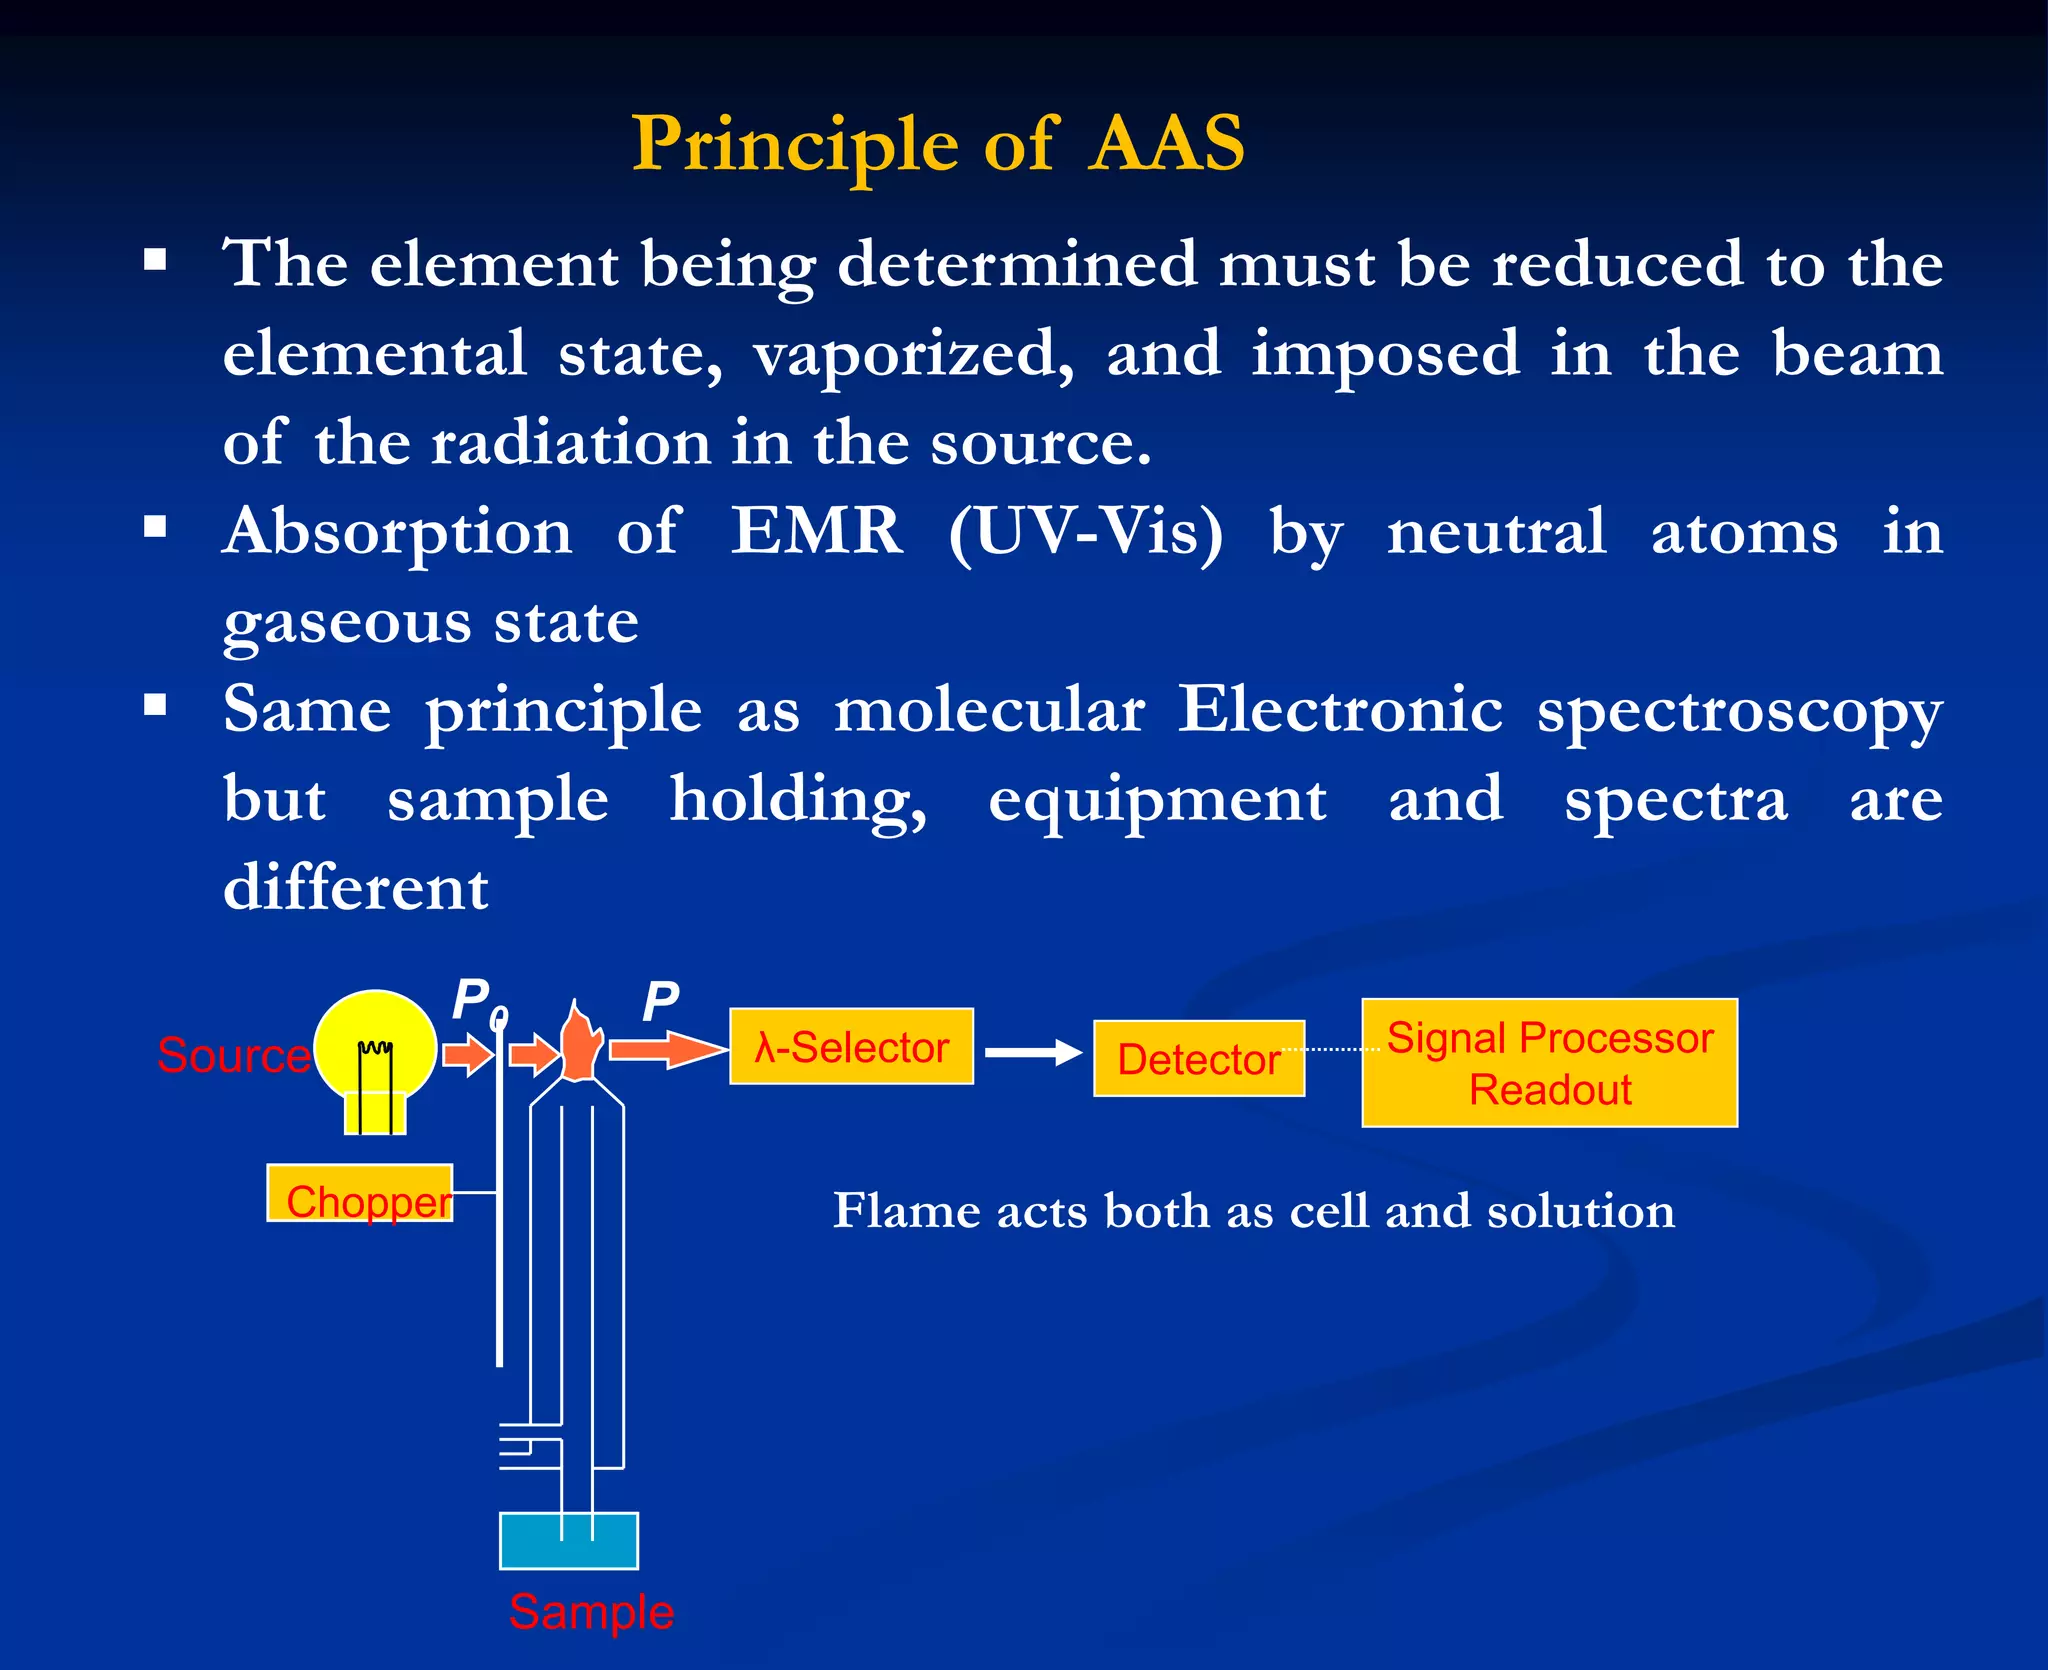
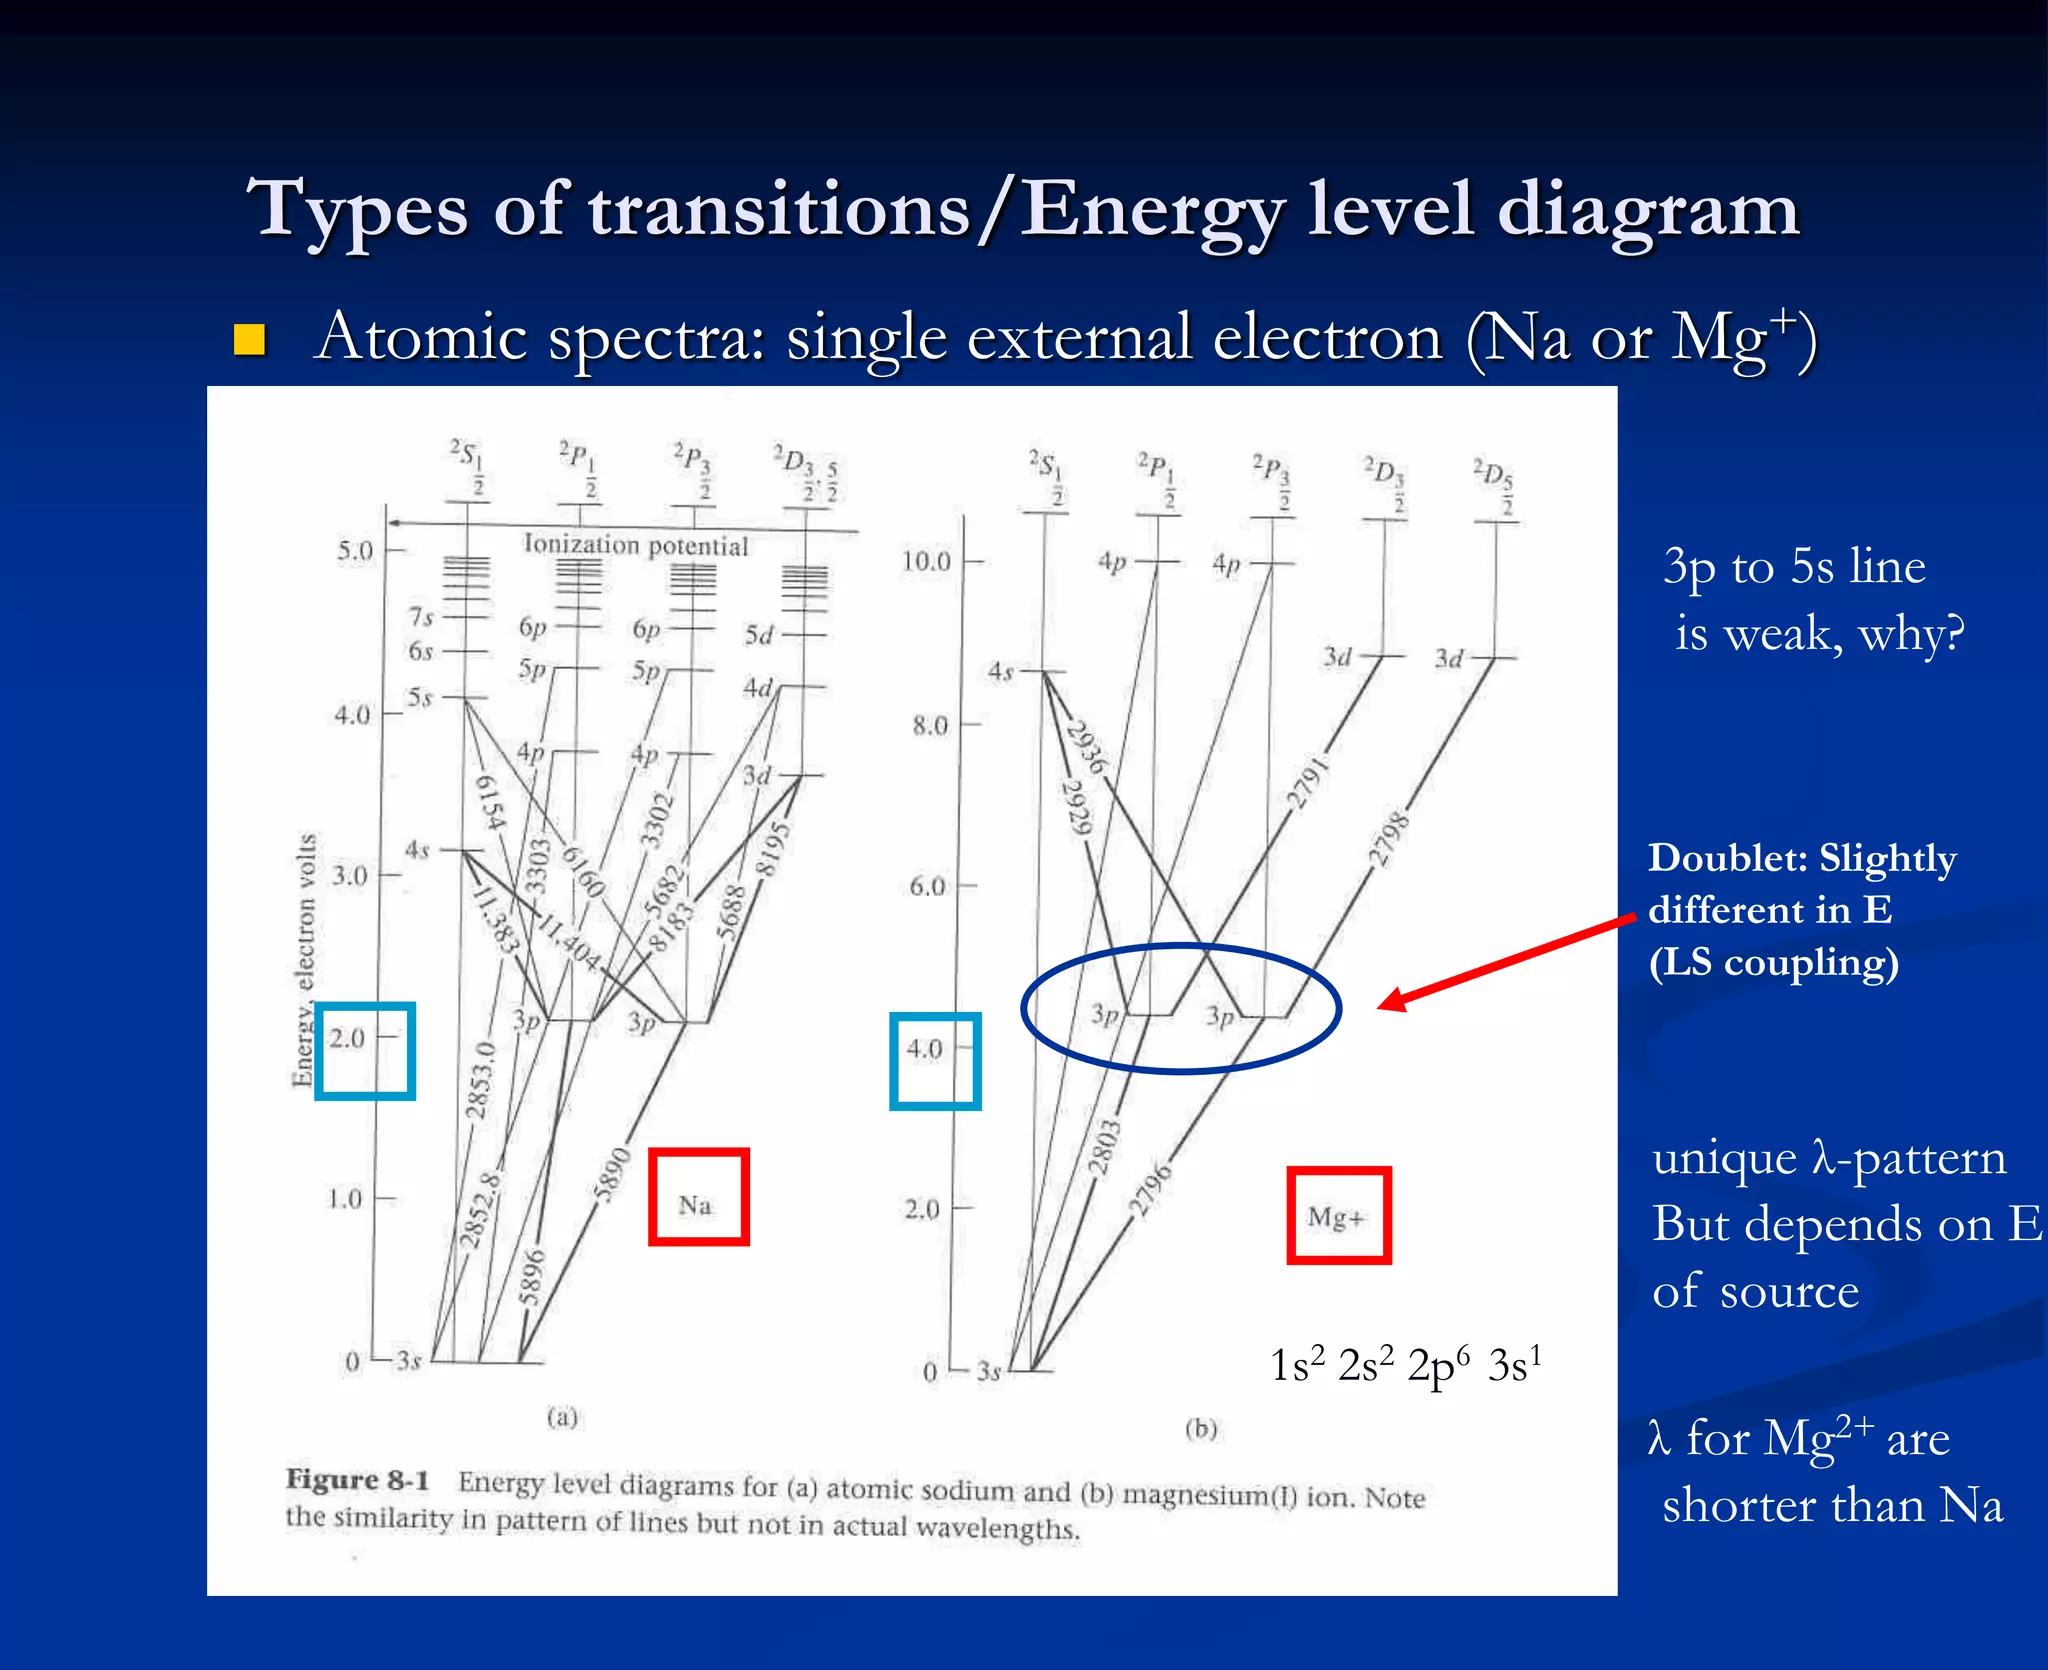
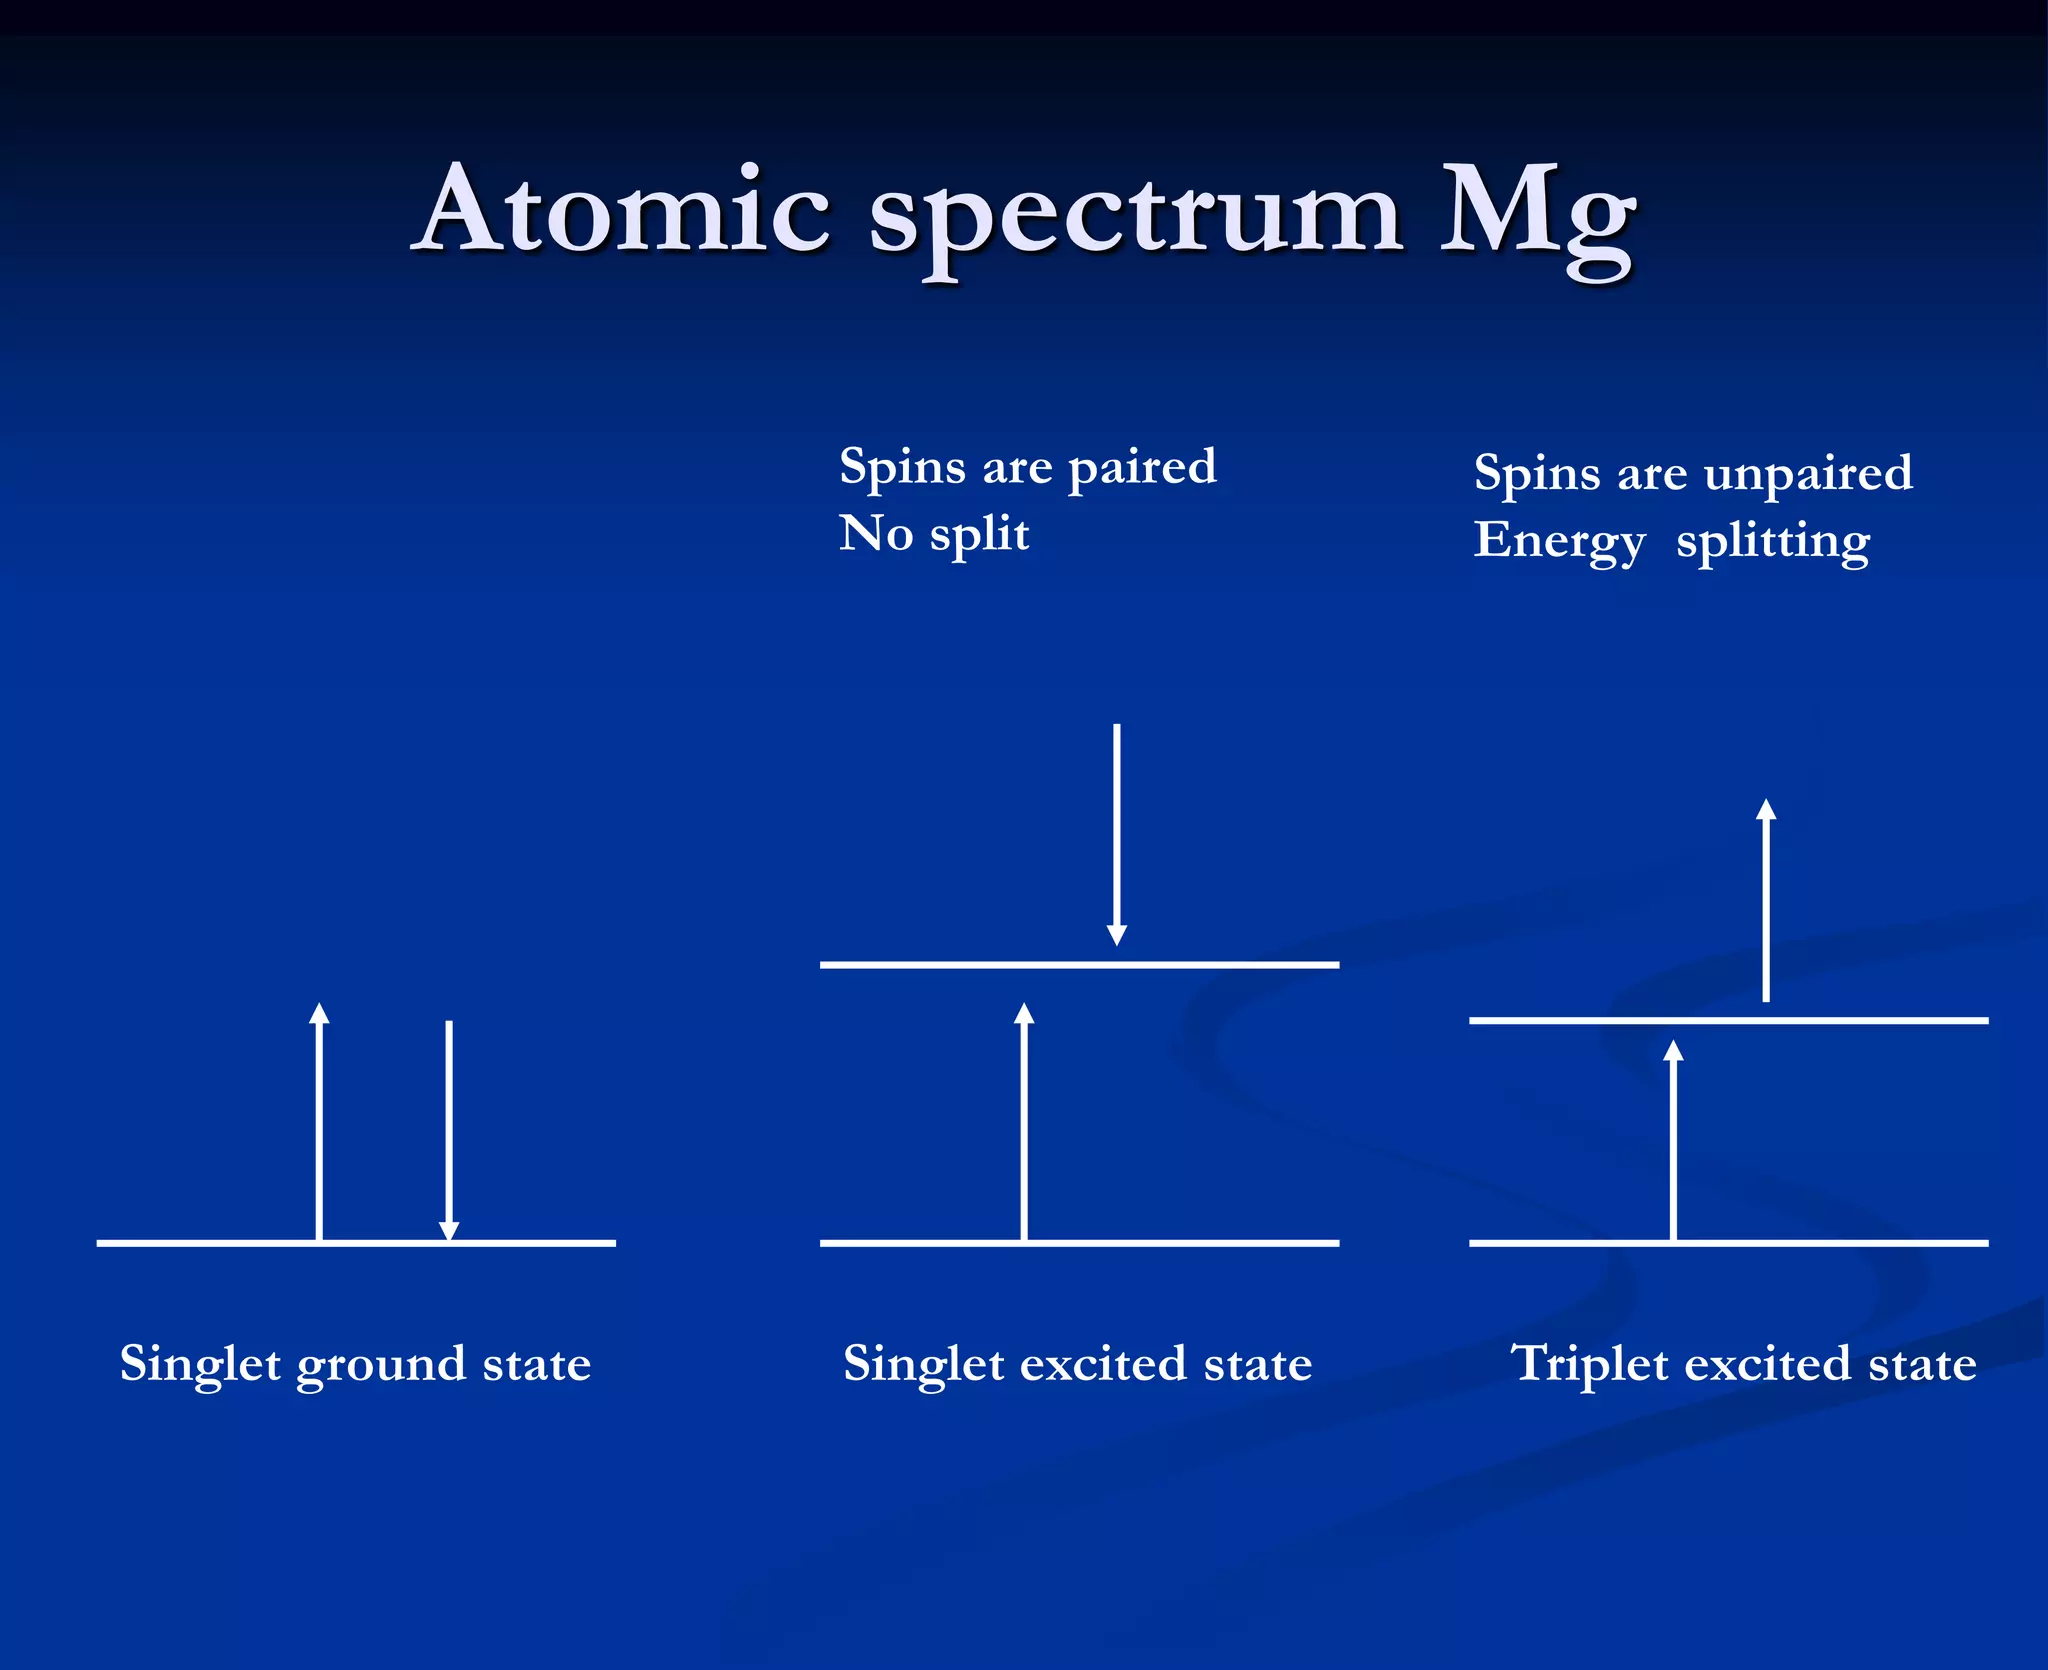
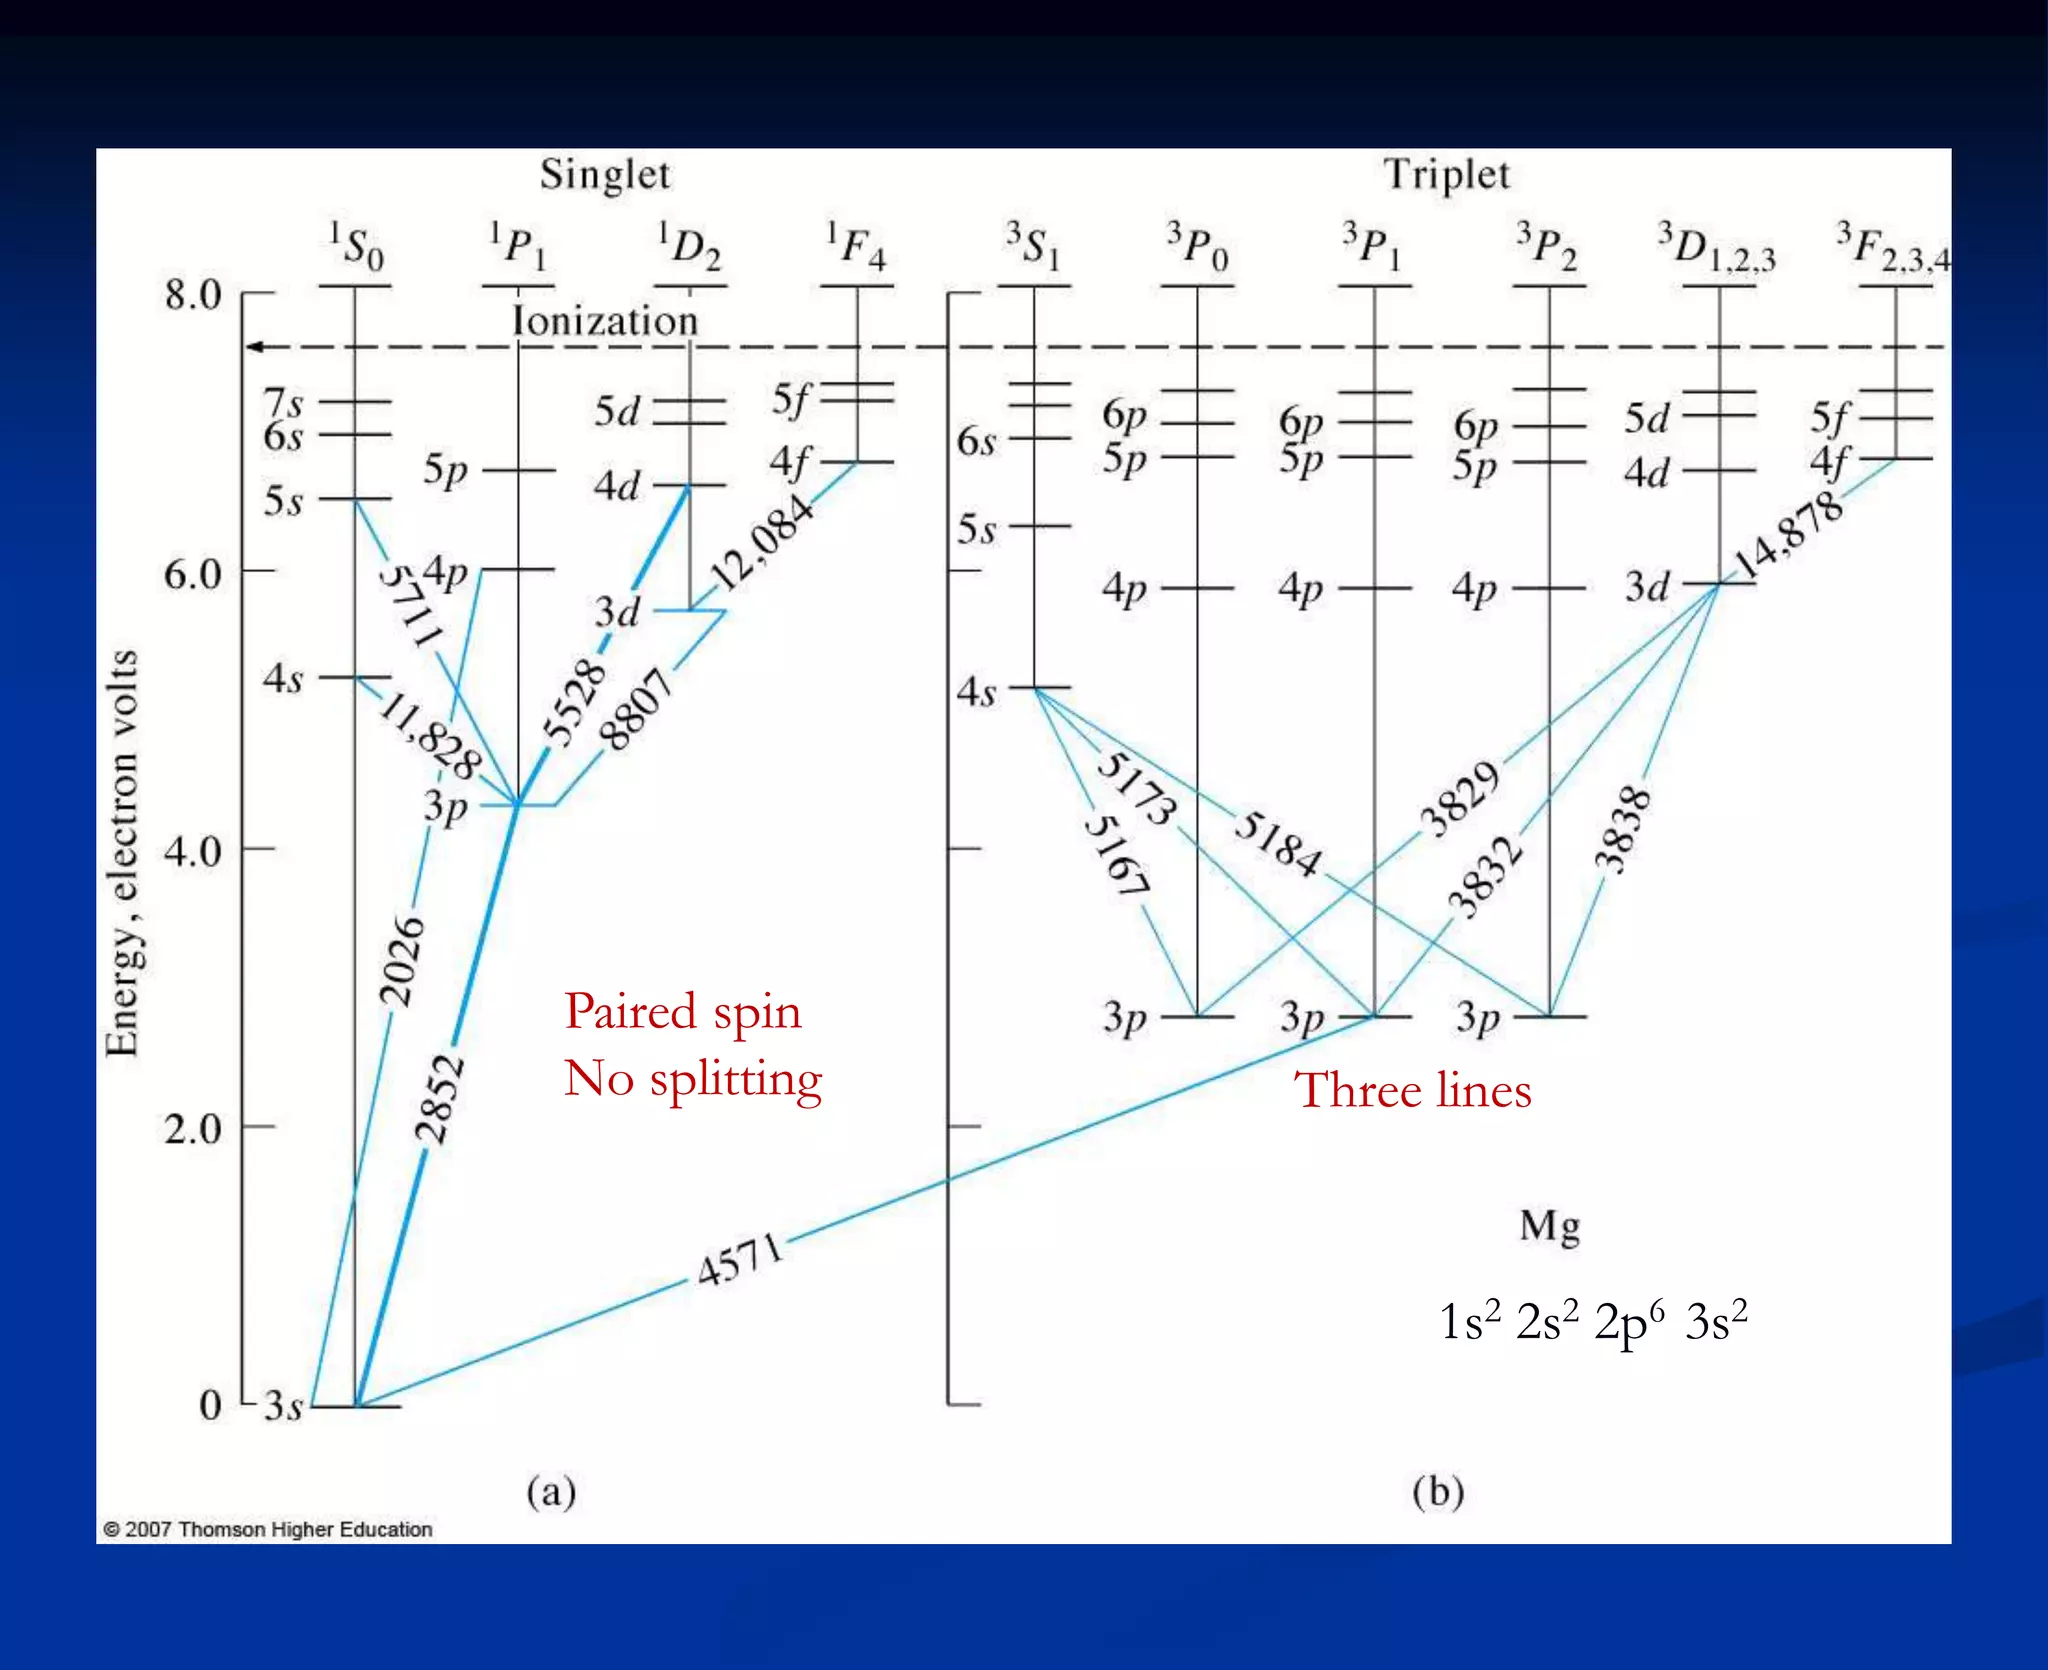
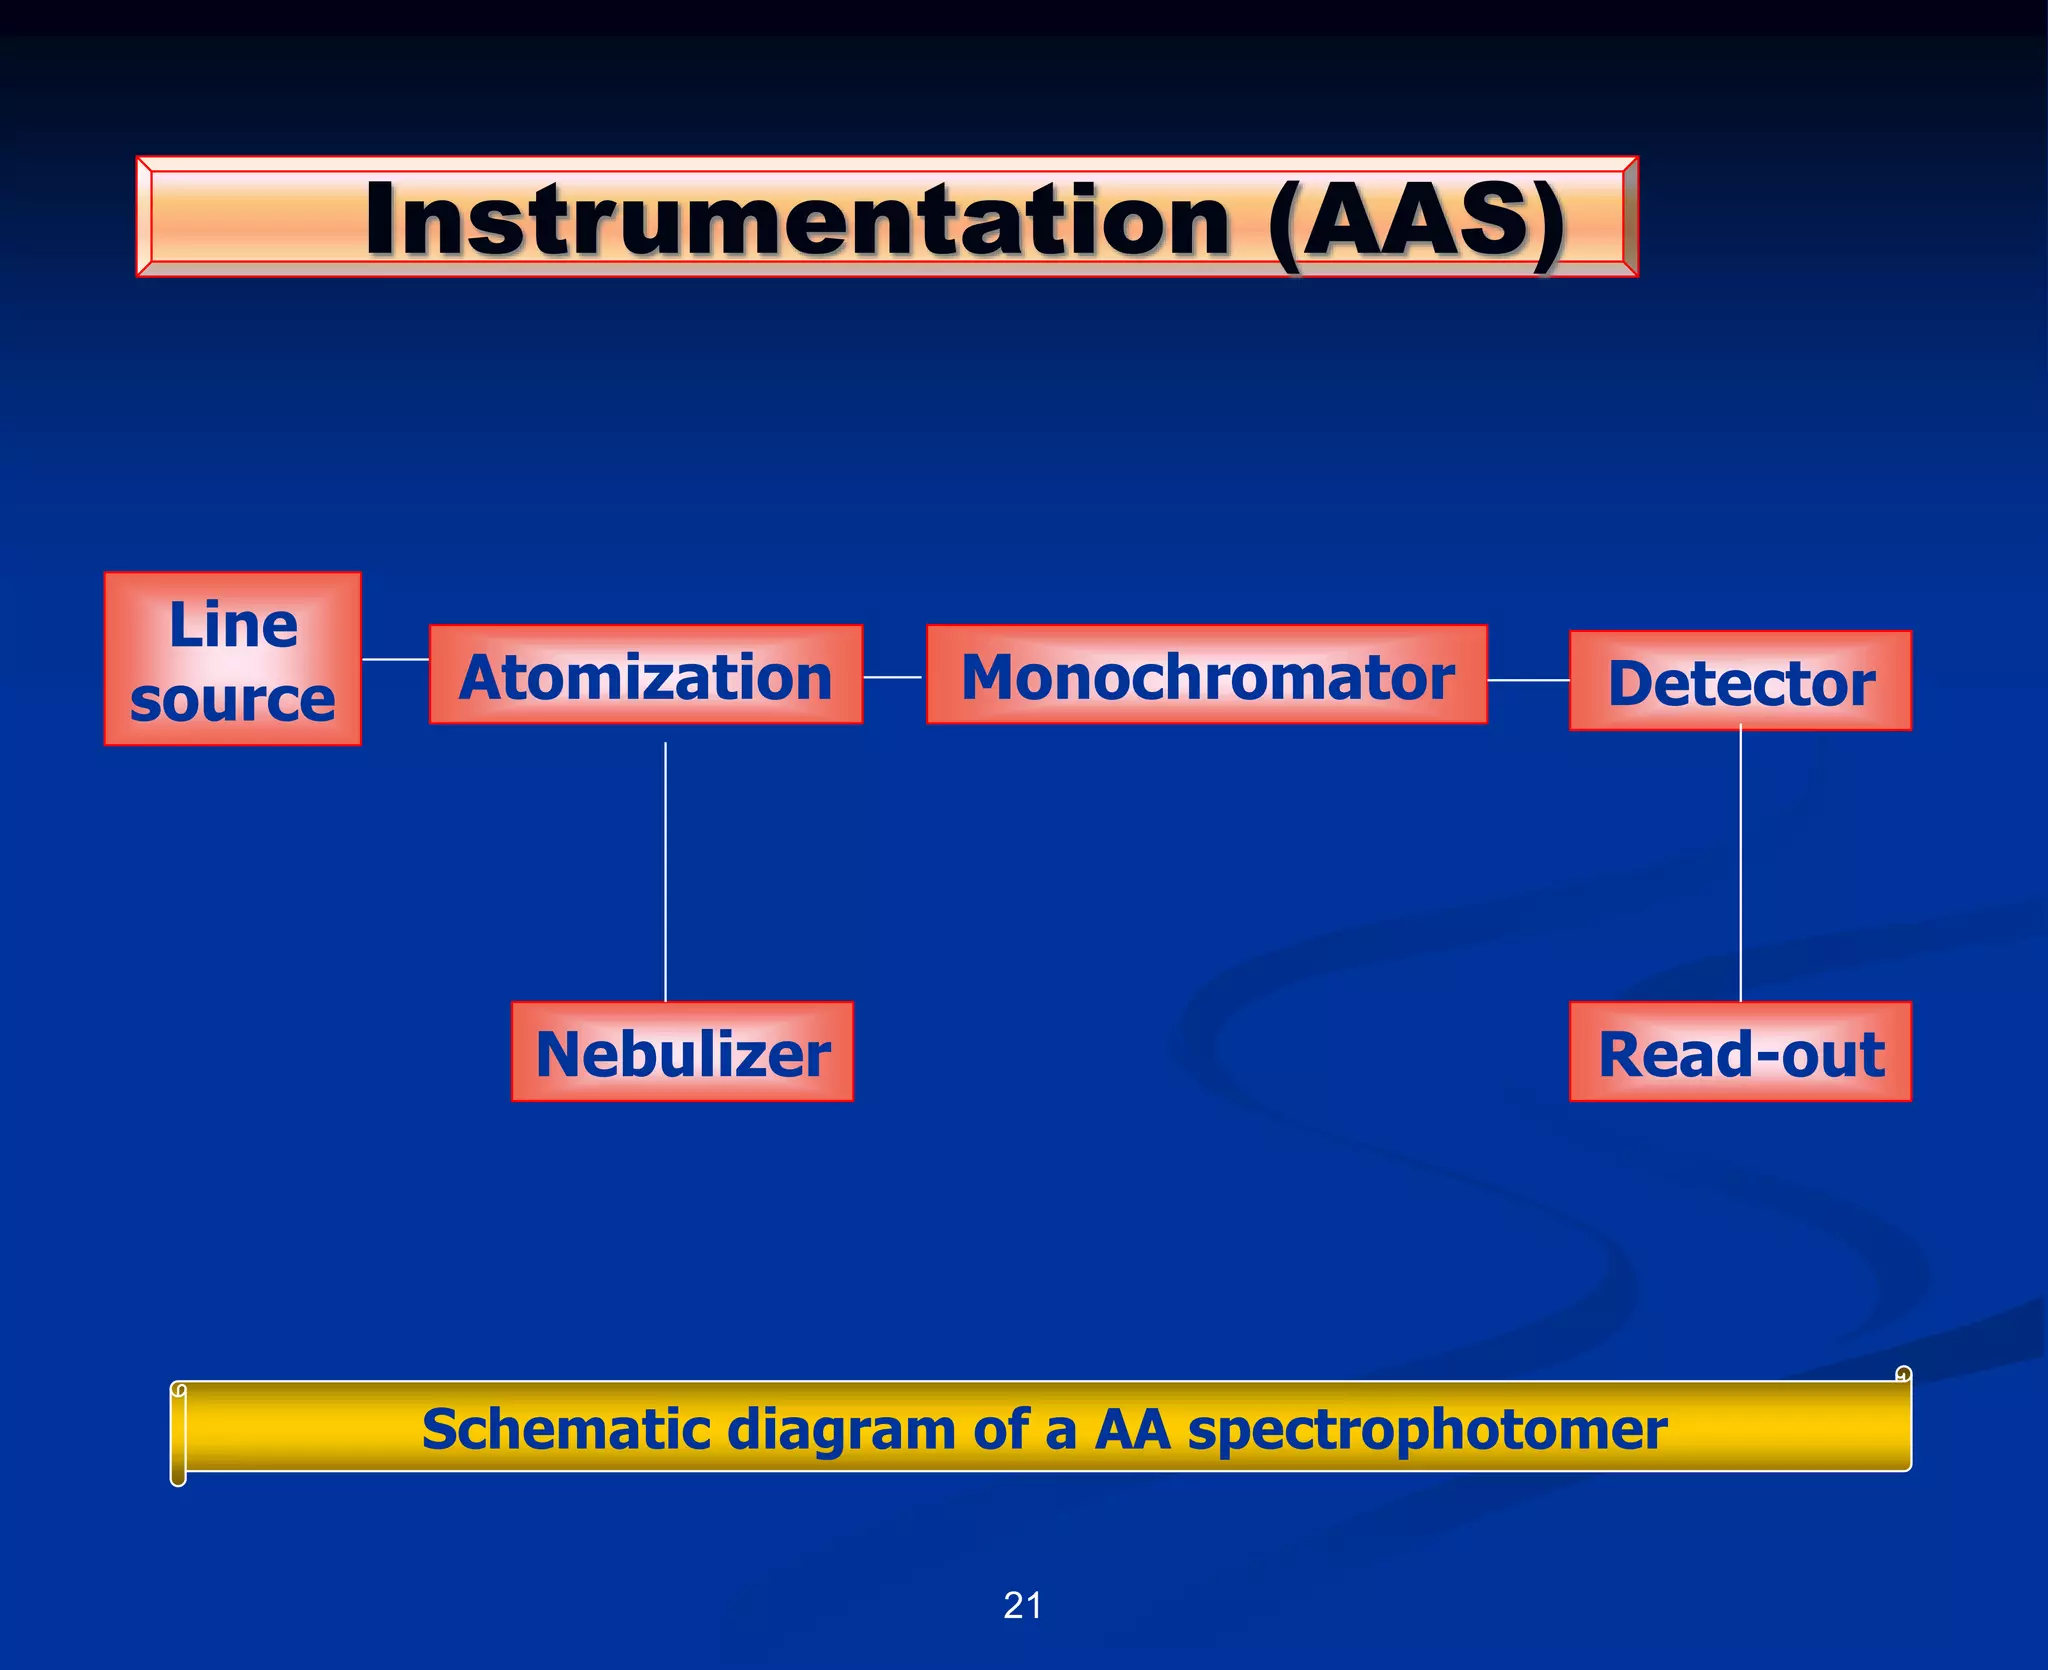
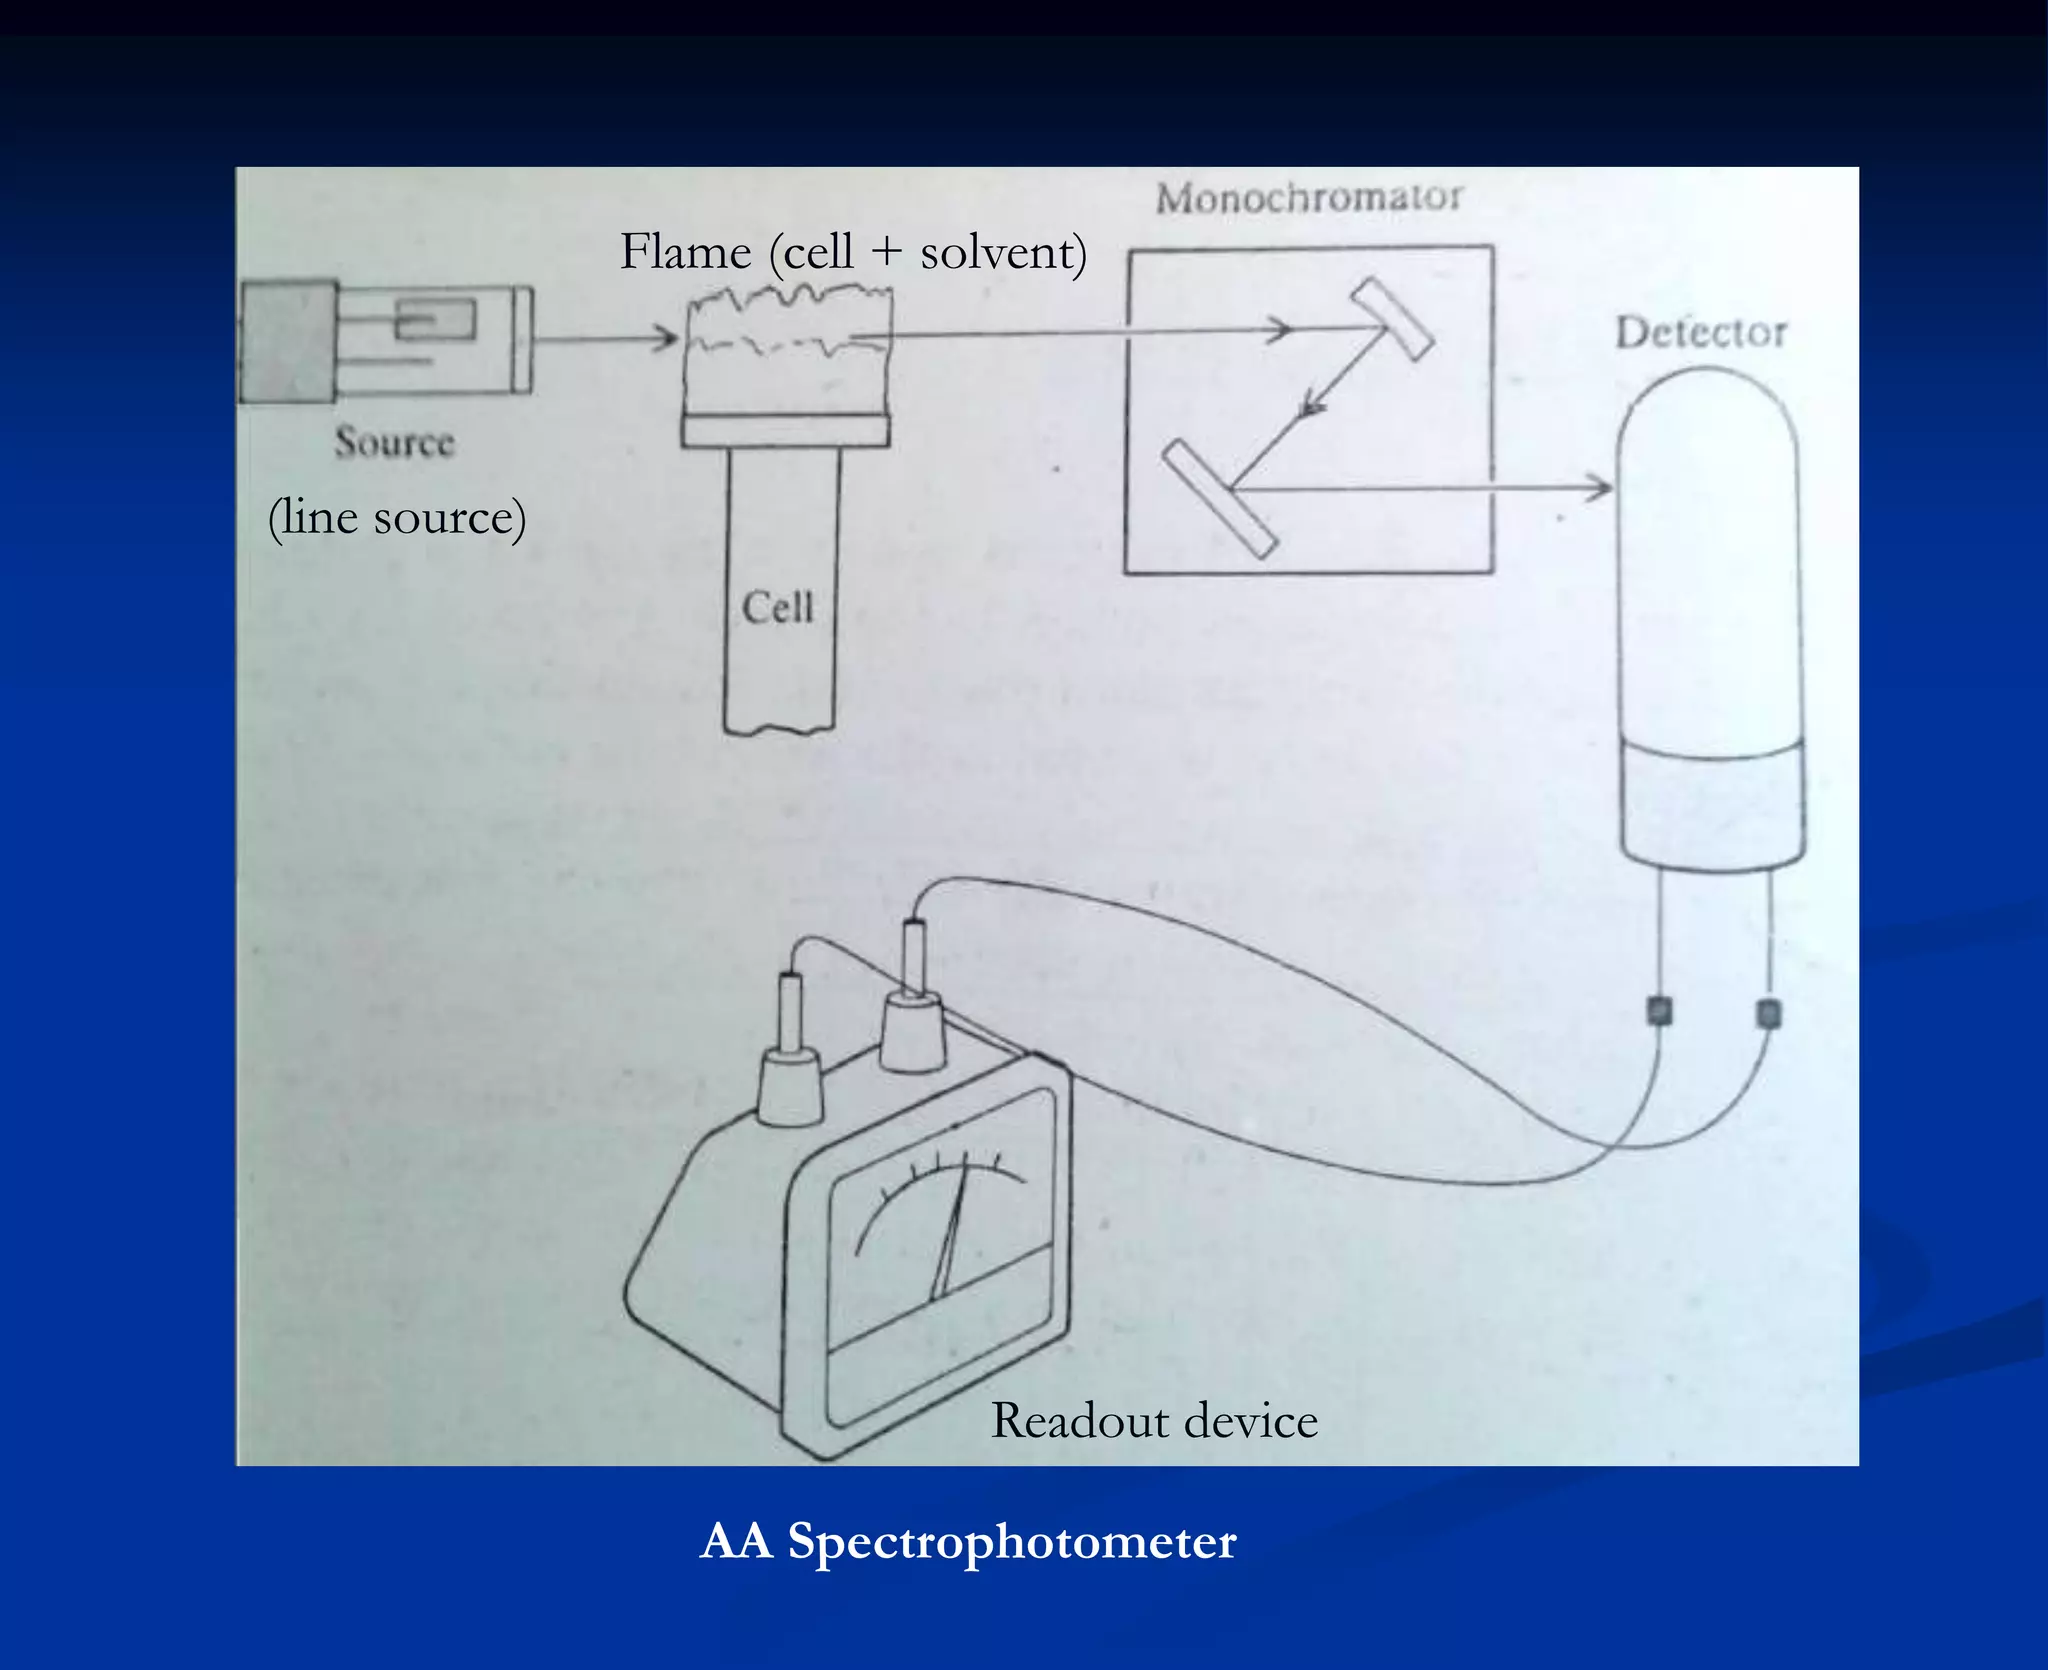
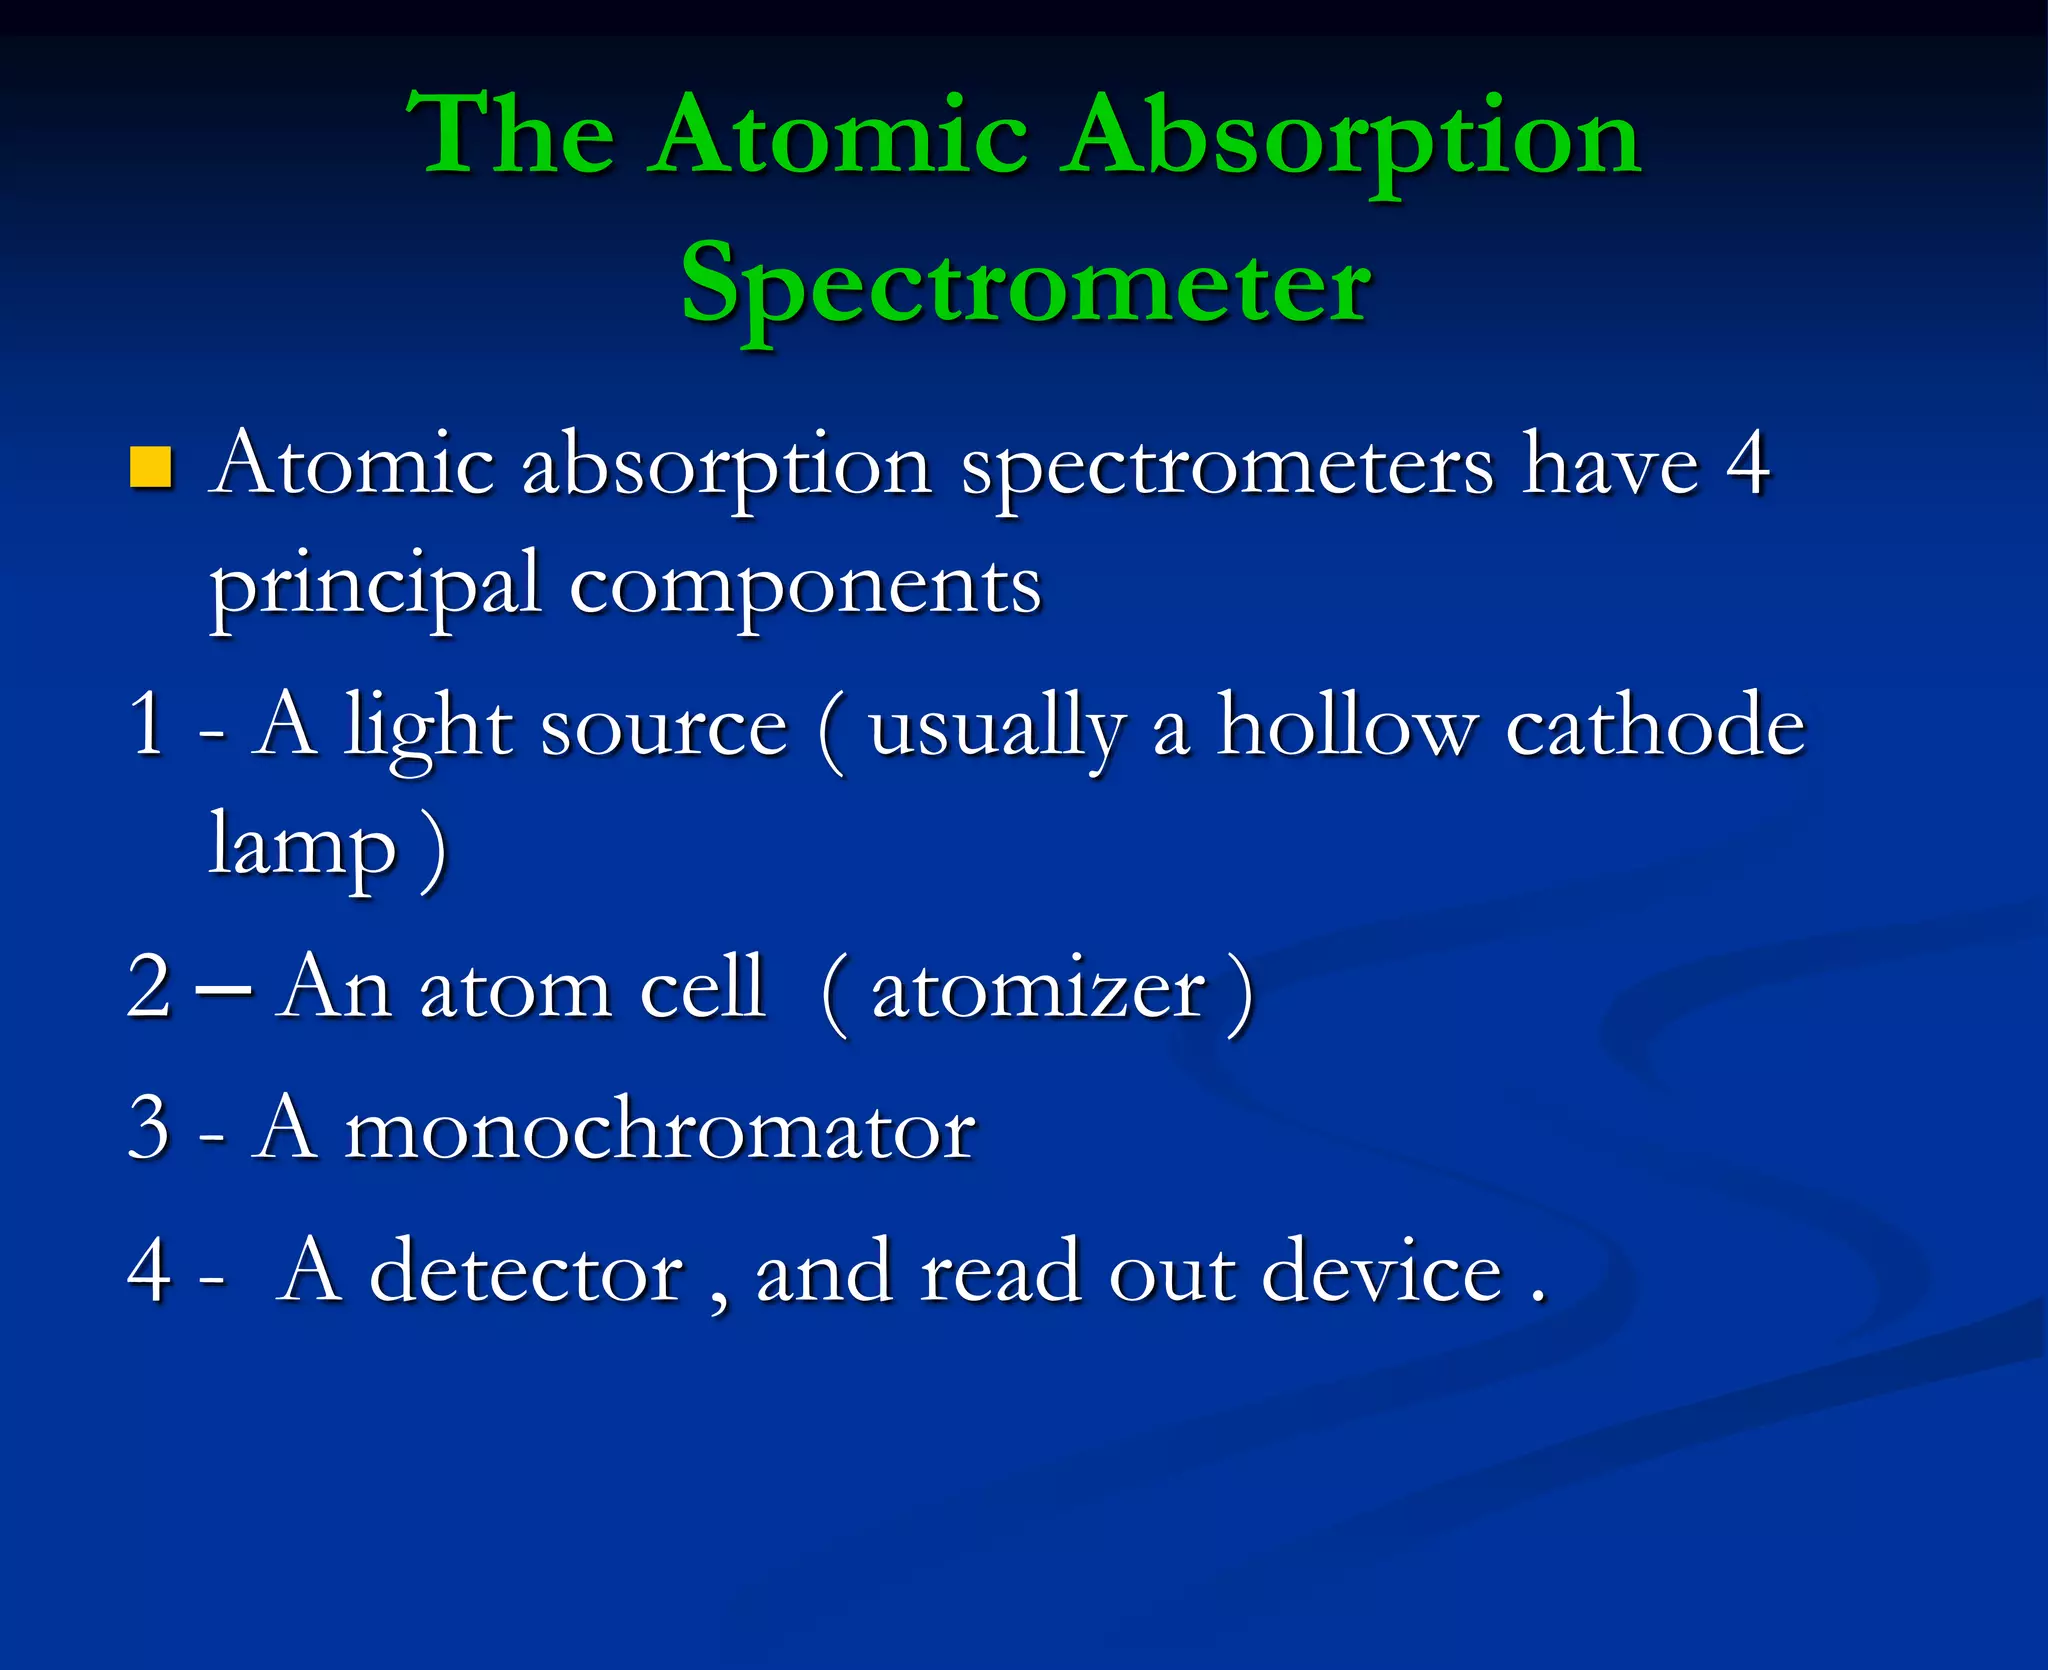
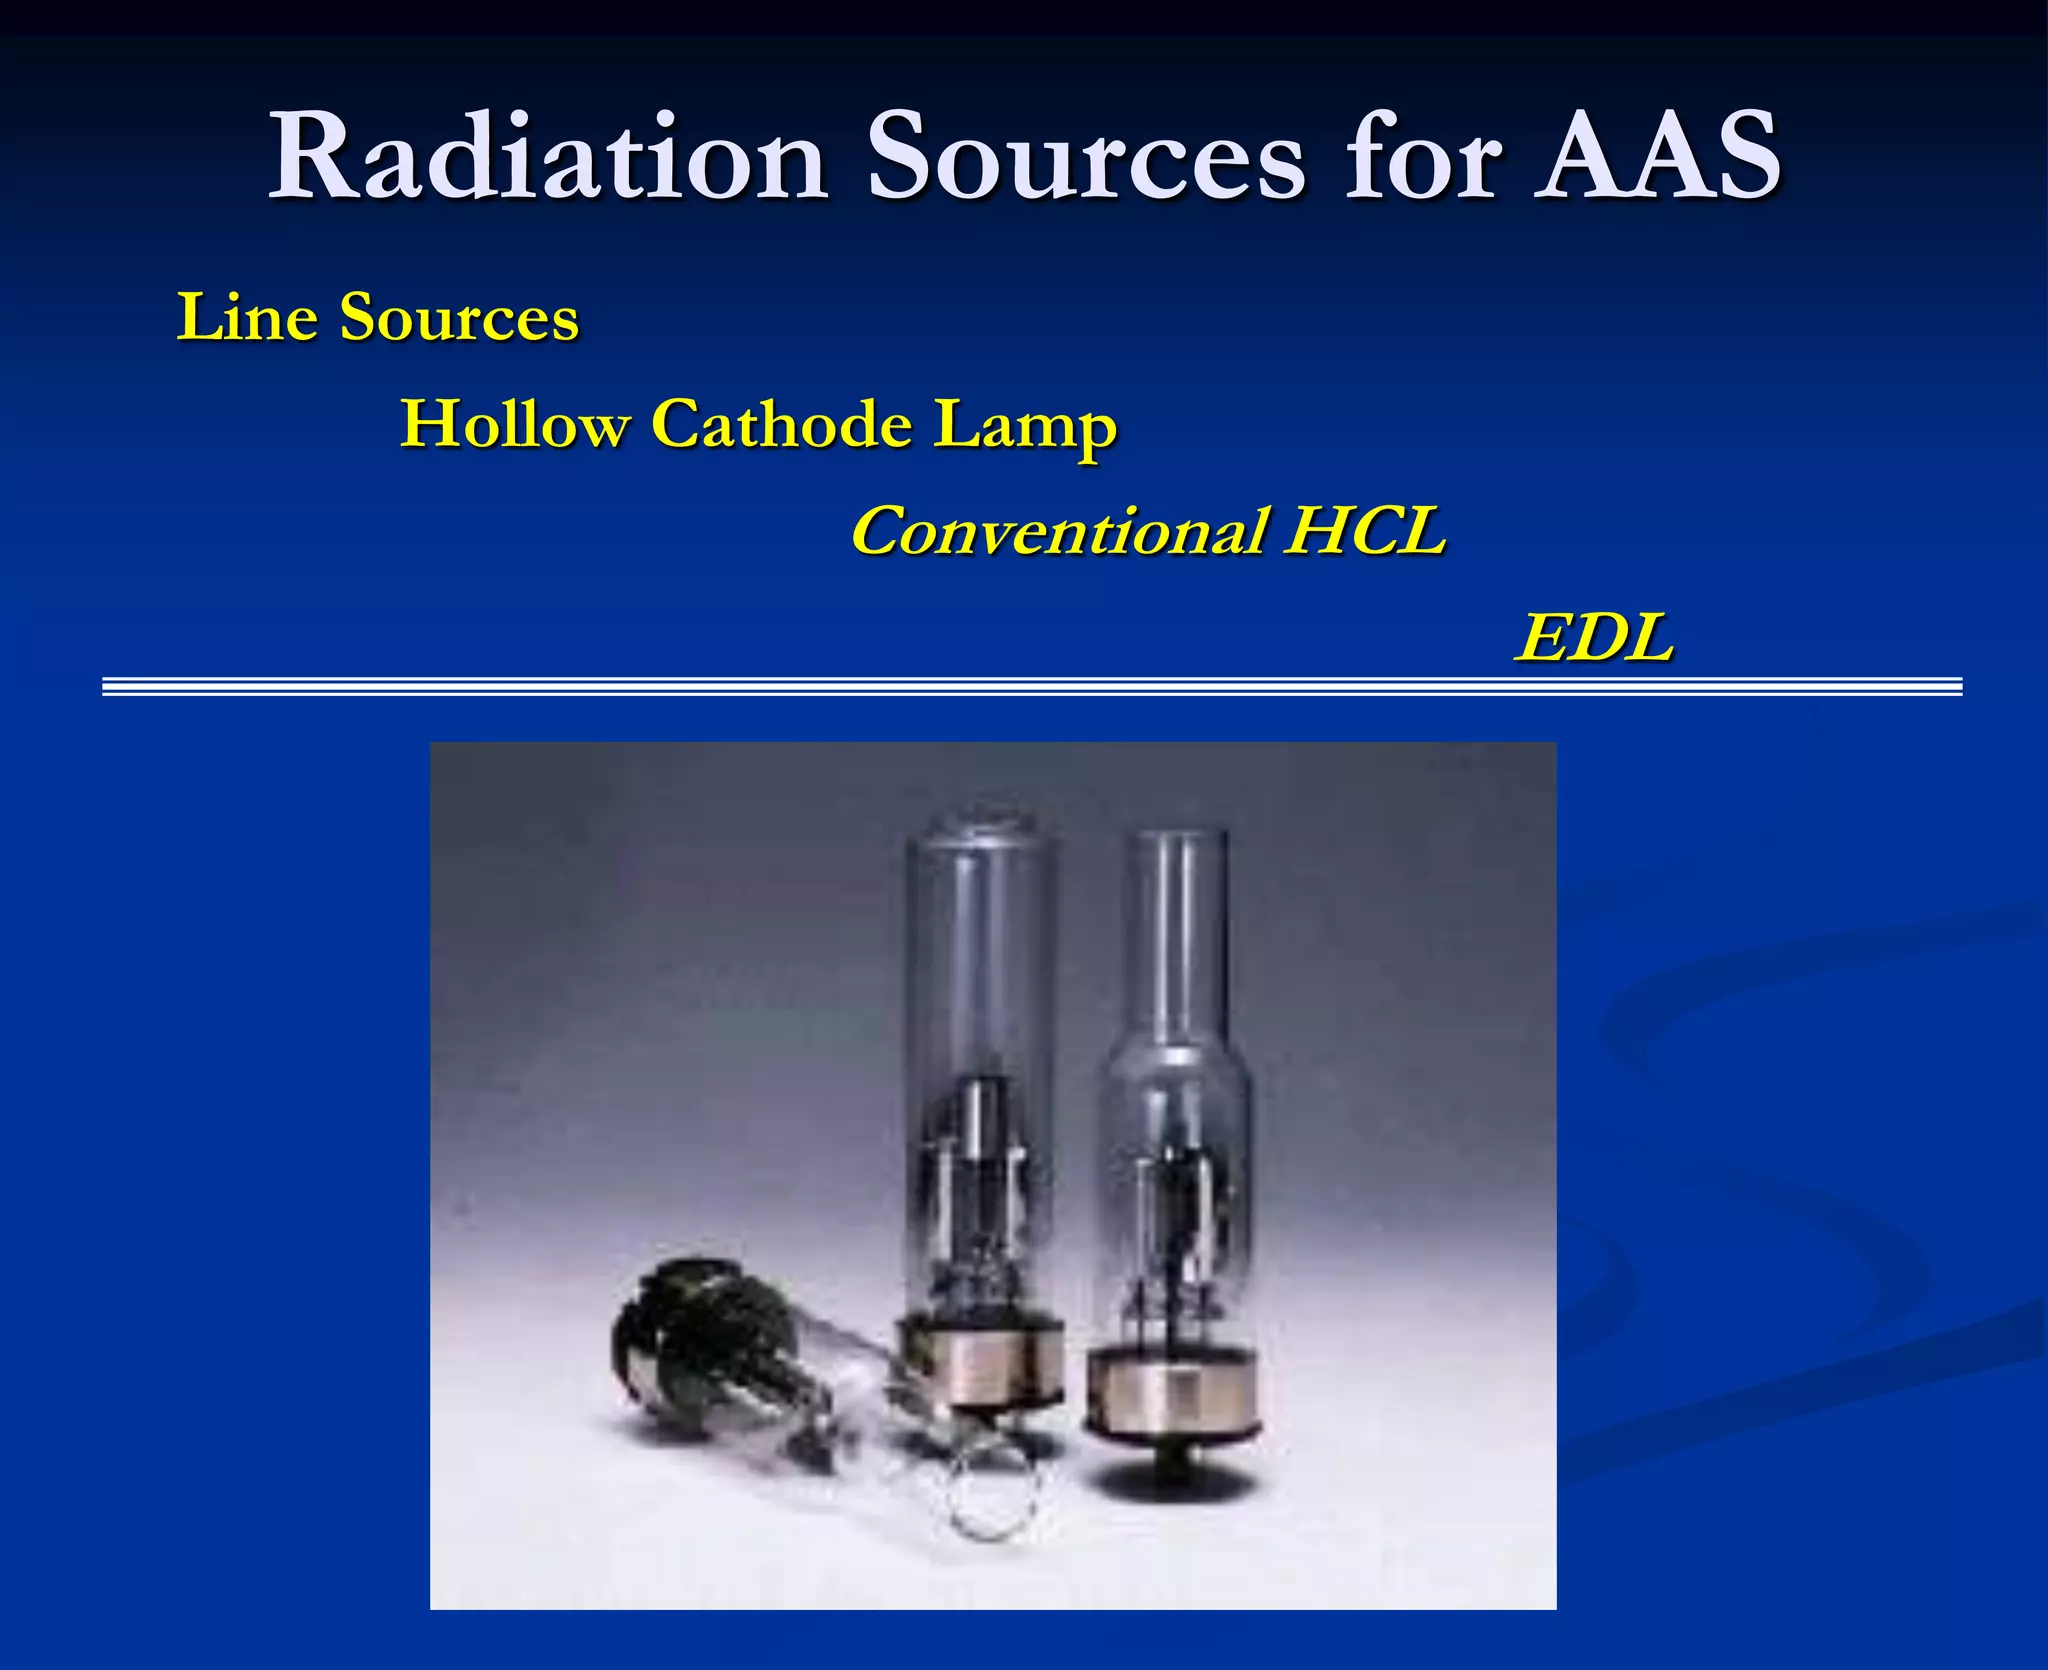
The document provides an extensive overview of atomic spectroscopy, focusing on techniques like atomic absorption spectroscopy (AAS) and atomic emission spectroscopy (AES). It details the principles of operation, including the role of light sources such as hollow cathode lamps, and explains the effects of temperature, excitation states, and line broadening on measurement accuracy. Furthermore, it discusses various atomization methods, nebulizers, and burners used in the process, along with specific considerations for flame types and sample introduction in spectroscopy applications.


