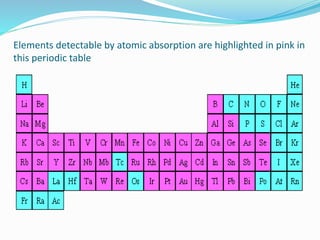
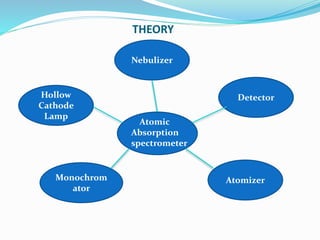
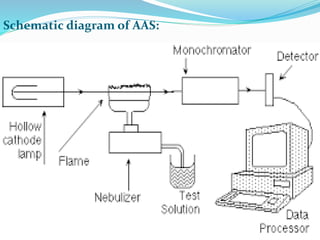
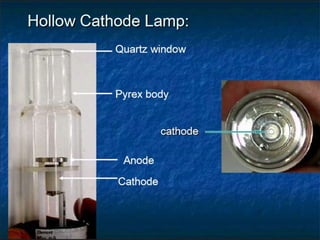
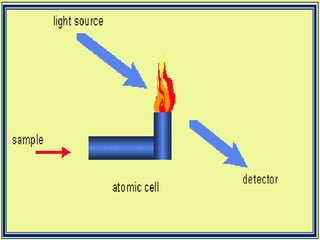
PRESENTATION ON
PRESENTED BY:
SWATI
FRM-MA-09-10
ATOMIC ABSORPTION SPECTROSCOPY:
PRINCIPLE,THEORY,INSTRUMENTATION &
APPLICATION
CONTENTS
 Principle
 Theory
 Instrumentation
 Applications
INTRODUCTION
 Atomic Absorption Spectroscopy is a very common
technique for detecting metals and metalloids in
samples.
 It is very reliable and simple to use.
 It can analyze over 62 elements.
 It also measures the concentration of metals in the
sample.
HISTORY
 The first atomic absorption spectrometer was built by
CSIRO scientist Alan Walsh in 1954.Shown in the picture
Alan Walsh(left), with a spectrometer.
Elements detectable by atomic absorption are highlighted in pink in
this periodic table
PRINCIPLE
 The technique uses basically the principle that free atoms
(gas) generated in an atomizer can absorb radiation at
specific frequency.
 Atomic-absorption spectroscopy quantifies the
absorption of ground state atoms in the gaseous state .
 The atoms absorb ultraviolet or visible light and make
transitions to higher electronic energy levels. The analyte
concentration is determined from the amount of
absorption.
Concentration measurements are usually determined from
a working curve after calibrating the instrument with
standards of known concentration.
THEORY
Detector
Atomizer
Nebulizer
Hollow
Cathode
Lamp
Monochrom
ator
Atomic
Absorption
spectrometer
Schematic diagram of AAS:
LIGHT SOURCE
Hollow Cathode Lamp are the most common radiation
source in AAS.
It contains a tungsten anode and a hollow cylindrical
cathode made of the element to be determined.
These are sealed in a glass tube filled with an inert gas
(neon or argon ).
Each element has its own unique lamp which must be used
for that analysis .
NEBULIZER
Sucks up liquid samples at controlled rate.
Creates a fine aerosol spray for introduction into flame.
Mix the aerosol and fuel and oxidant thoroughly
for introduction into flame.
ATOMIZER
Elements to be analyzed needs to be in atomic state..
Atomization is separation of particles into individual
molecules and breaking molecules into atoms. This is done
by exposing the analyte to high temperatures in a flame or
graphite furnace .
FLAME ATOMIZER
To create flame, we need to mix an oxidant gas and a fuel
gas.
In most of the cases air-acetylene flame or nitrous oxide
acetylene flame is used.
Liquid or dissolved samples are typically used with flame
atomizer.
GRAPHITE TUBE ATOMIZER
It uses a graphite coated furnace to vaporize the sample.
In GFAAS sample, samples are deposited in a small
graphite coated tube which can then be heated to vaporize
and atomize the analyte.
The graphite tubes are heated using a high current power
supply.
MONOCHROMATOR
This is a very important part in an AA spectrometer. It is
used to separate out all of the thousands of lines.
A monochromator is used to select the specific wavelength
of light which is absorbed by the sample, and to exclude
other wavelengths.
The selection of the specific light allows the determination
of the selected element in the presence of others.
DETECTOR
The light selected by the monochromator is directed onto a
detector that is typically a photomultiplier tube, whose
function is to convert the light signal into an electrical signal
proportional to the light intensity.
The processing of electrical signal is fulfilled by a signal
amplifier .The signal could be displayed for readout, or
further fed into a data station for printout by the requested
format.
CALIBRATION CURVE
A calibration curve is used to determine the unknown
concentration of an element in a solution.
The instrument is calibrated using several solutions of
known concentrations.
The absorbance of each known solution is measured and
then a calibration curve of concentration vs absorbance is
plotted.
The sample solution is fed into the instrument, and the
absorbance of the element in this solution is measured .
The unknown concentration of the element is then
calculated from the calibration curve
APPLICATIONS
Determination of even small amounts of metals (lead,
mercury, calcium, magnesium, etc) as follows:
Environmental studies: drinking water, ocean water,
soil.
Food industry.
Pharmaceutical industry.
REFERENCES
Vogel’s Textbook of Quantitative Analysis, G. Svehla,
Pearson
 Principles of Instrumental Analysis, Skoog.
 Basic Concepts Of Analytical chemistry, S M Khopkar.
Atomic absorption spectroscopy

Atomic absorption spectroscopy

  • 1.
    PRESENTATION ON PRESENTED BY: SWATI FRM-MA-09-10 ATOMICABSORPTION SPECTROSCOPY: PRINCIPLE,THEORY,INSTRUMENTATION & APPLICATION
  • 2.
    CONTENTS  Principle  Theory Instrumentation  Applications
  • 3.
    INTRODUCTION  Atomic AbsorptionSpectroscopy is a very common technique for detecting metals and metalloids in samples.  It is very reliable and simple to use.  It can analyze over 62 elements.  It also measures the concentration of metals in the sample.
  • 4.
    HISTORY  The firstatomic absorption spectrometer was built by CSIRO scientist Alan Walsh in 1954.Shown in the picture Alan Walsh(left), with a spectrometer.
  • 5.
    Elements detectable byatomic absorption are highlighted in pink in this periodic table
  • 6.
    PRINCIPLE  The techniqueuses basically the principle that free atoms (gas) generated in an atomizer can absorb radiation at specific frequency.  Atomic-absorption spectroscopy quantifies the absorption of ground state atoms in the gaseous state .  The atoms absorb ultraviolet or visible light and make transitions to higher electronic energy levels. The analyte concentration is determined from the amount of absorption. Concentration measurements are usually determined from a working curve after calibrating the instrument with standards of known concentration.
  • 7.
  • 8.
  • 9.
    LIGHT SOURCE Hollow CathodeLamp are the most common radiation source in AAS. It contains a tungsten anode and a hollow cylindrical cathode made of the element to be determined. These are sealed in a glass tube filled with an inert gas (neon or argon ). Each element has its own unique lamp which must be used for that analysis .
  • 11.
    NEBULIZER Sucks up liquidsamples at controlled rate. Creates a fine aerosol spray for introduction into flame. Mix the aerosol and fuel and oxidant thoroughly for introduction into flame.
  • 12.
    ATOMIZER Elements to beanalyzed needs to be in atomic state.. Atomization is separation of particles into individual molecules and breaking molecules into atoms. This is done by exposing the analyte to high temperatures in a flame or graphite furnace .
  • 14.
    FLAME ATOMIZER To createflame, we need to mix an oxidant gas and a fuel gas. In most of the cases air-acetylene flame or nitrous oxide acetylene flame is used. Liquid or dissolved samples are typically used with flame atomizer.
  • 16.
    GRAPHITE TUBE ATOMIZER Ituses a graphite coated furnace to vaporize the sample. In GFAAS sample, samples are deposited in a small graphite coated tube which can then be heated to vaporize and atomize the analyte. The graphite tubes are heated using a high current power supply.
  • 17.
    MONOCHROMATOR This is avery important part in an AA spectrometer. It is used to separate out all of the thousands of lines. A monochromator is used to select the specific wavelength of light which is absorbed by the sample, and to exclude other wavelengths. The selection of the specific light allows the determination of the selected element in the presence of others.
  • 18.
    DETECTOR The light selectedby the monochromator is directed onto a detector that is typically a photomultiplier tube, whose function is to convert the light signal into an electrical signal proportional to the light intensity. The processing of electrical signal is fulfilled by a signal amplifier .The signal could be displayed for readout, or further fed into a data station for printout by the requested format.
  • 19.
    CALIBRATION CURVE A calibrationcurve is used to determine the unknown concentration of an element in a solution. The instrument is calibrated using several solutions of known concentrations. The absorbance of each known solution is measured and then a calibration curve of concentration vs absorbance is plotted. The sample solution is fed into the instrument, and the absorbance of the element in this solution is measured . The unknown concentration of the element is then calculated from the calibration curve
  • 20.
    APPLICATIONS Determination of evensmall amounts of metals (lead, mercury, calcium, magnesium, etc) as follows: Environmental studies: drinking water, ocean water, soil. Food industry. Pharmaceutical industry.
  • 21.
    REFERENCES Vogel’s Textbook ofQuantitative Analysis, G. Svehla, Pearson  Principles of Instrumental Analysis, Skoog.  Basic Concepts Of Analytical chemistry, S M Khopkar.