Downloaded 346 times
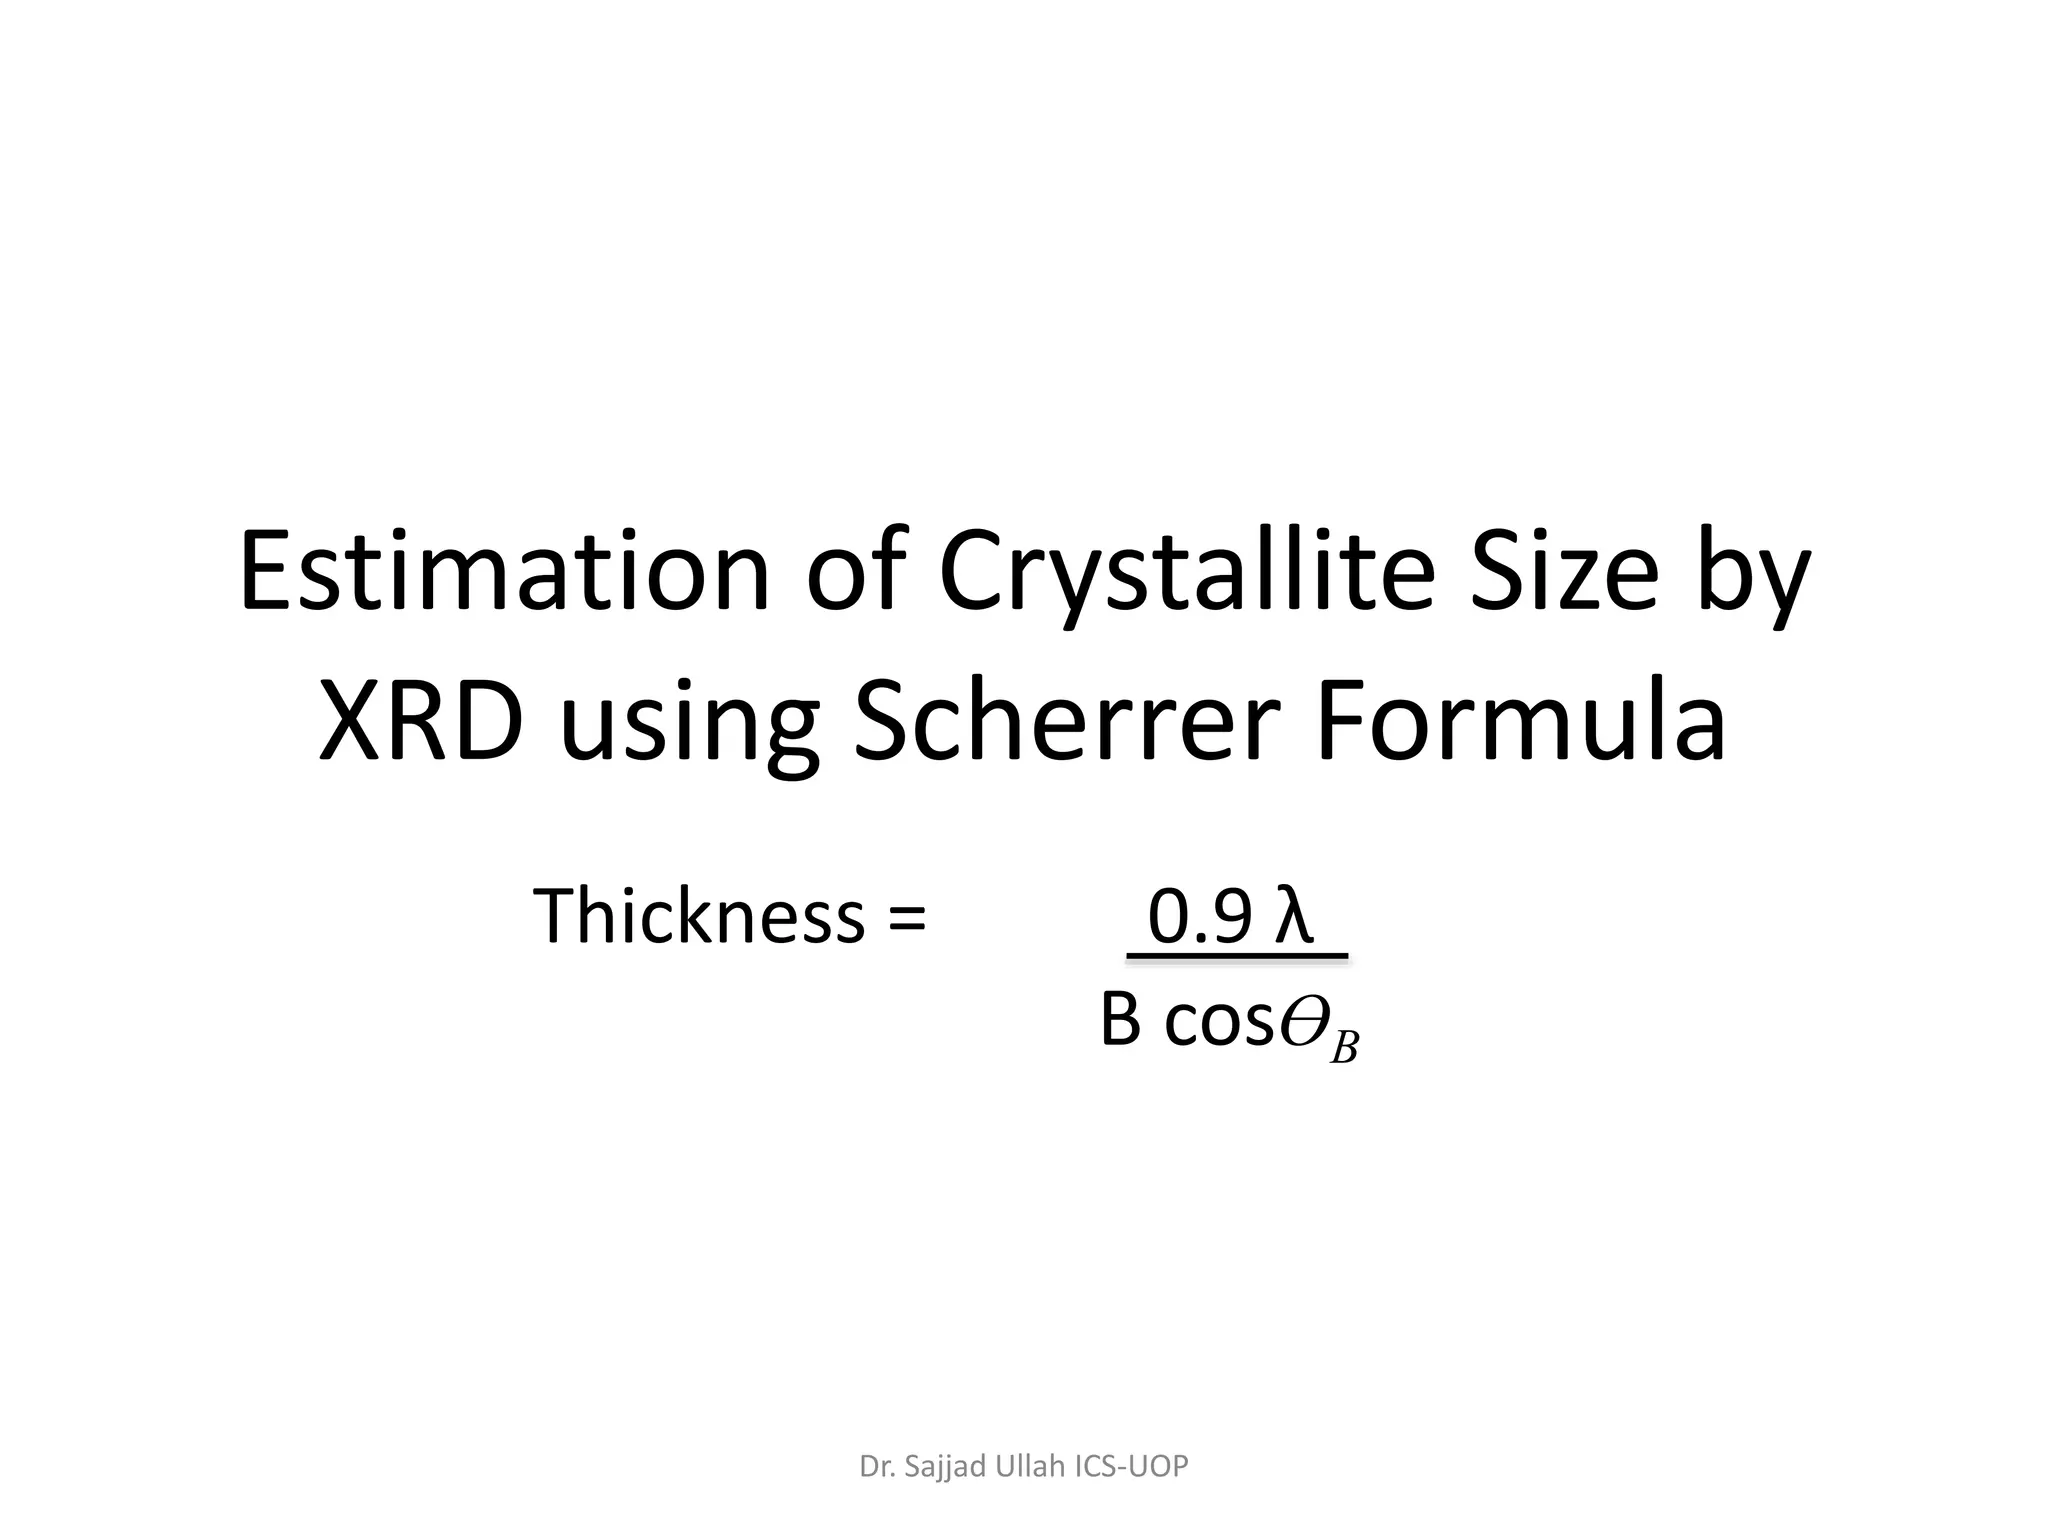
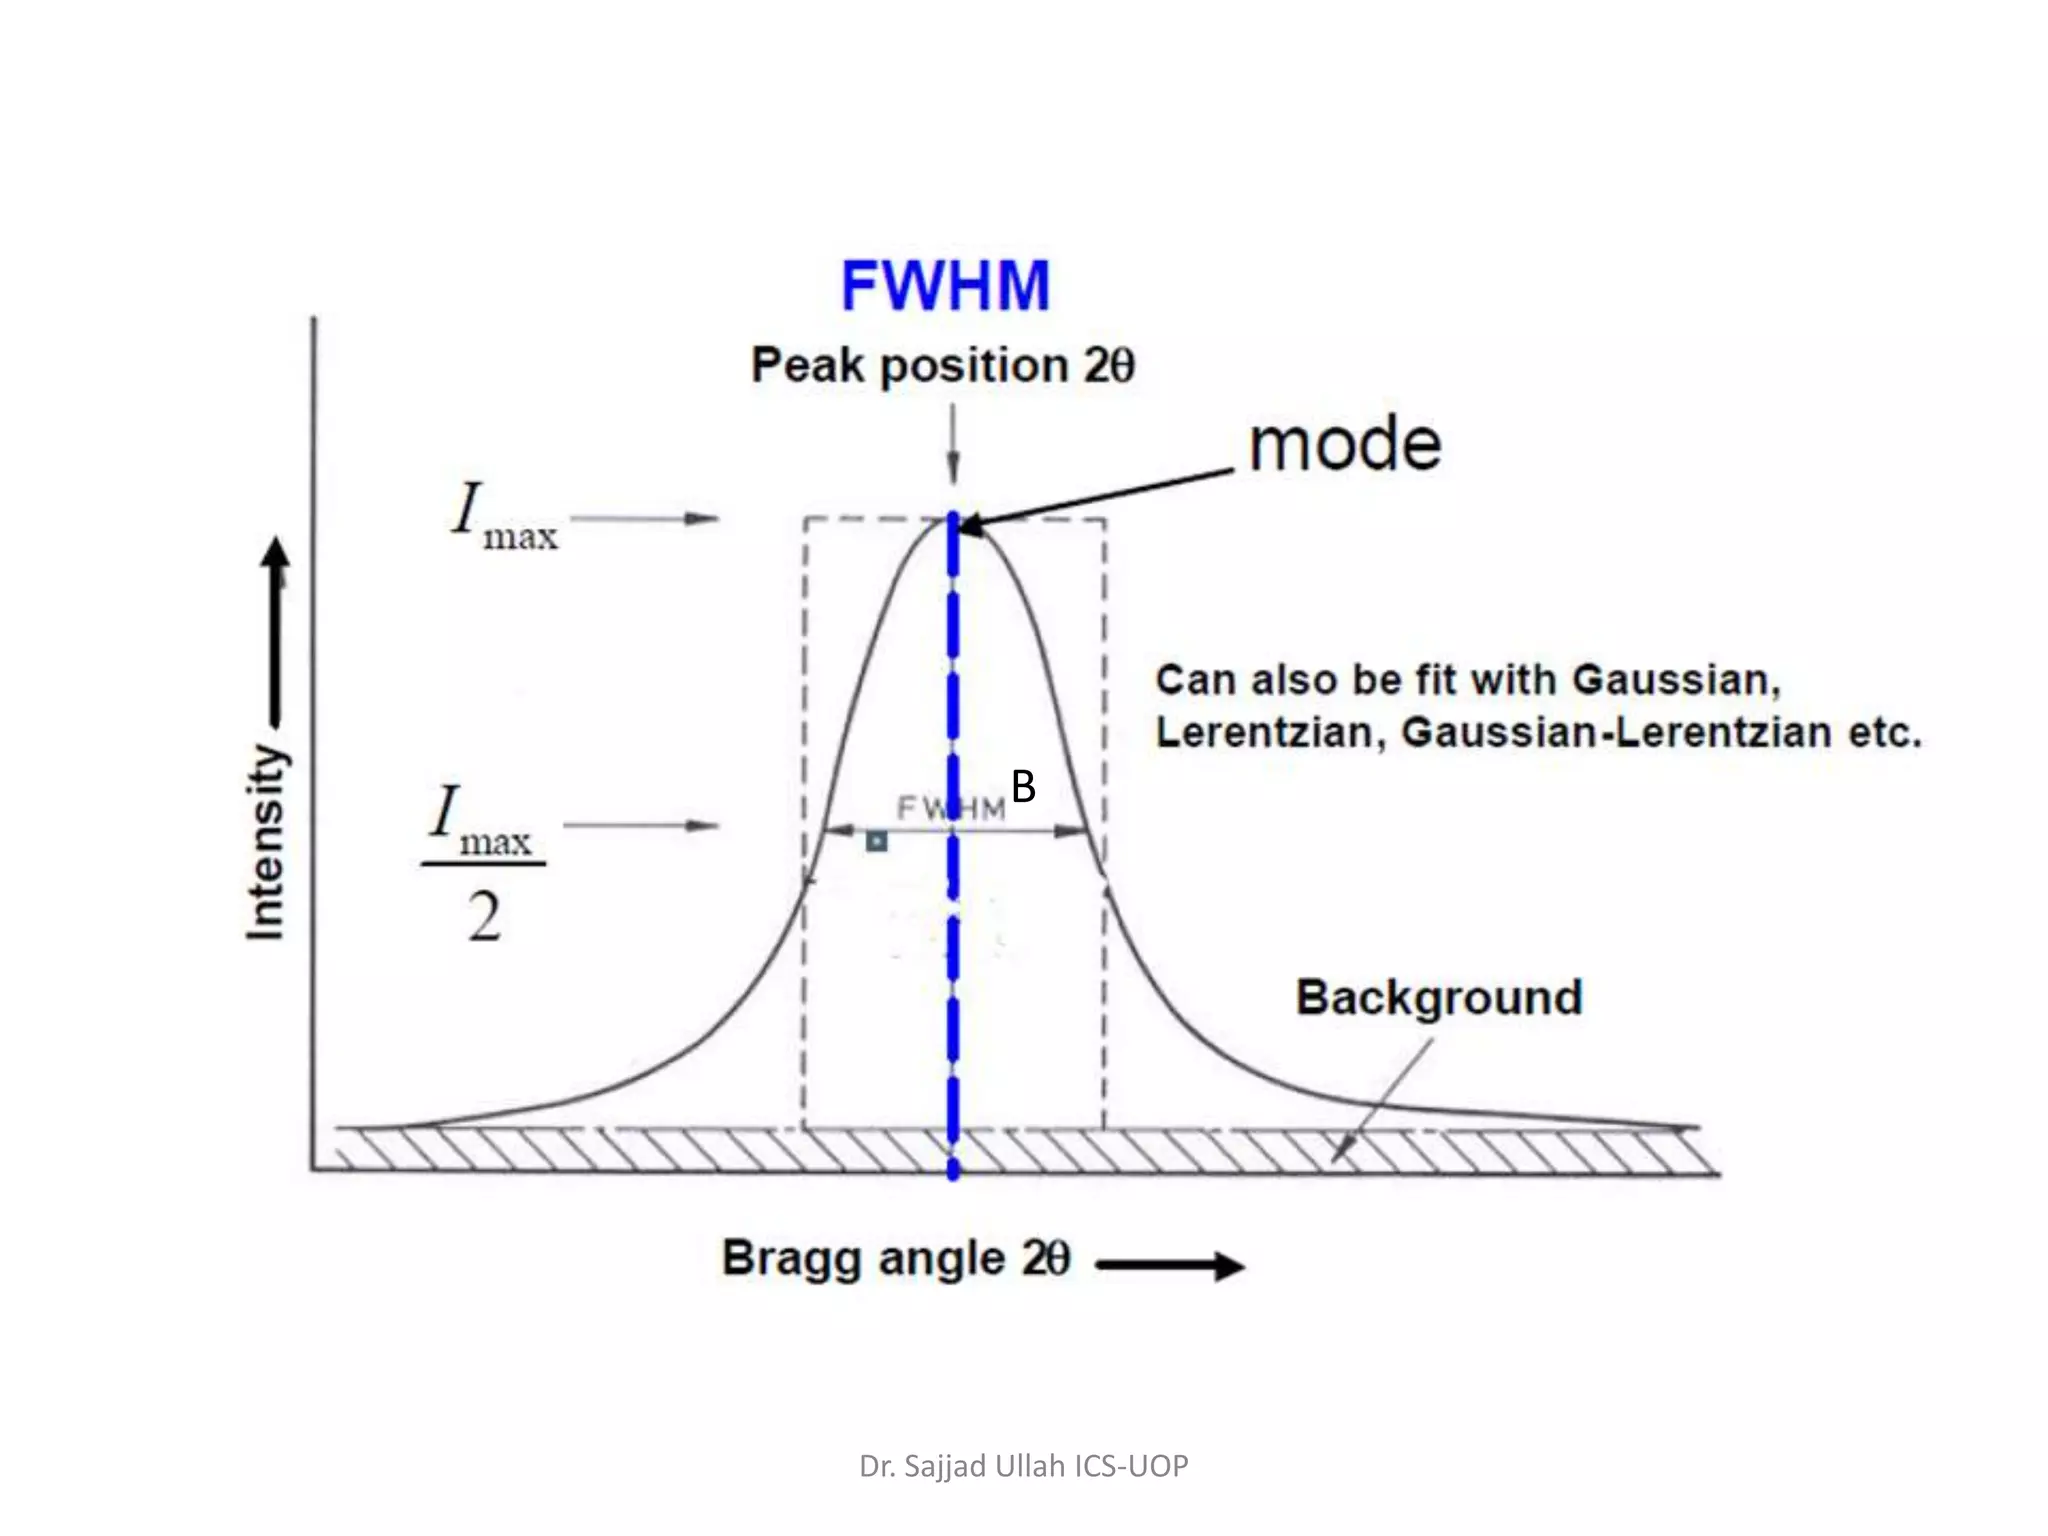
![The Scherrer Formula
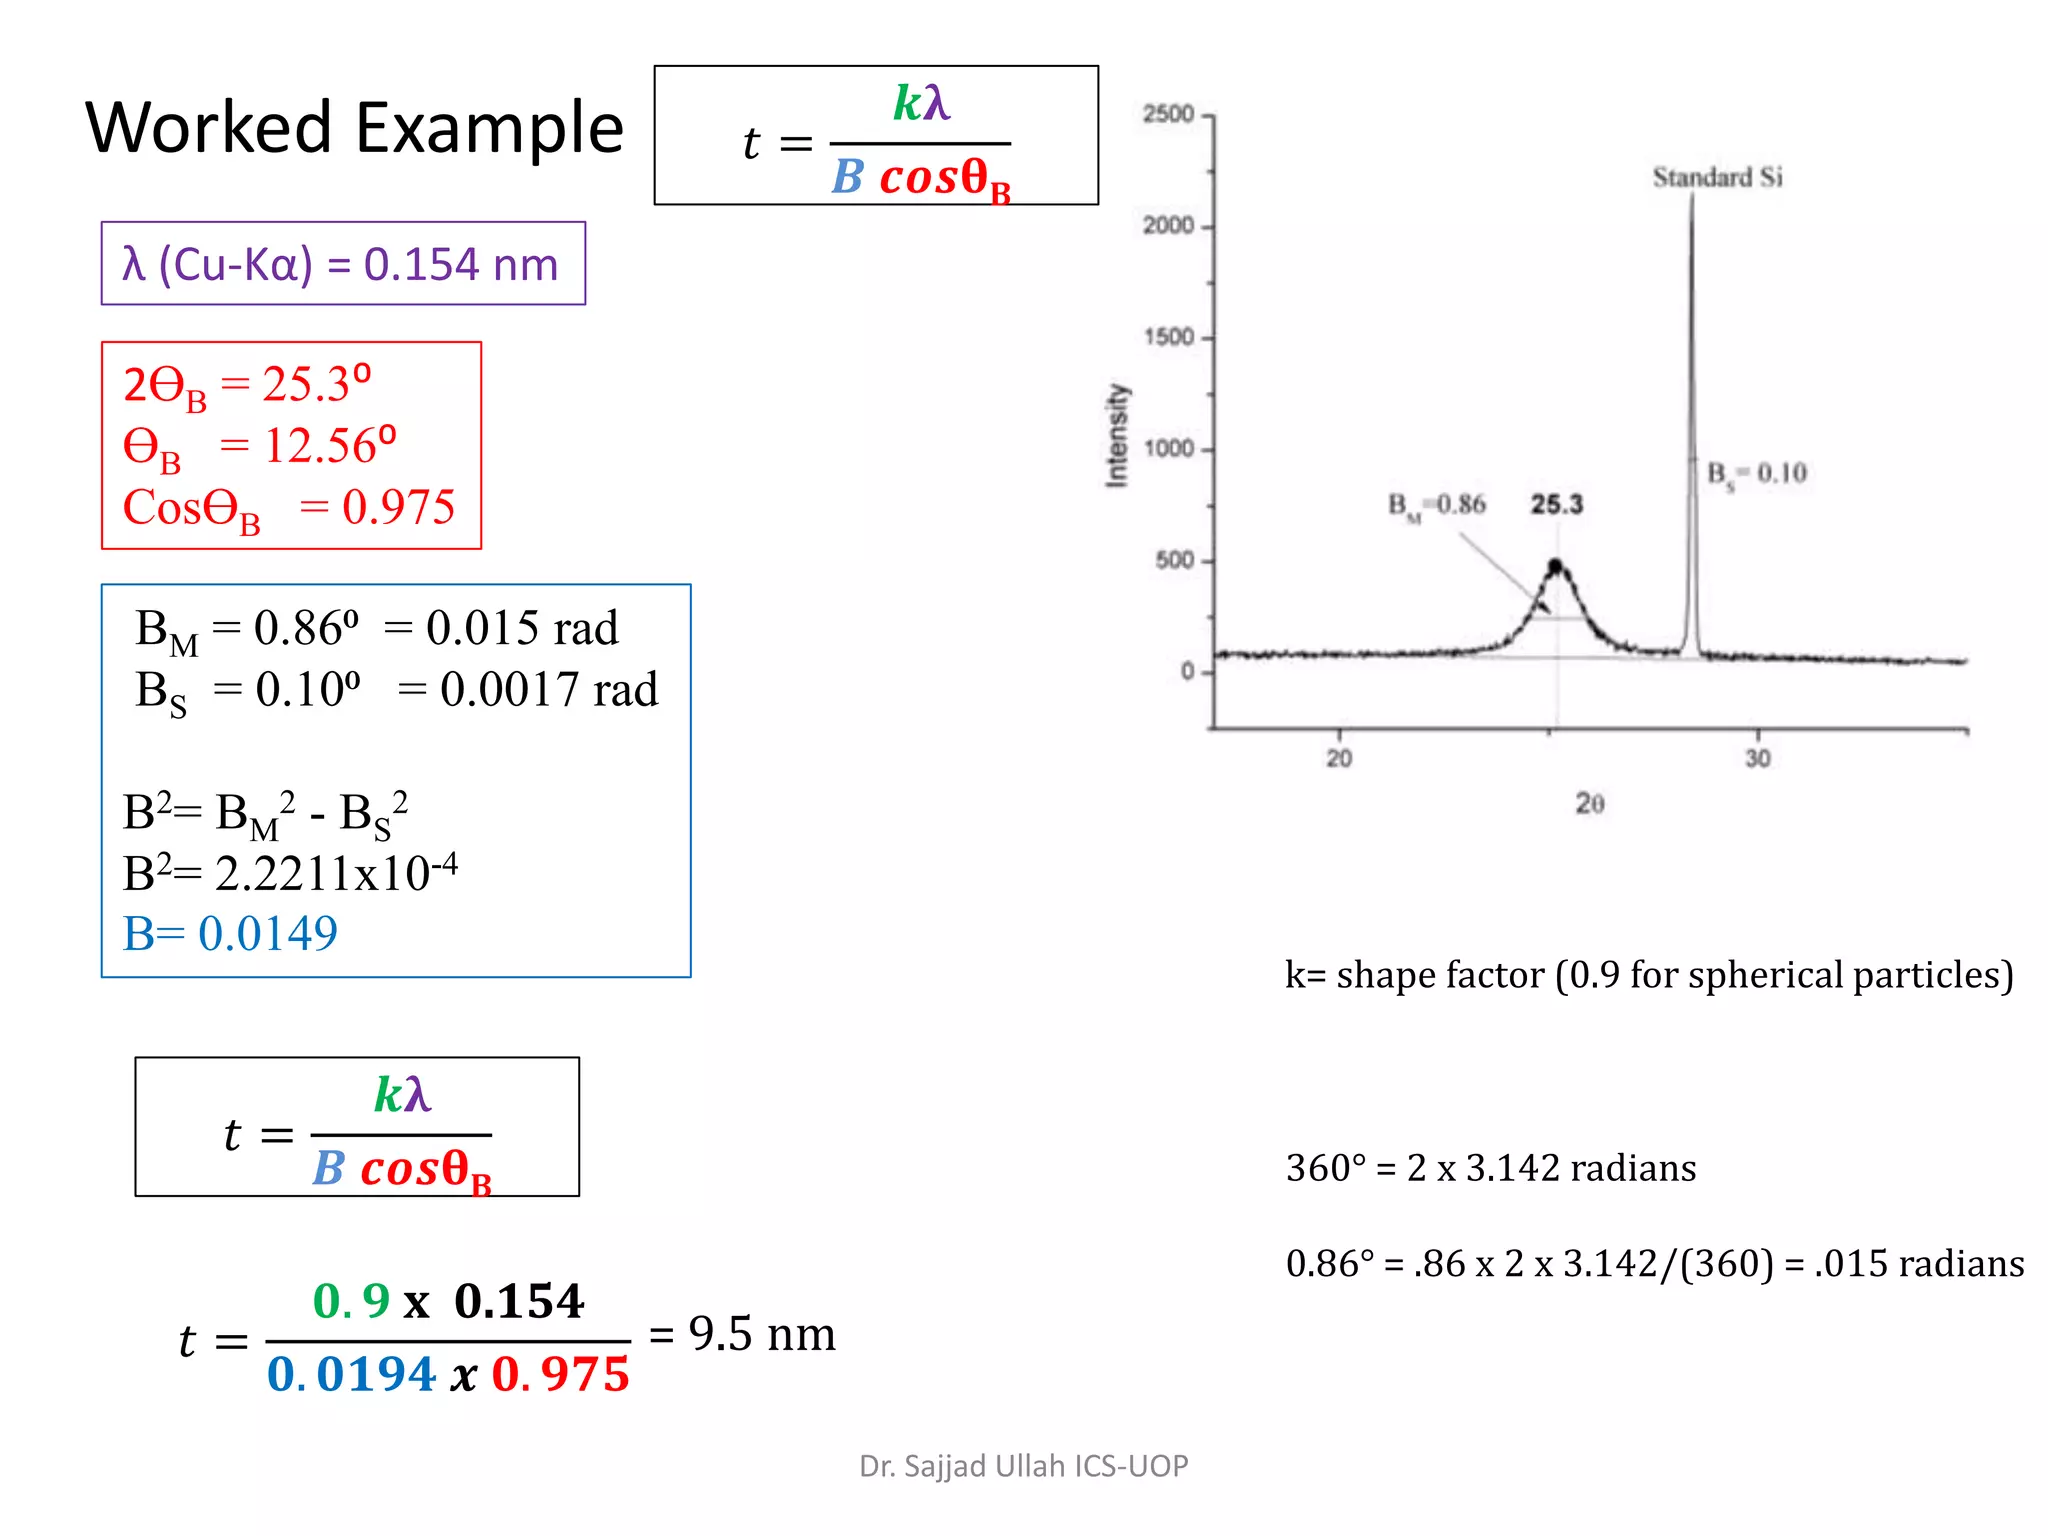
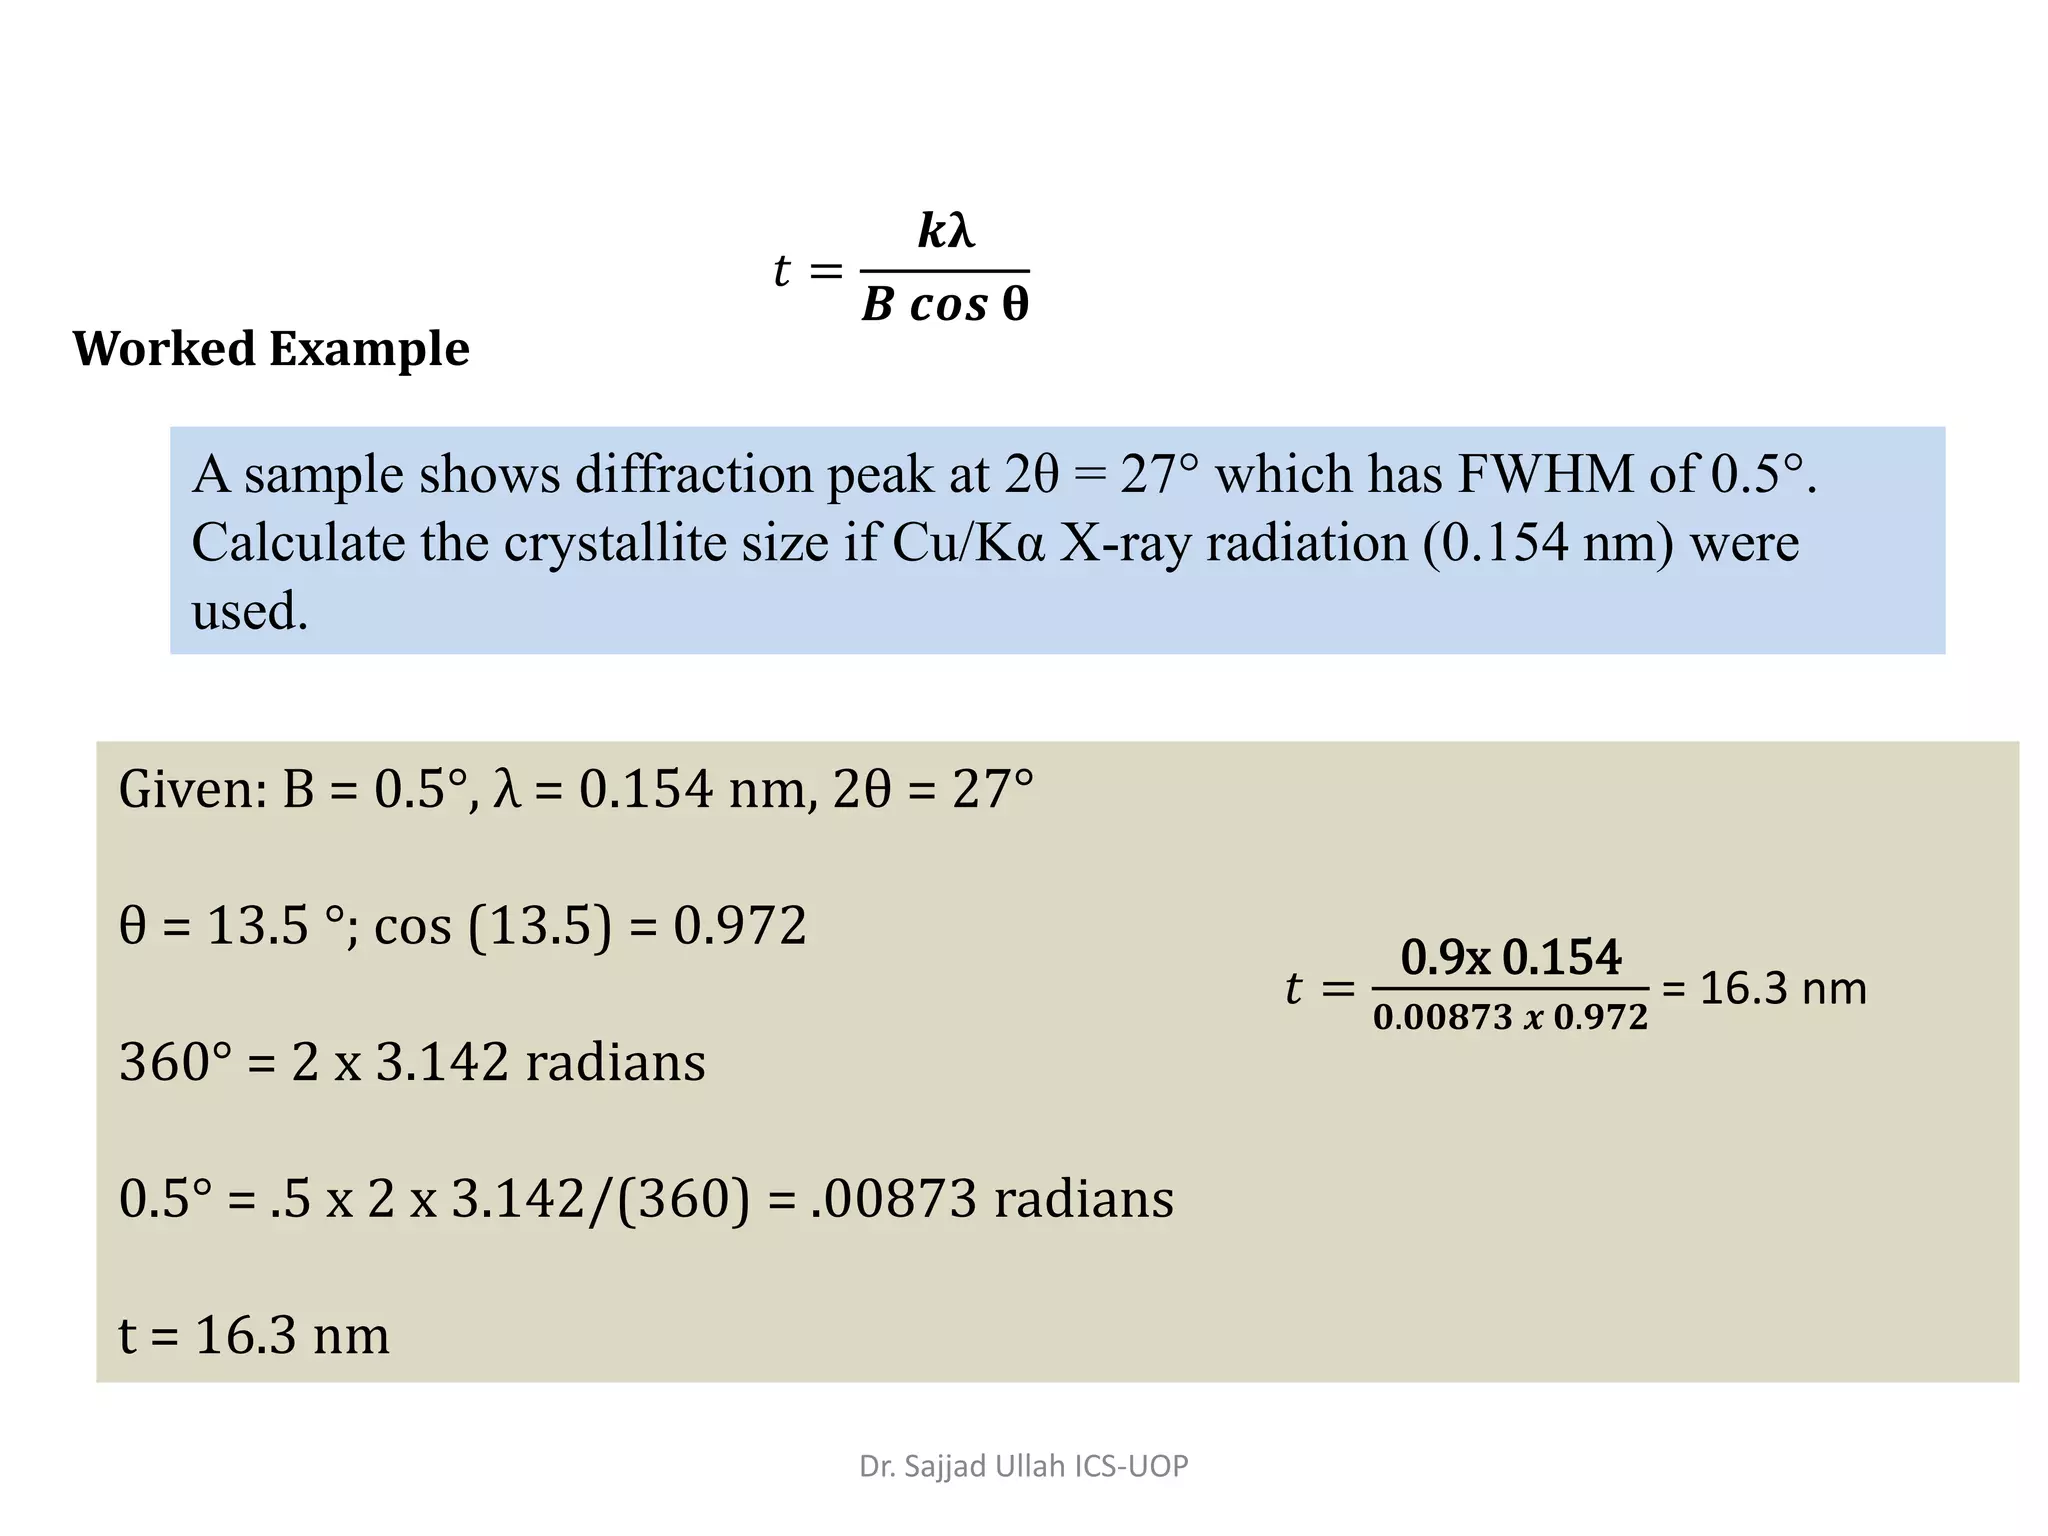
λ = the X-ray wavelength used (Cu/K α = 0.154 nm)
ӨB = The Bragg angle. It is obtained by dividing by 2 the 2Ө value of the
corresponding peak.
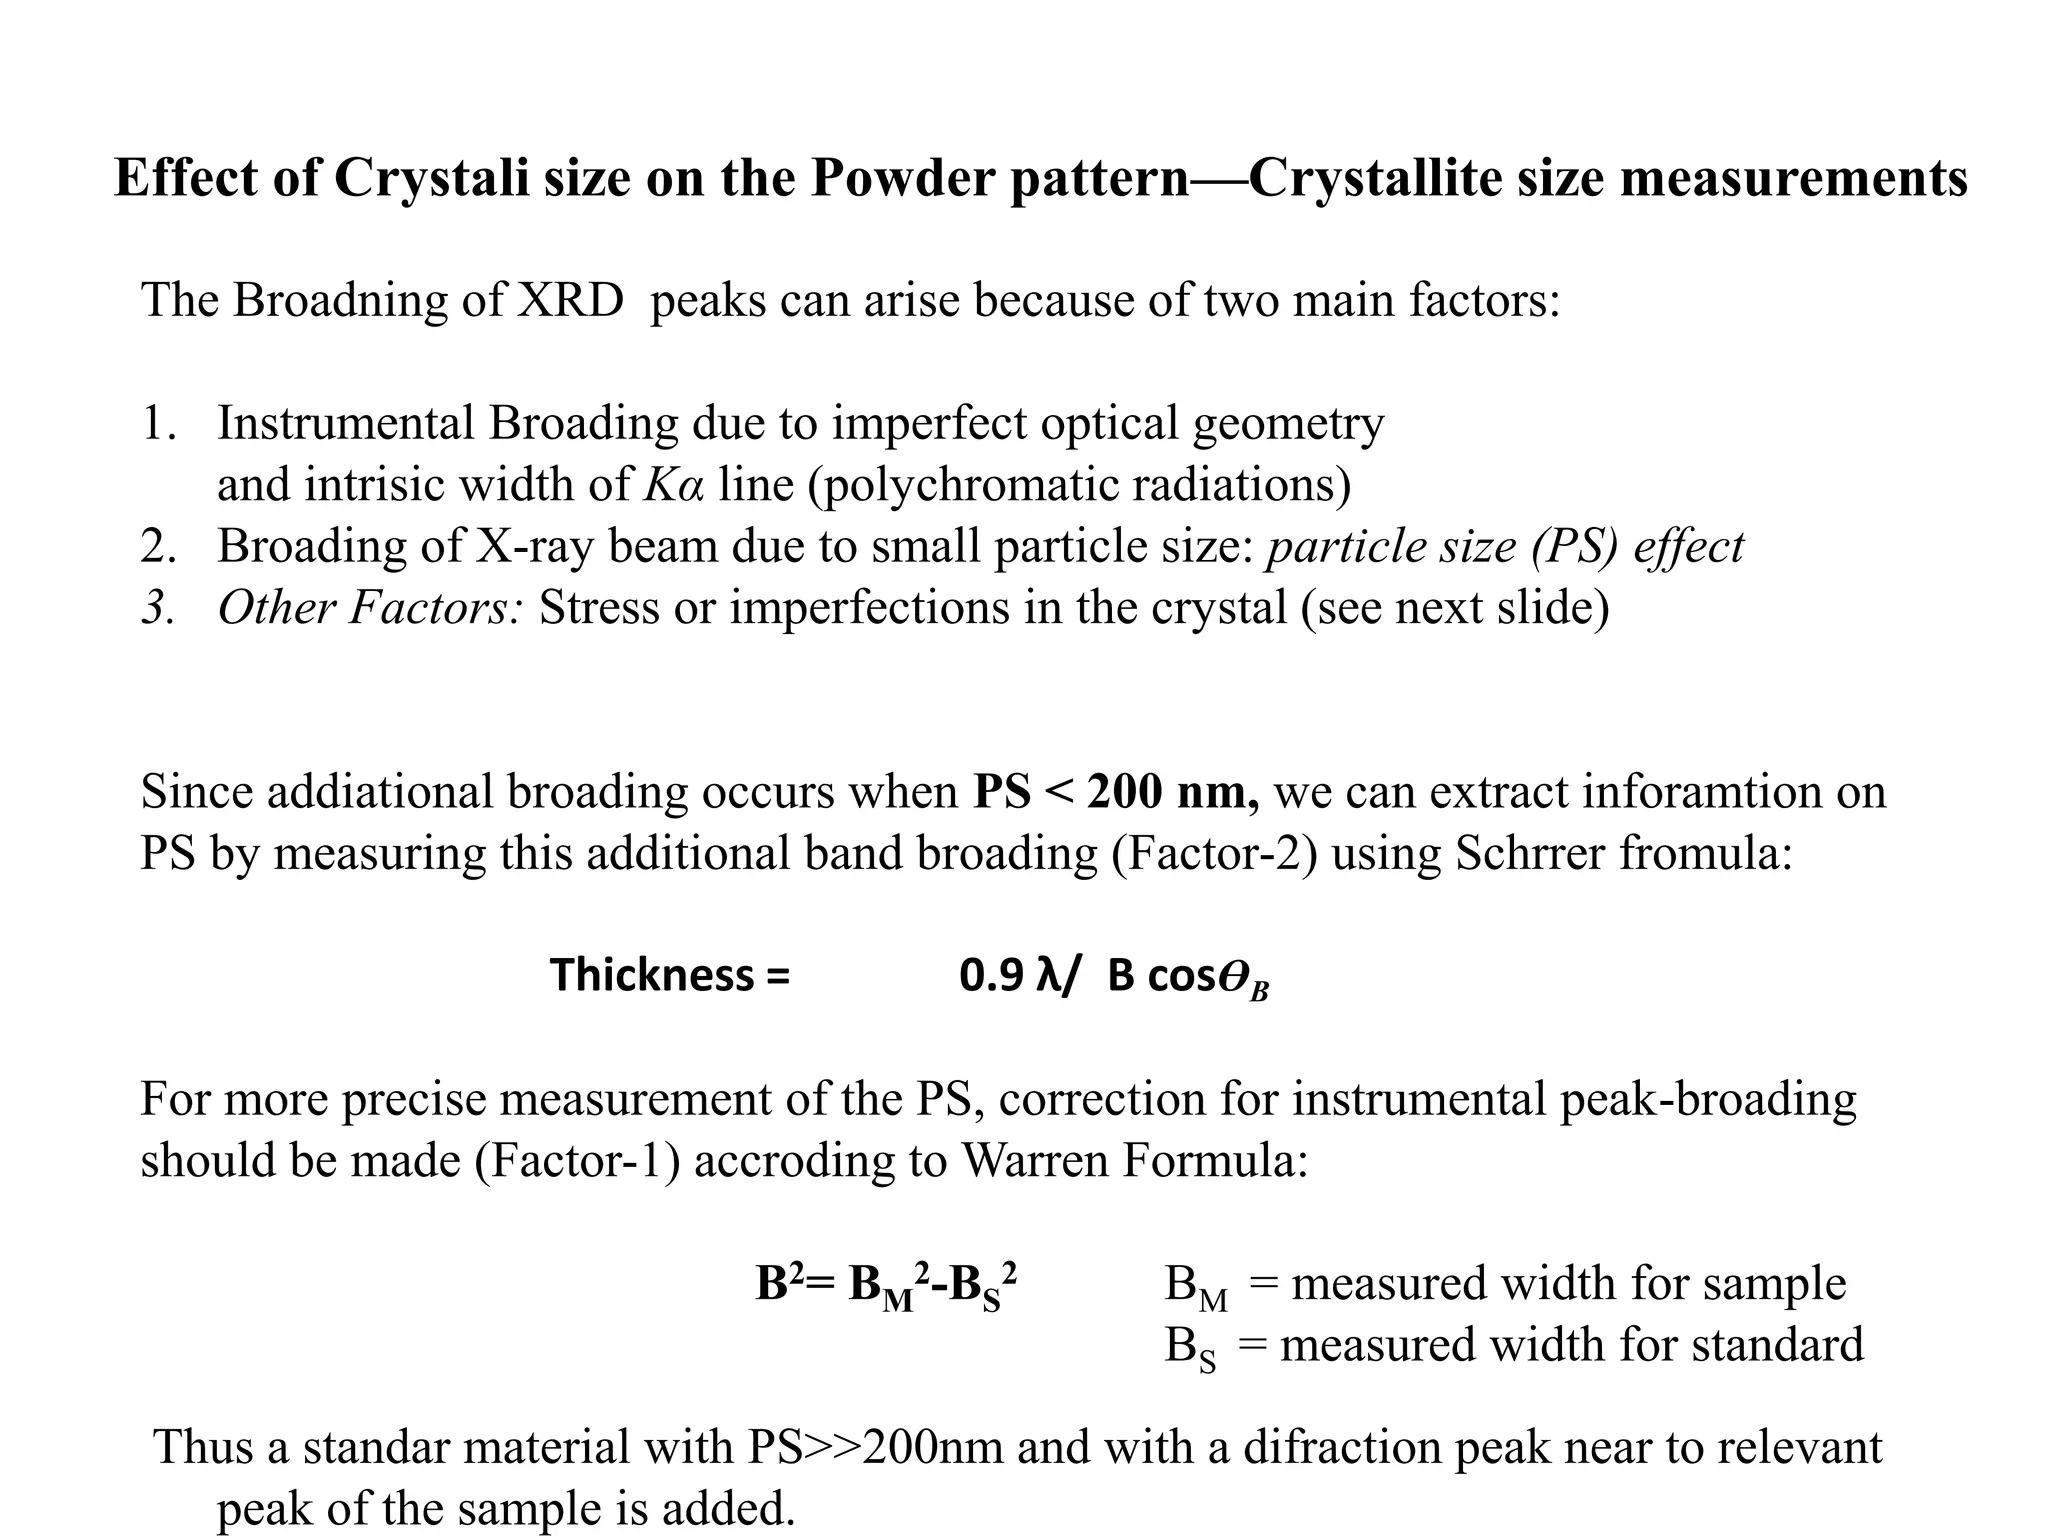
B = The line broadning (in terms of angular spread) measured from the
extra peak width at half the peak height and is obtained from
Warrem formula:
B2= BM
2-BS
2
Note: The Value of B is to be converted to radian before putting in Schreer formula
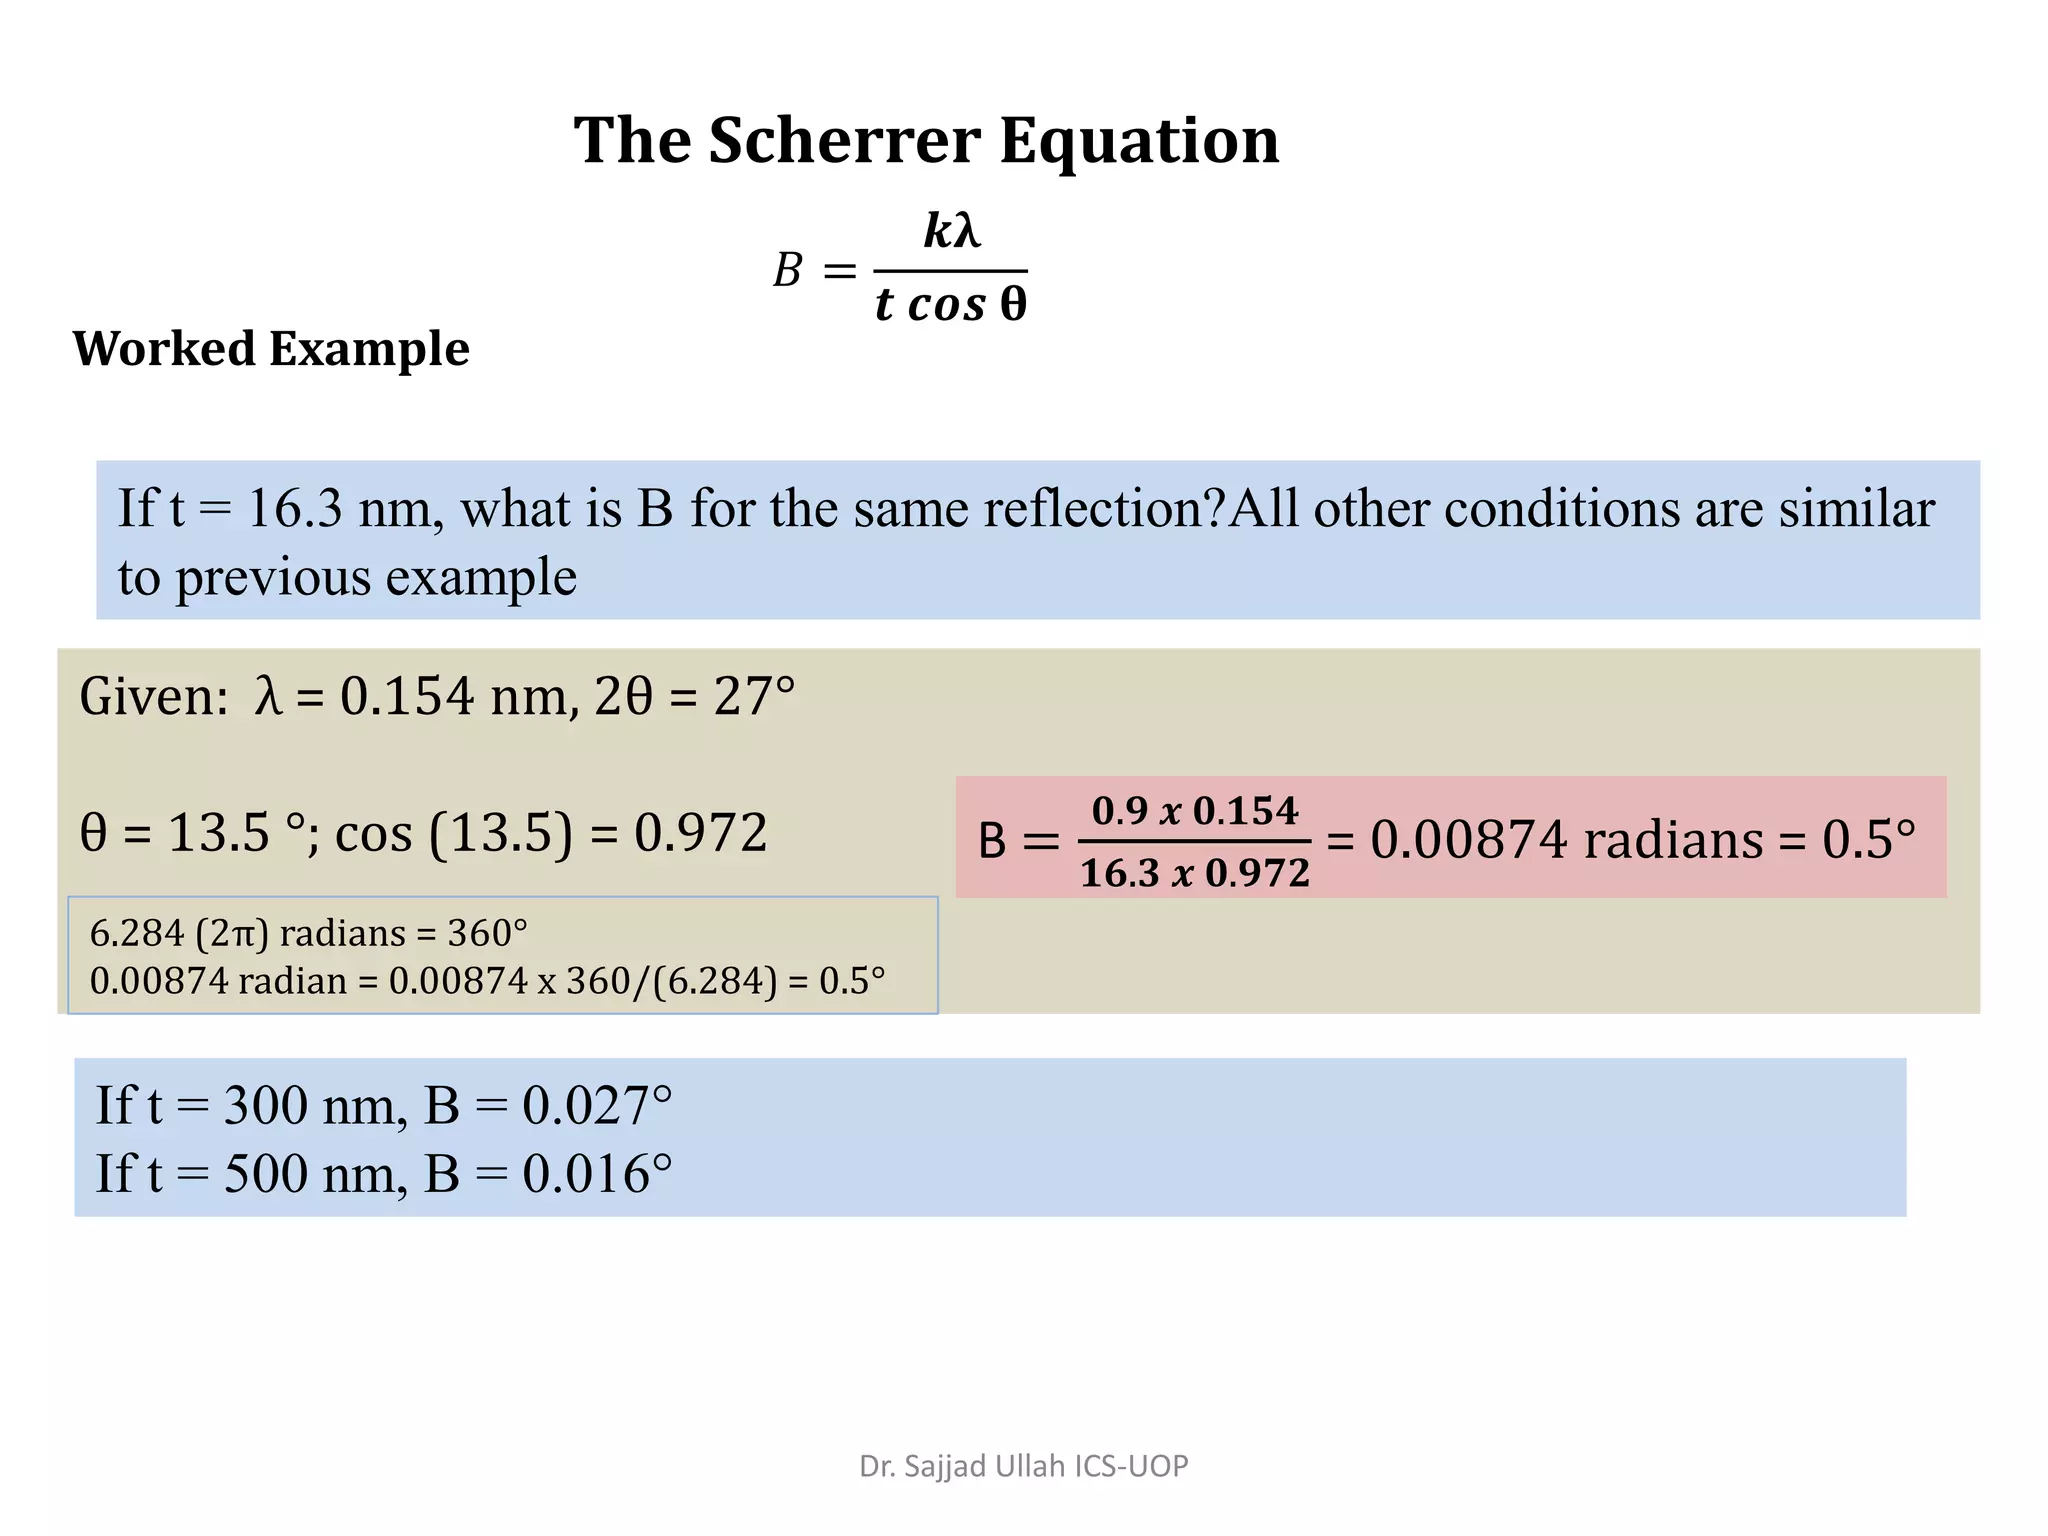
k = is a shape factor which is 0.9 for spherical particles
𝑡 =
𝒌λ
𝑩 𝒄𝒐𝒔θB
A.R. West, Solid State Chemistry and its Applications, Wiley, Chichester [West Sussex] New York, 1984.](https://image.slidesharecdn.com/xraydiffractionanalysisofmaterials-190127102801/75/X-ray-diffraction-analysis-for-material-Characterization-33-2048.jpg)
![A.R. West, Solid State Chemistry and its Applications, Wiley, Chichester [West Sussex] New York, 1984.
Dr. Sajjad Ullah ICS-UOP](https://image.slidesharecdn.com/xraydiffractionanalysisofmaterials-190127102801/75/X-ray-diffraction-analysis-for-material-Characterization-37-2048.jpg)
![The XRD patterns for powder laponite (LA) and laponite-Erbium (LA-Er) samples are shown in
Fig. 2. Comparing these XRD patterns, it was found that the basal refection corresponding to the
(001) plane at 2θ value of 6.2˚ is shifted to a 5.2˚ in LA-Er sample. This shift could be more
clearly seen in the magnified region (3-14 ˚) of the diffractograms shown as inset in Figure 2.
5 10 15 20 25 30 35 40 45 50
2degree
6.2
5.2
LA
LA-Er
4 6 8 10 12 14
Intensity(a.u)
2
6.2
5.2
Intensity(a.u)
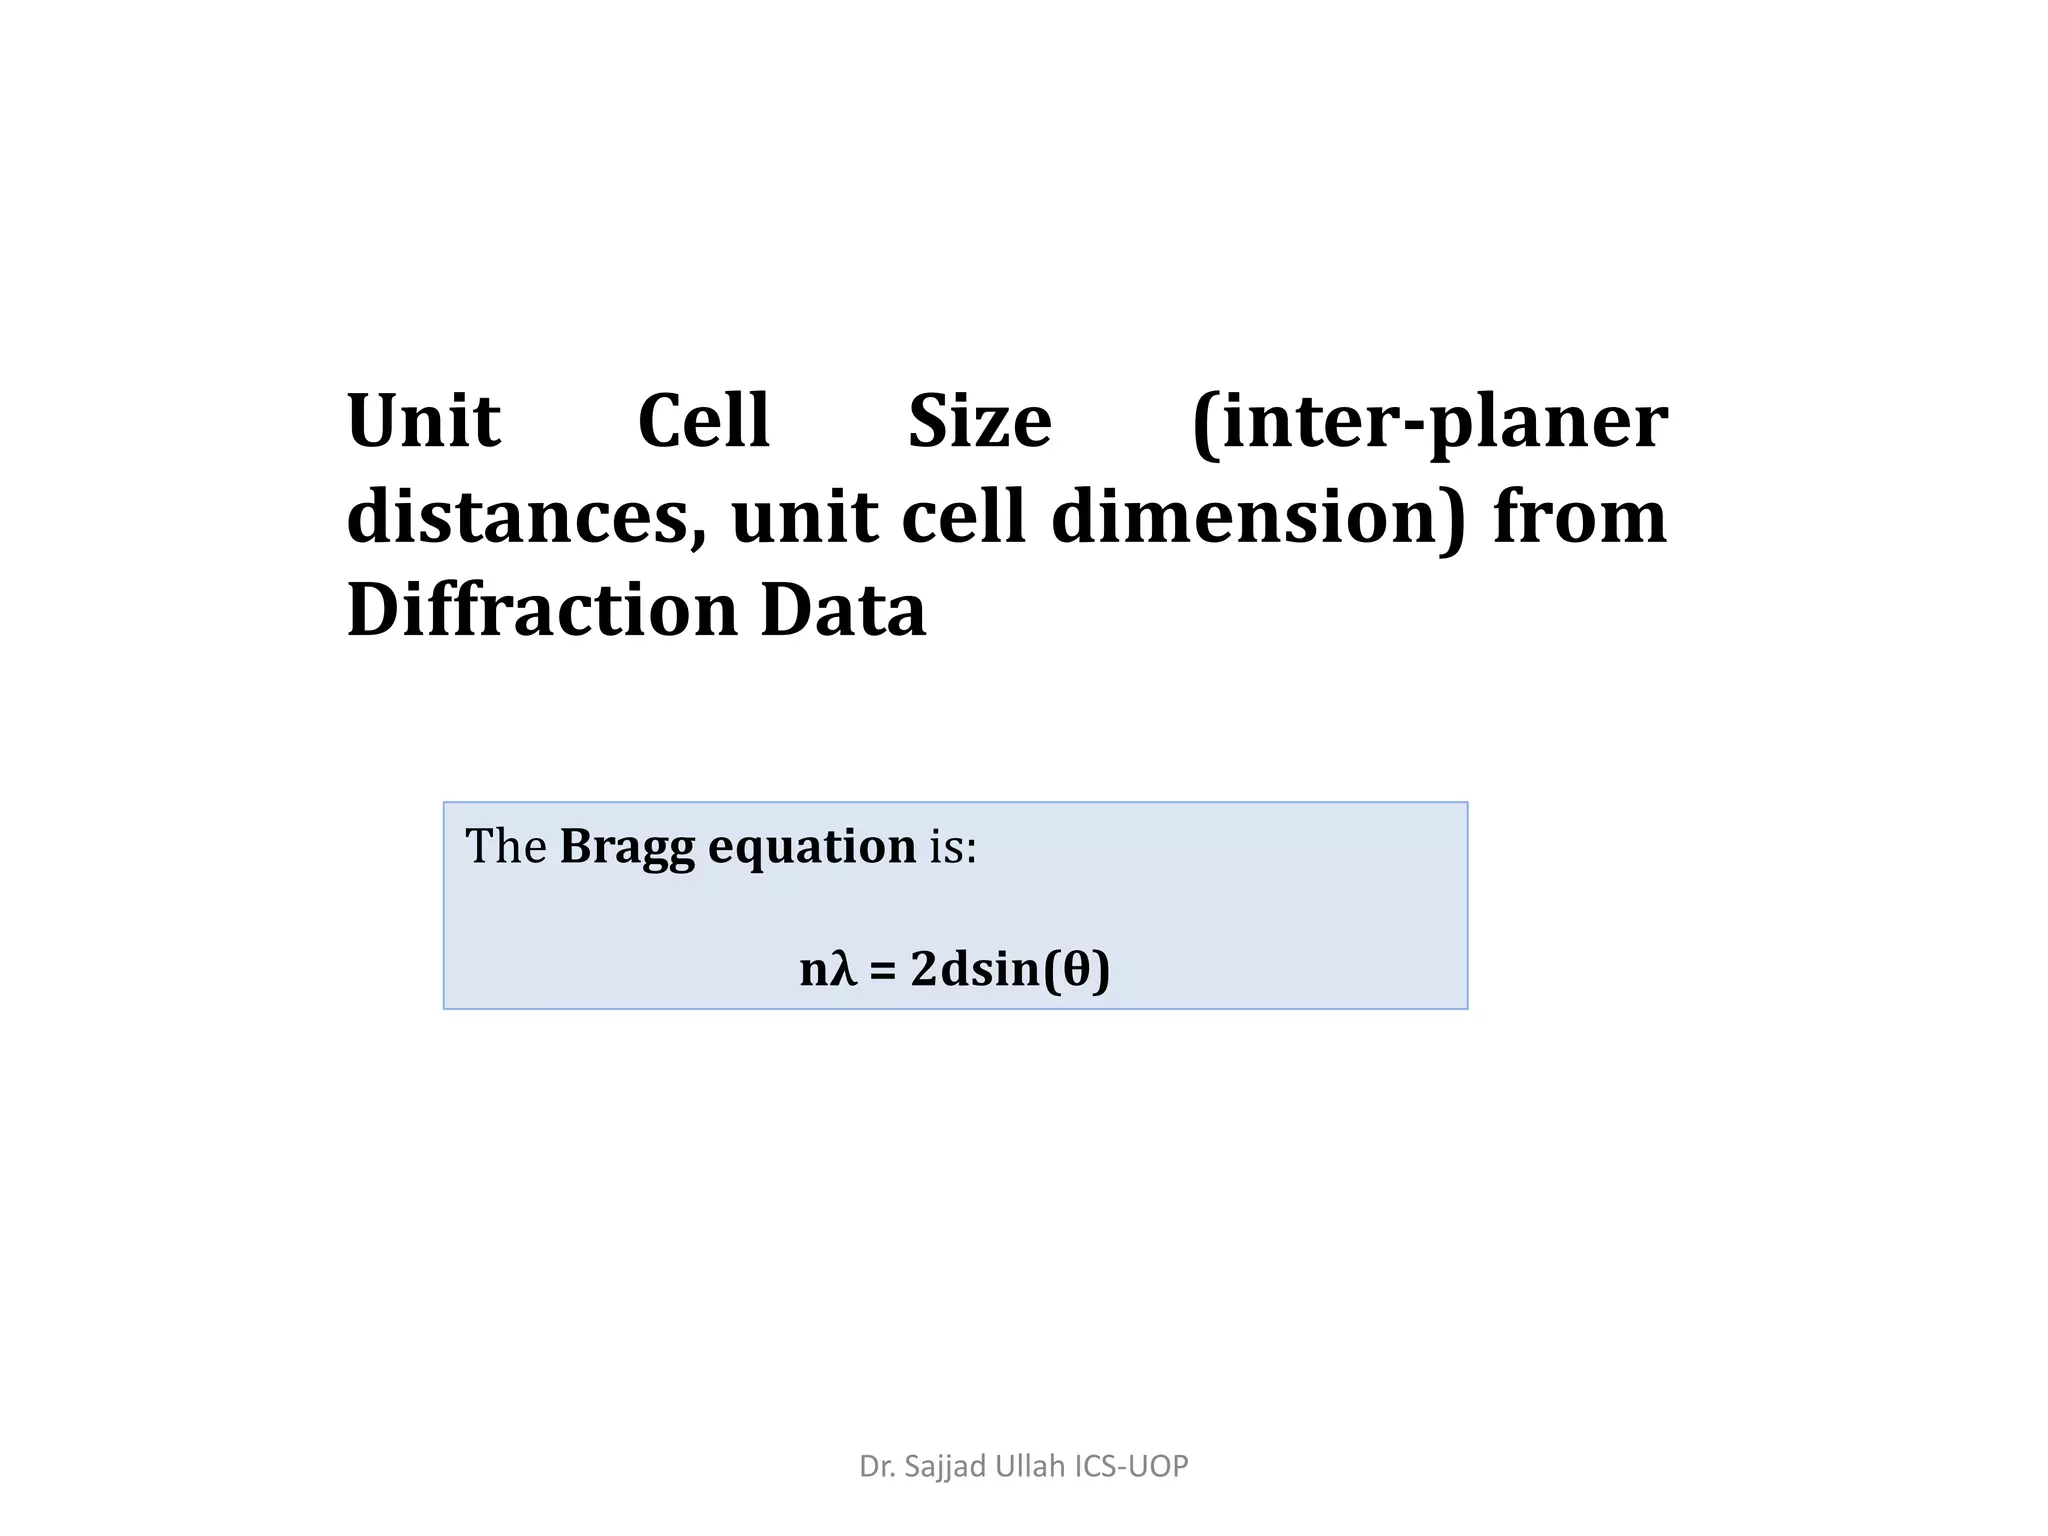
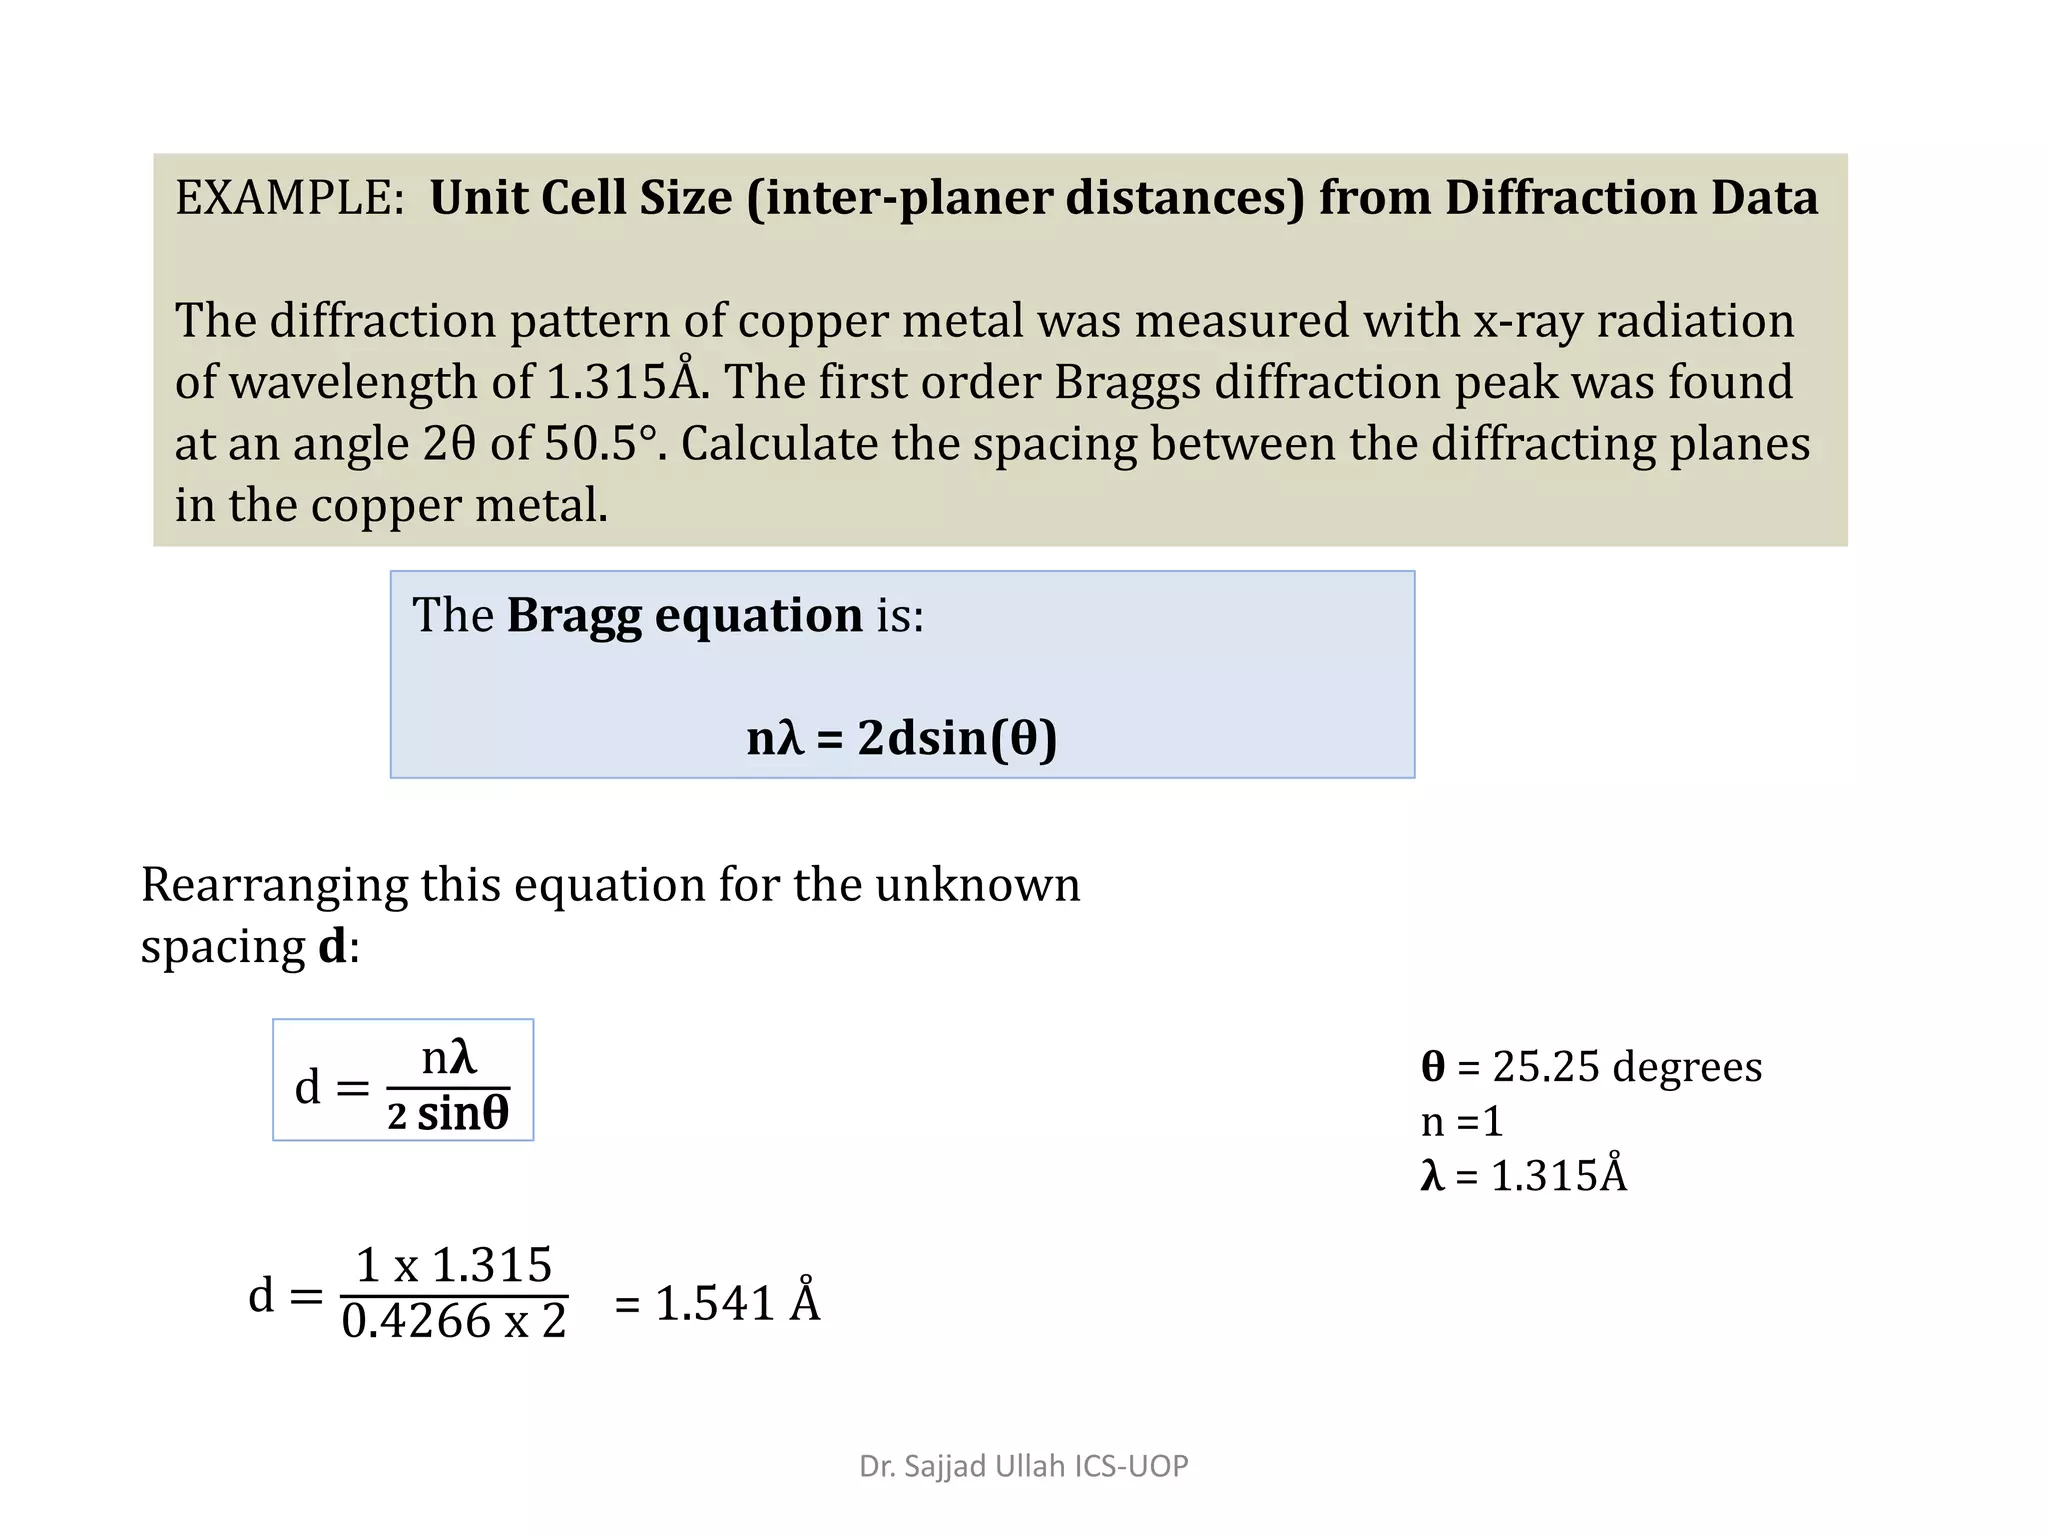
The inter-planar distance
between the (001) plan
calculated using Braggs equation
comes out to be 14.4 Å and 17.4
Å for Lap, Lap@Eu. An increase
of 3.0 Å was observed for
Lap@Eu and Lap@[Eu(tta)n]
compared to the pristine
Laponite. This increase in inter-
planar distances (3 Å) confirms
intercalation of Er (between the
layers of LA.
XRD studies of Laponite (LA) Clay before and after
intercalation of Er+3 ions.
Reference: DOI: https://doi.org/10.1515/aot-2018-0030 Dr. Sajjad Ullah ICS-UOP](https://image.slidesharecdn.com/xraydiffractionanalysisofmaterials-190127102801/75/X-ray-diffraction-analysis-for-material-Characterization-54-2048.jpg)

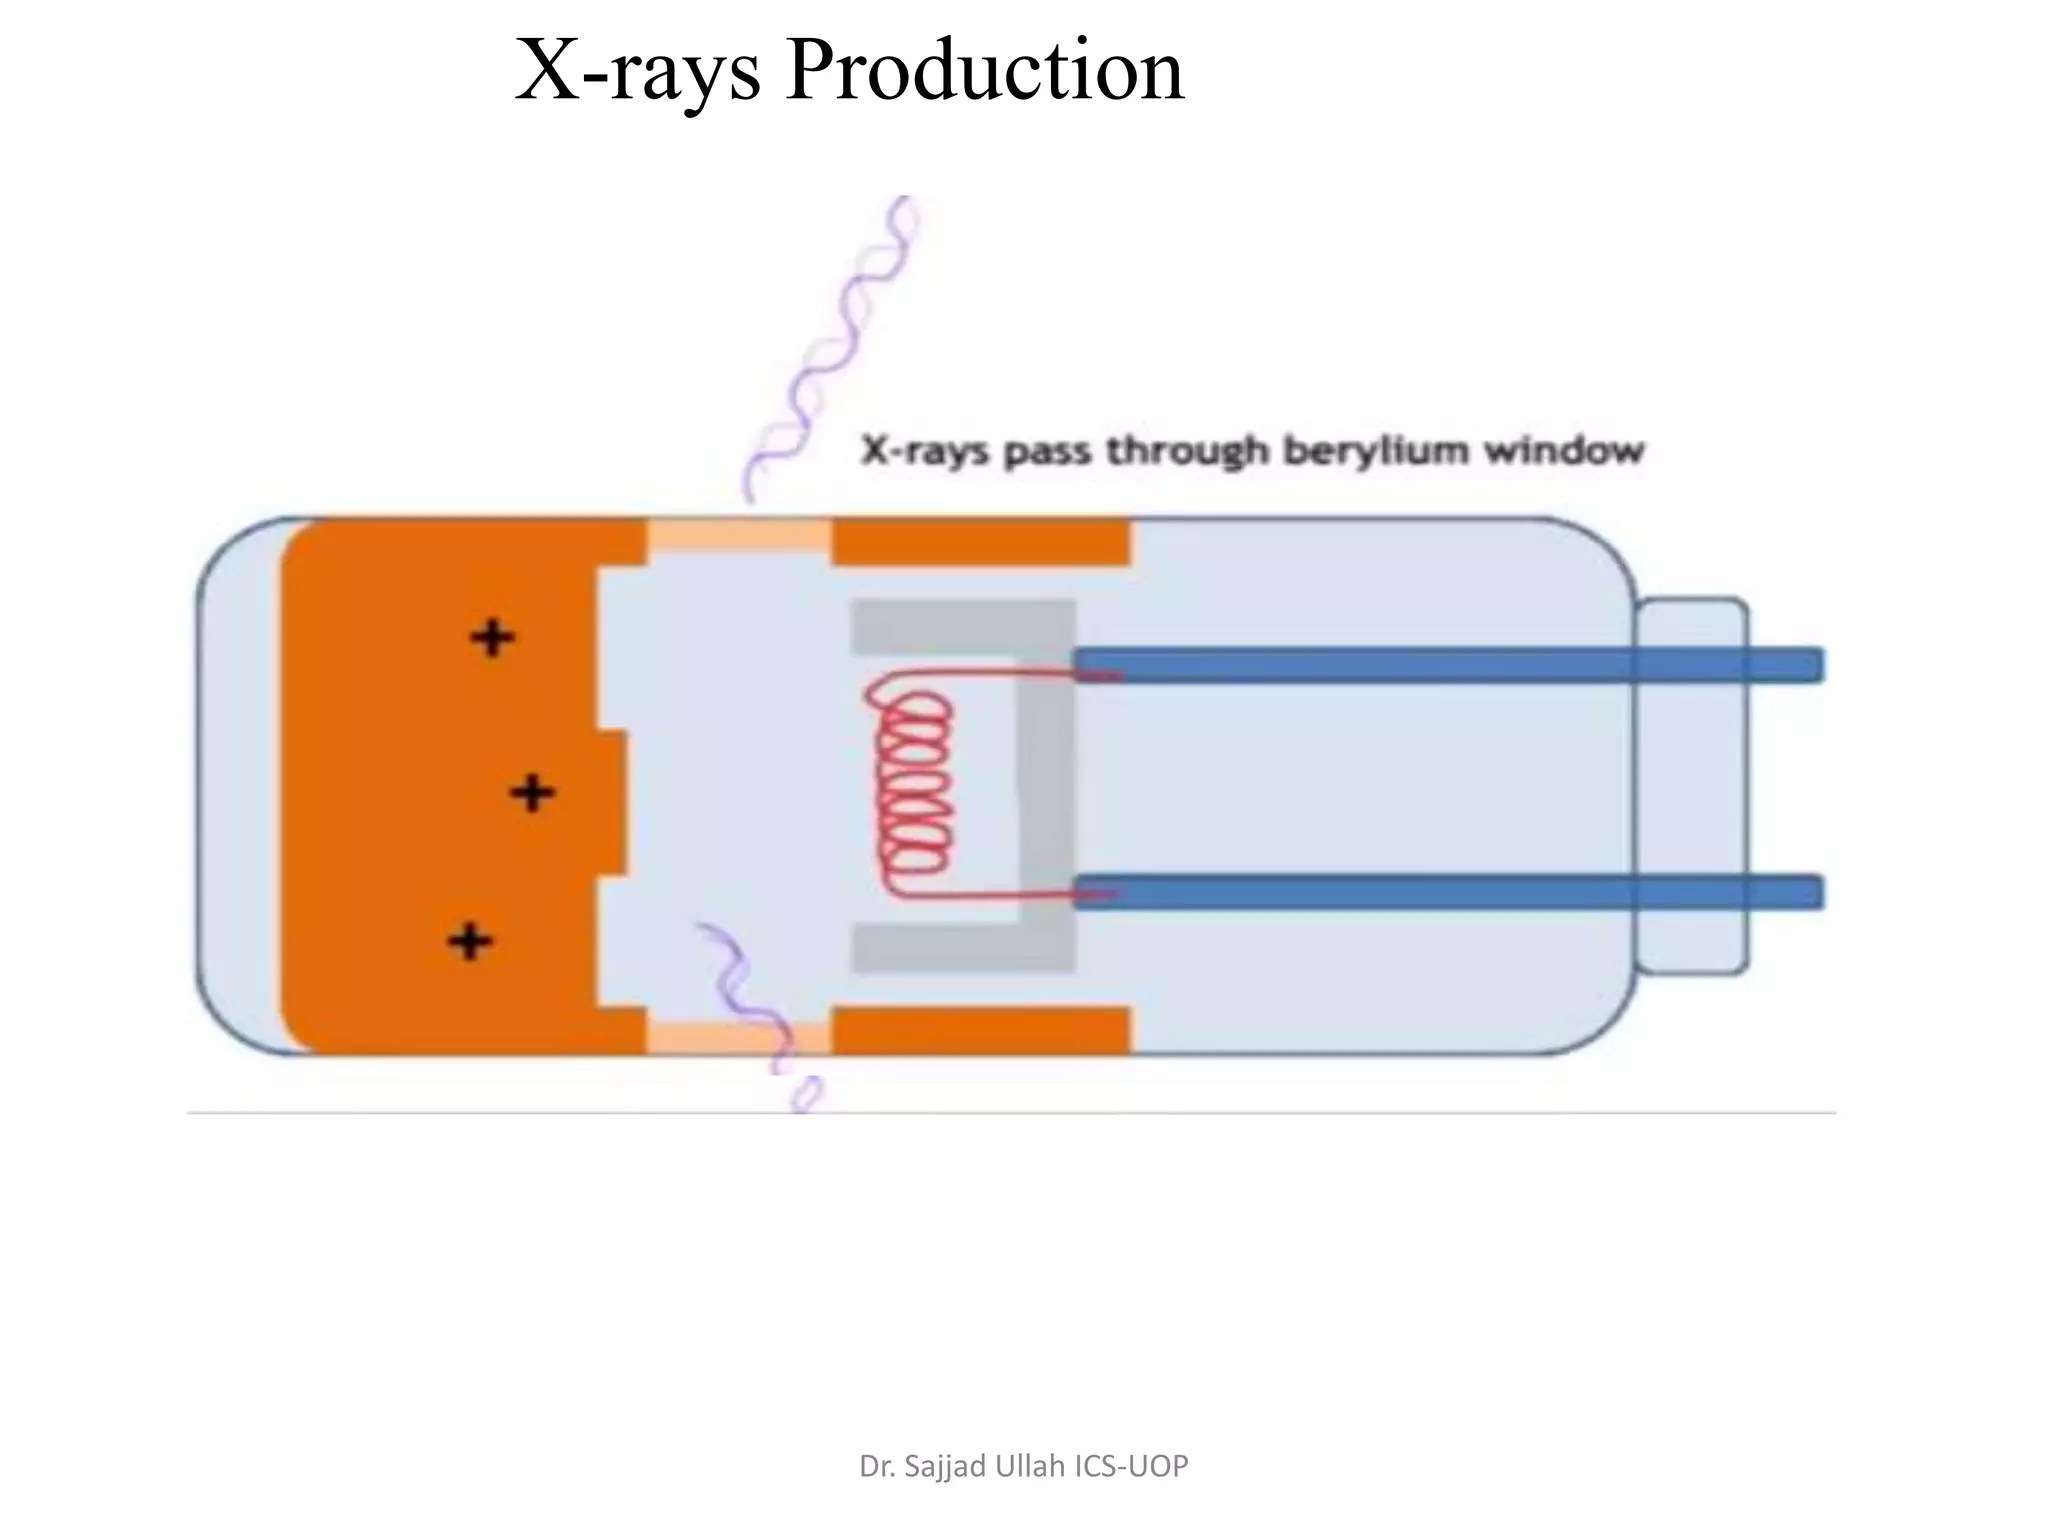
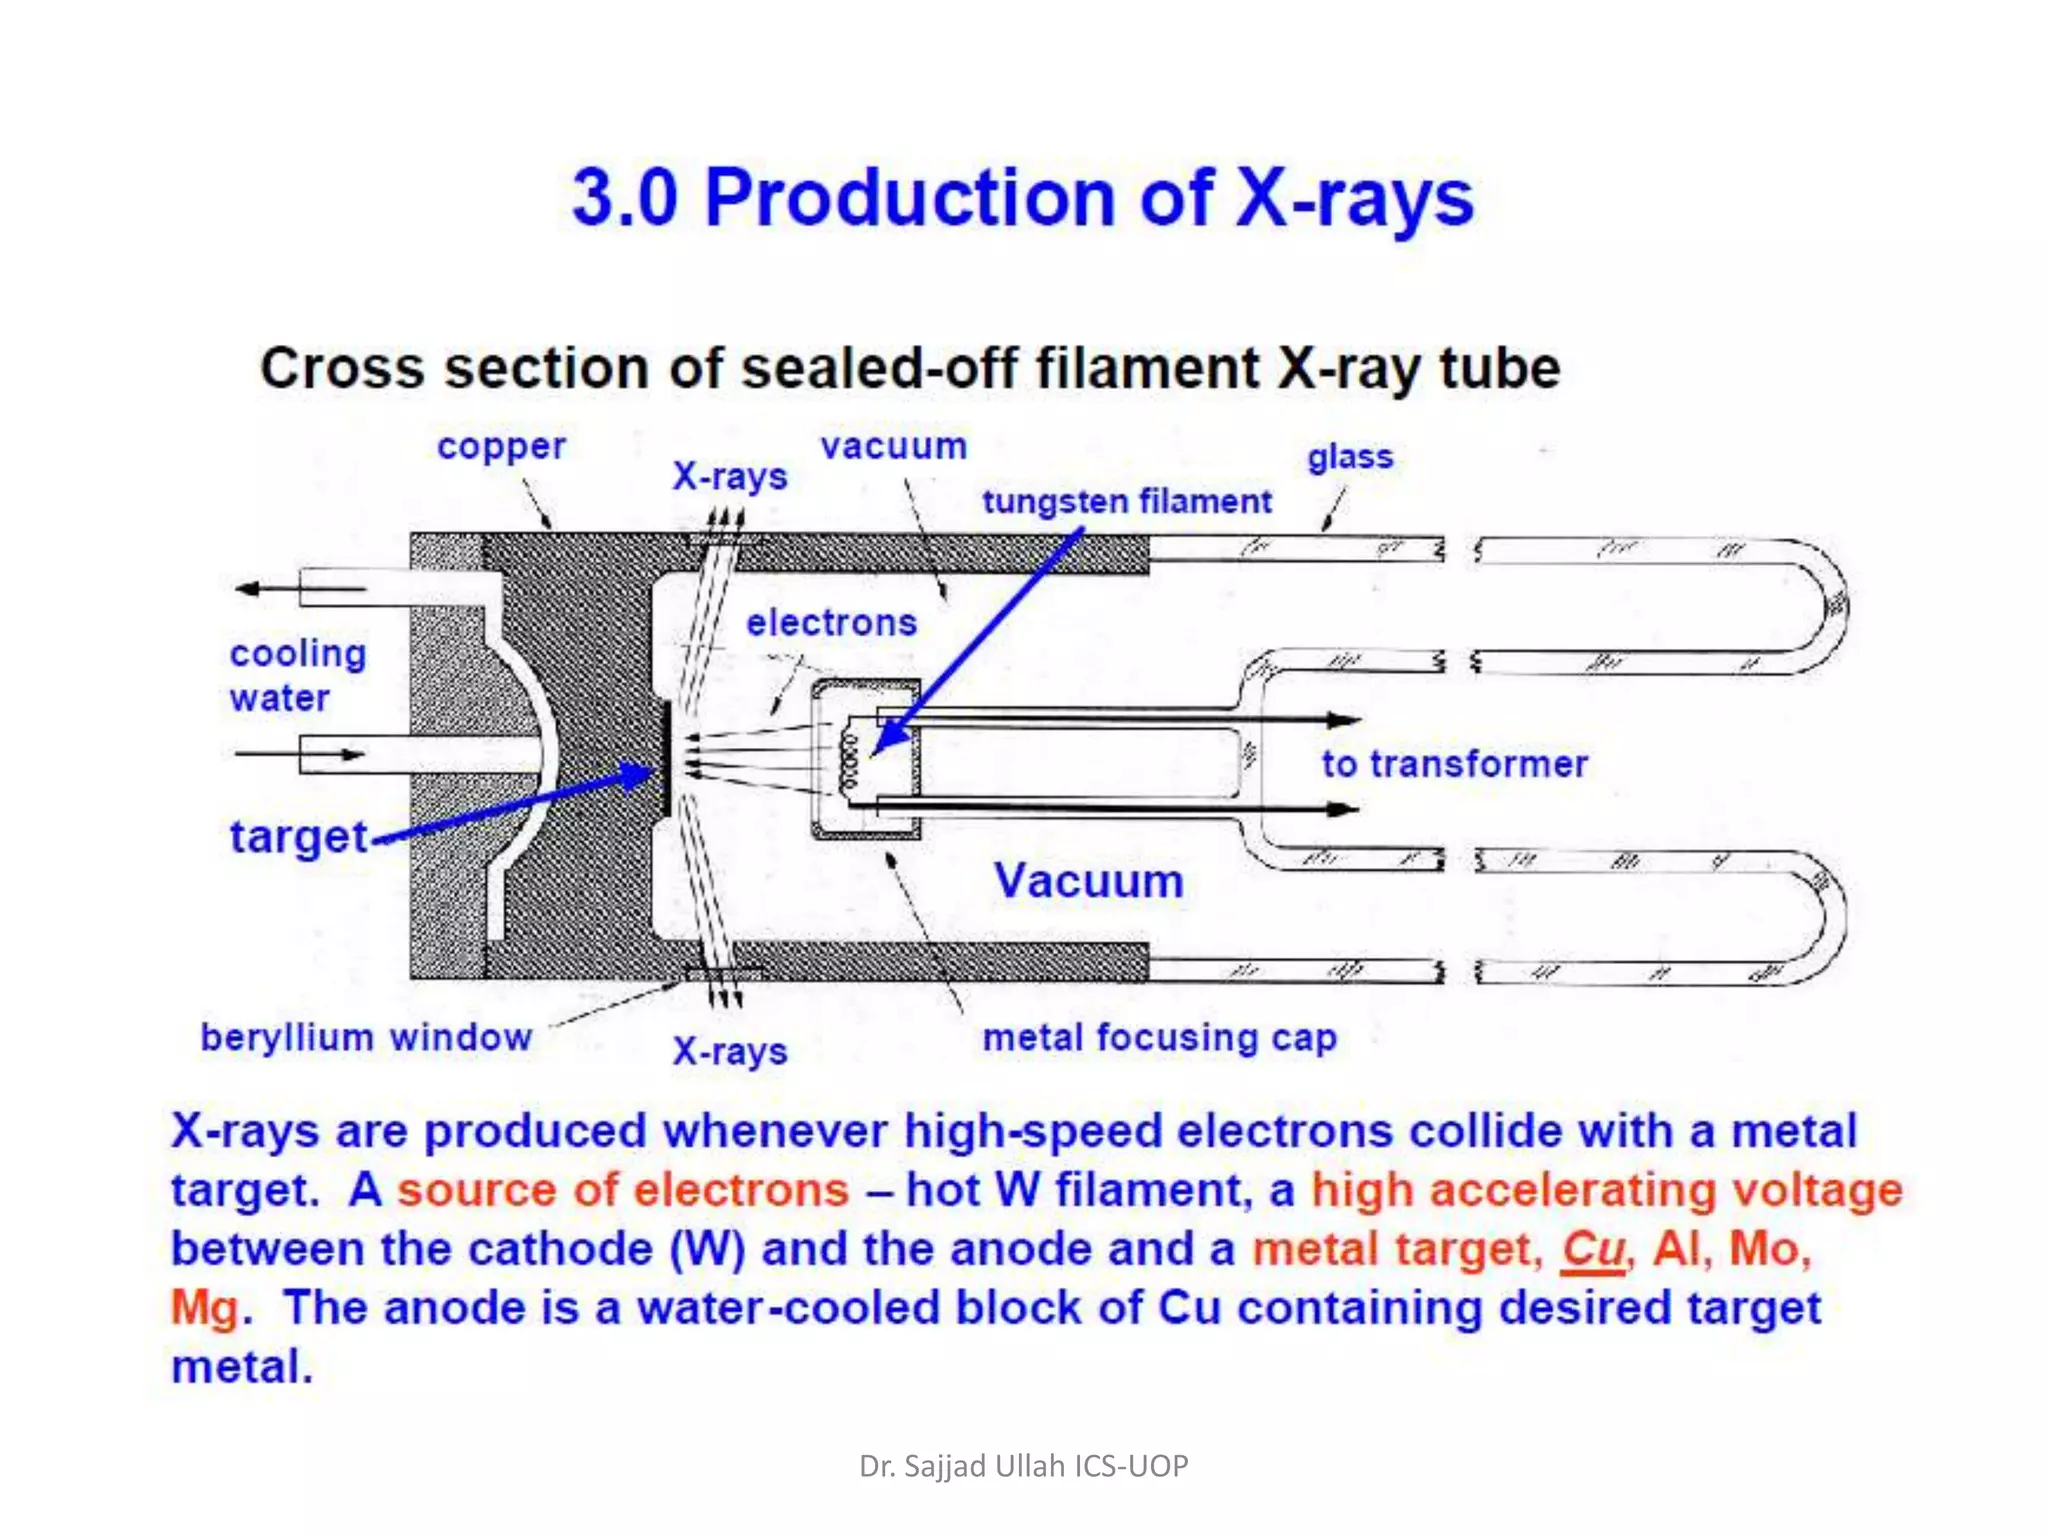
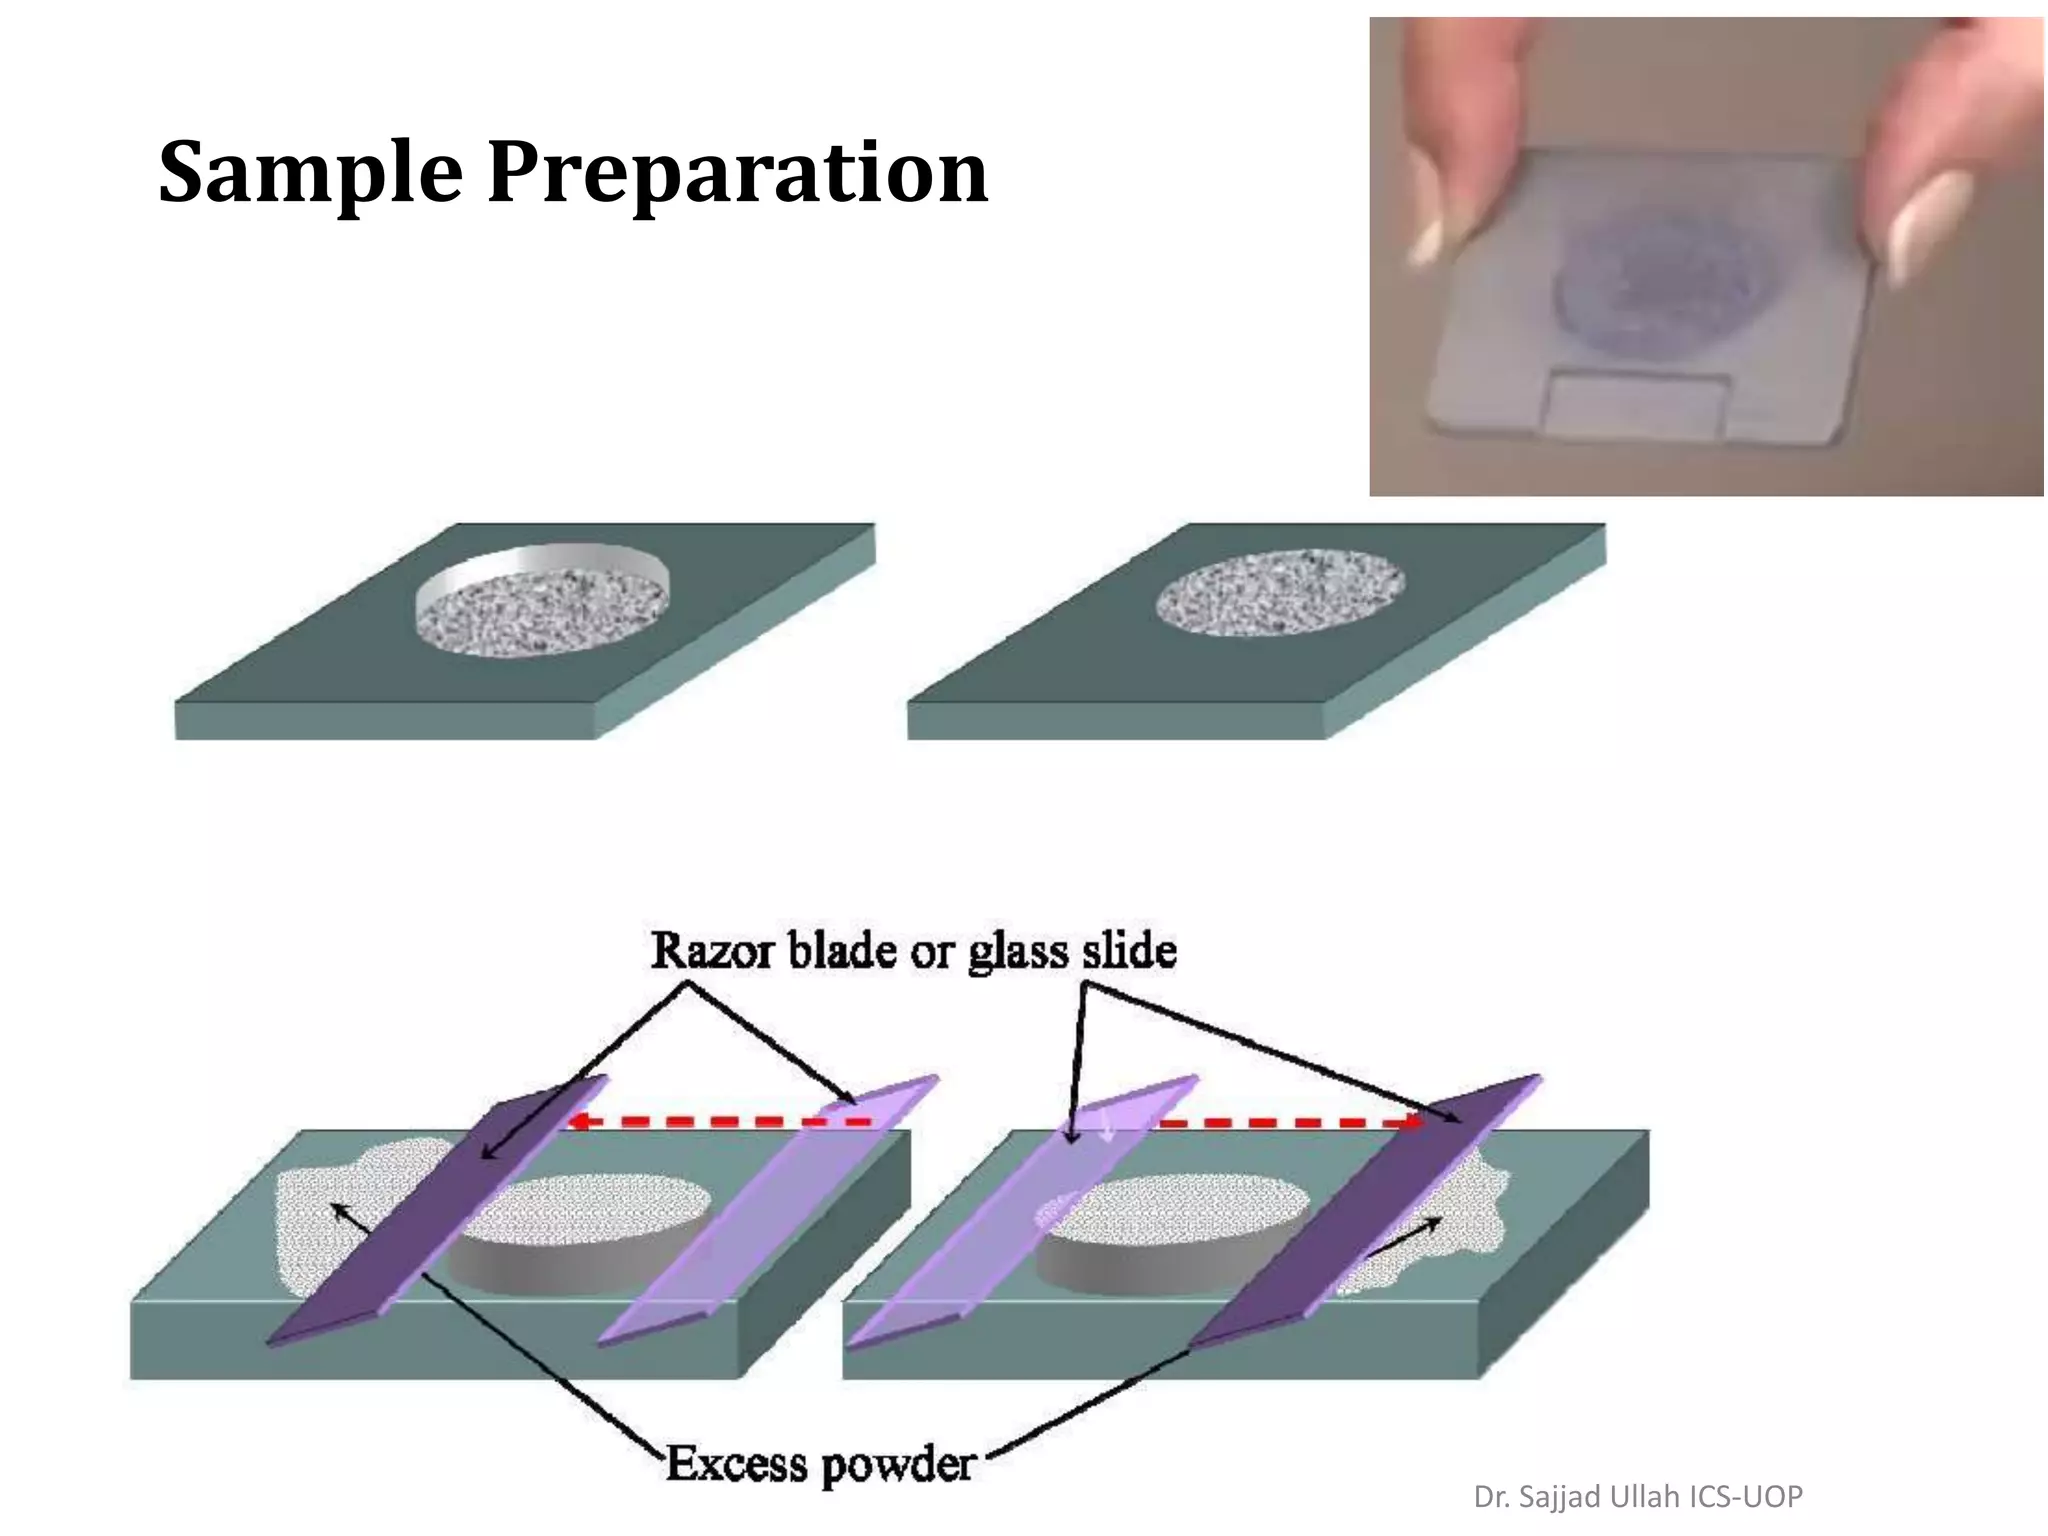
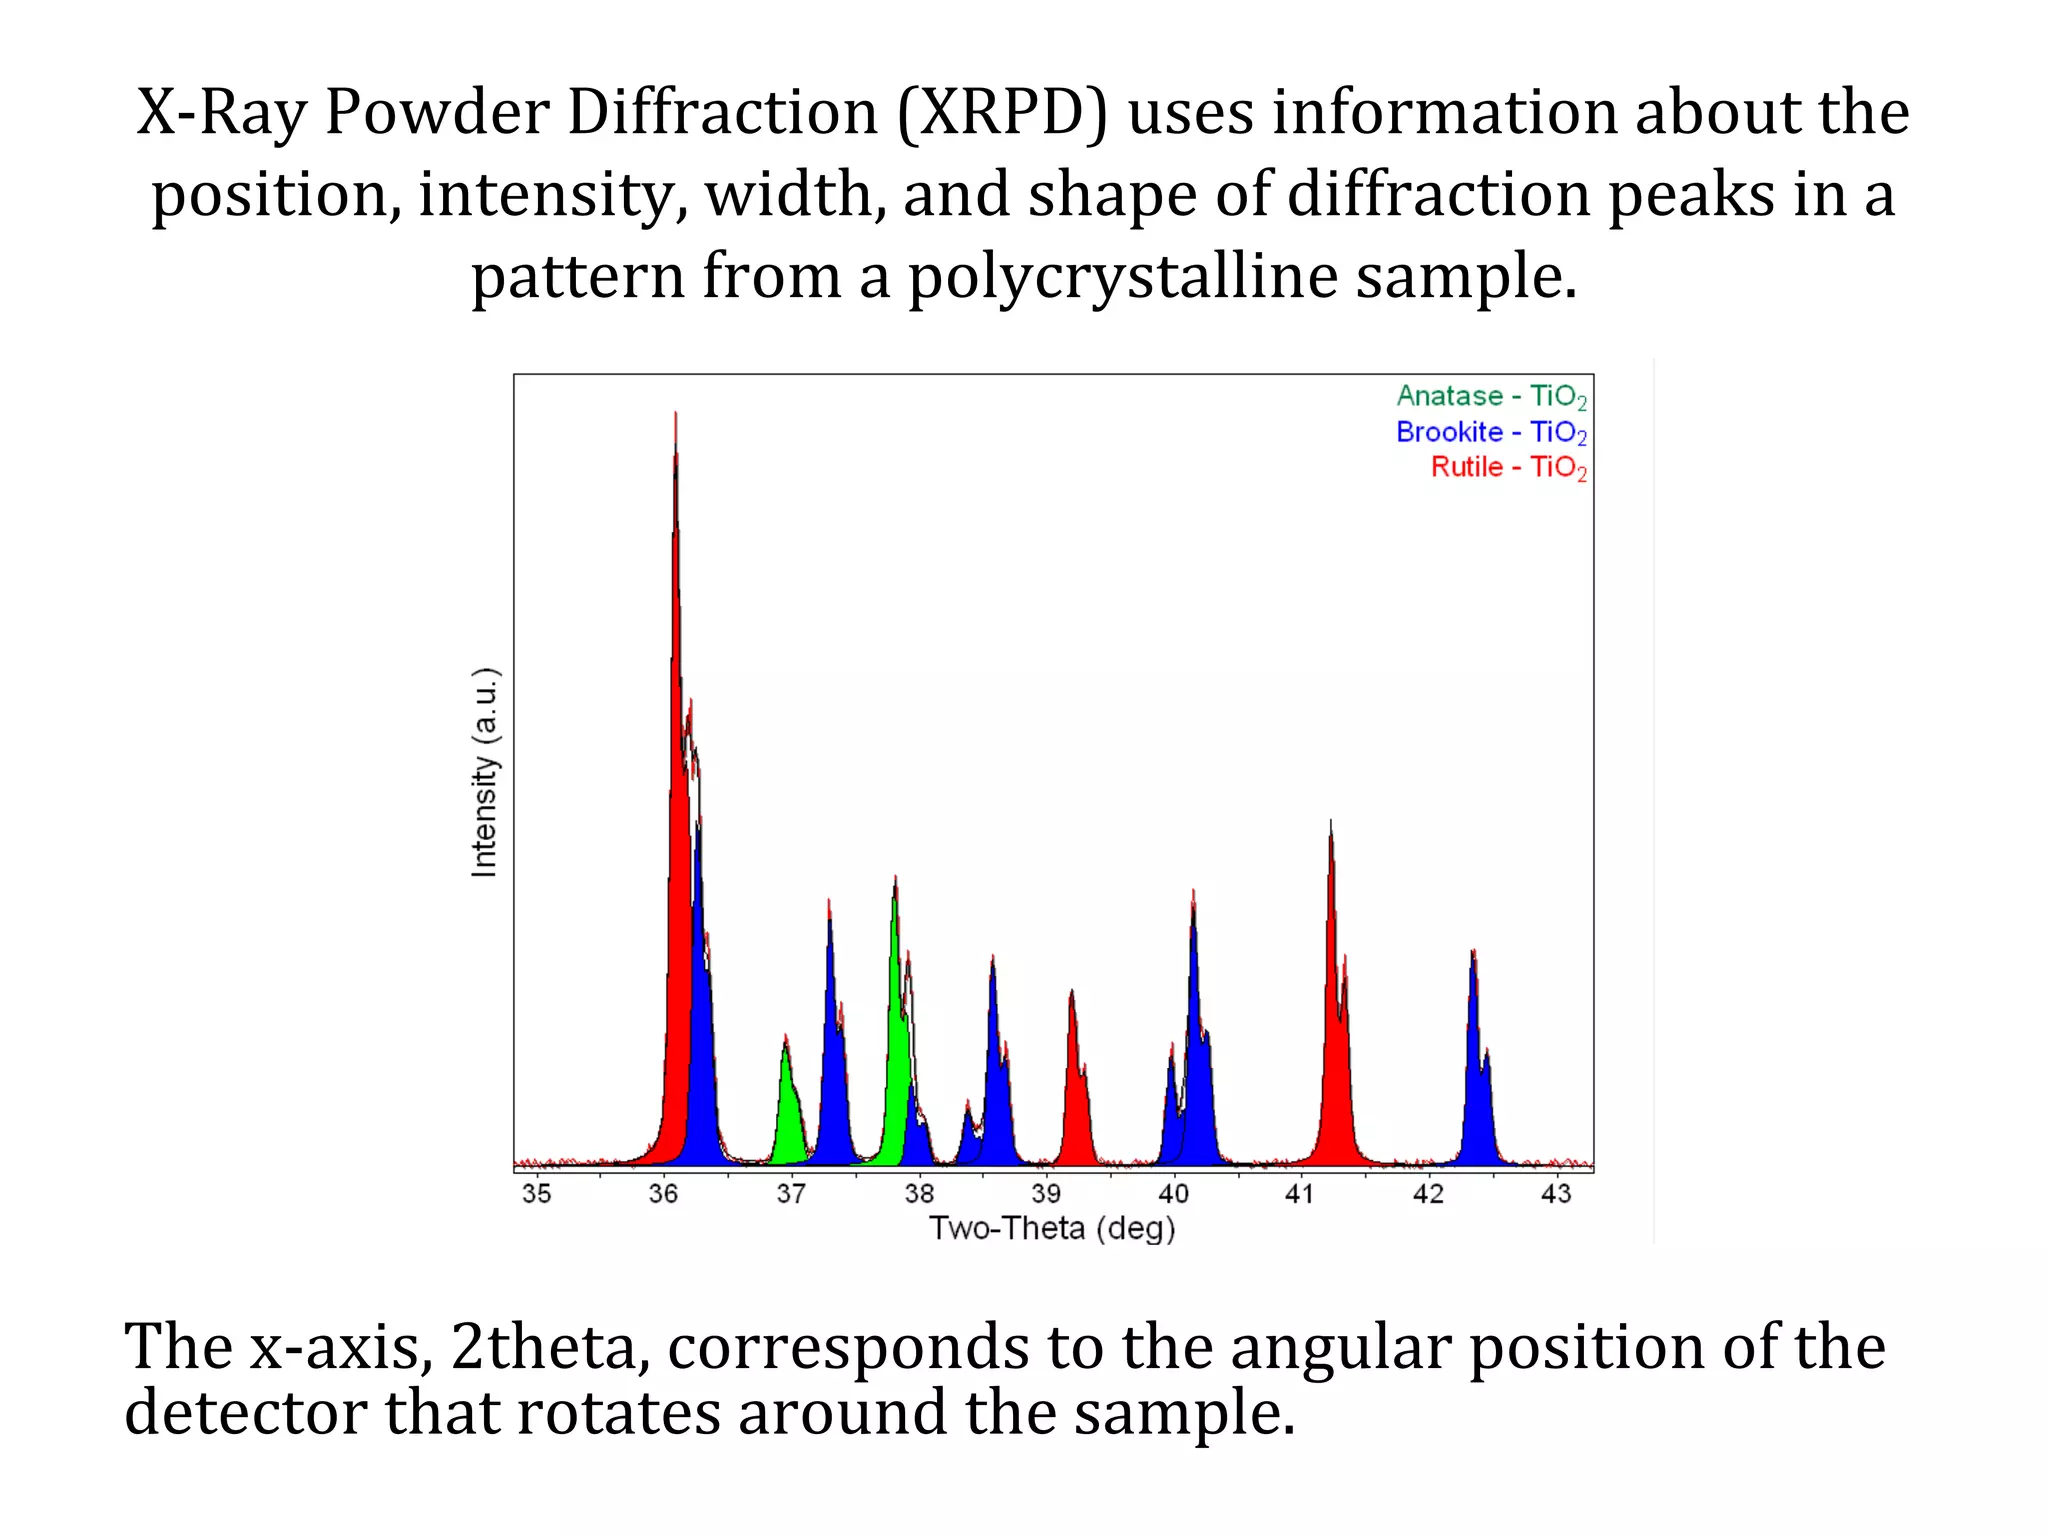
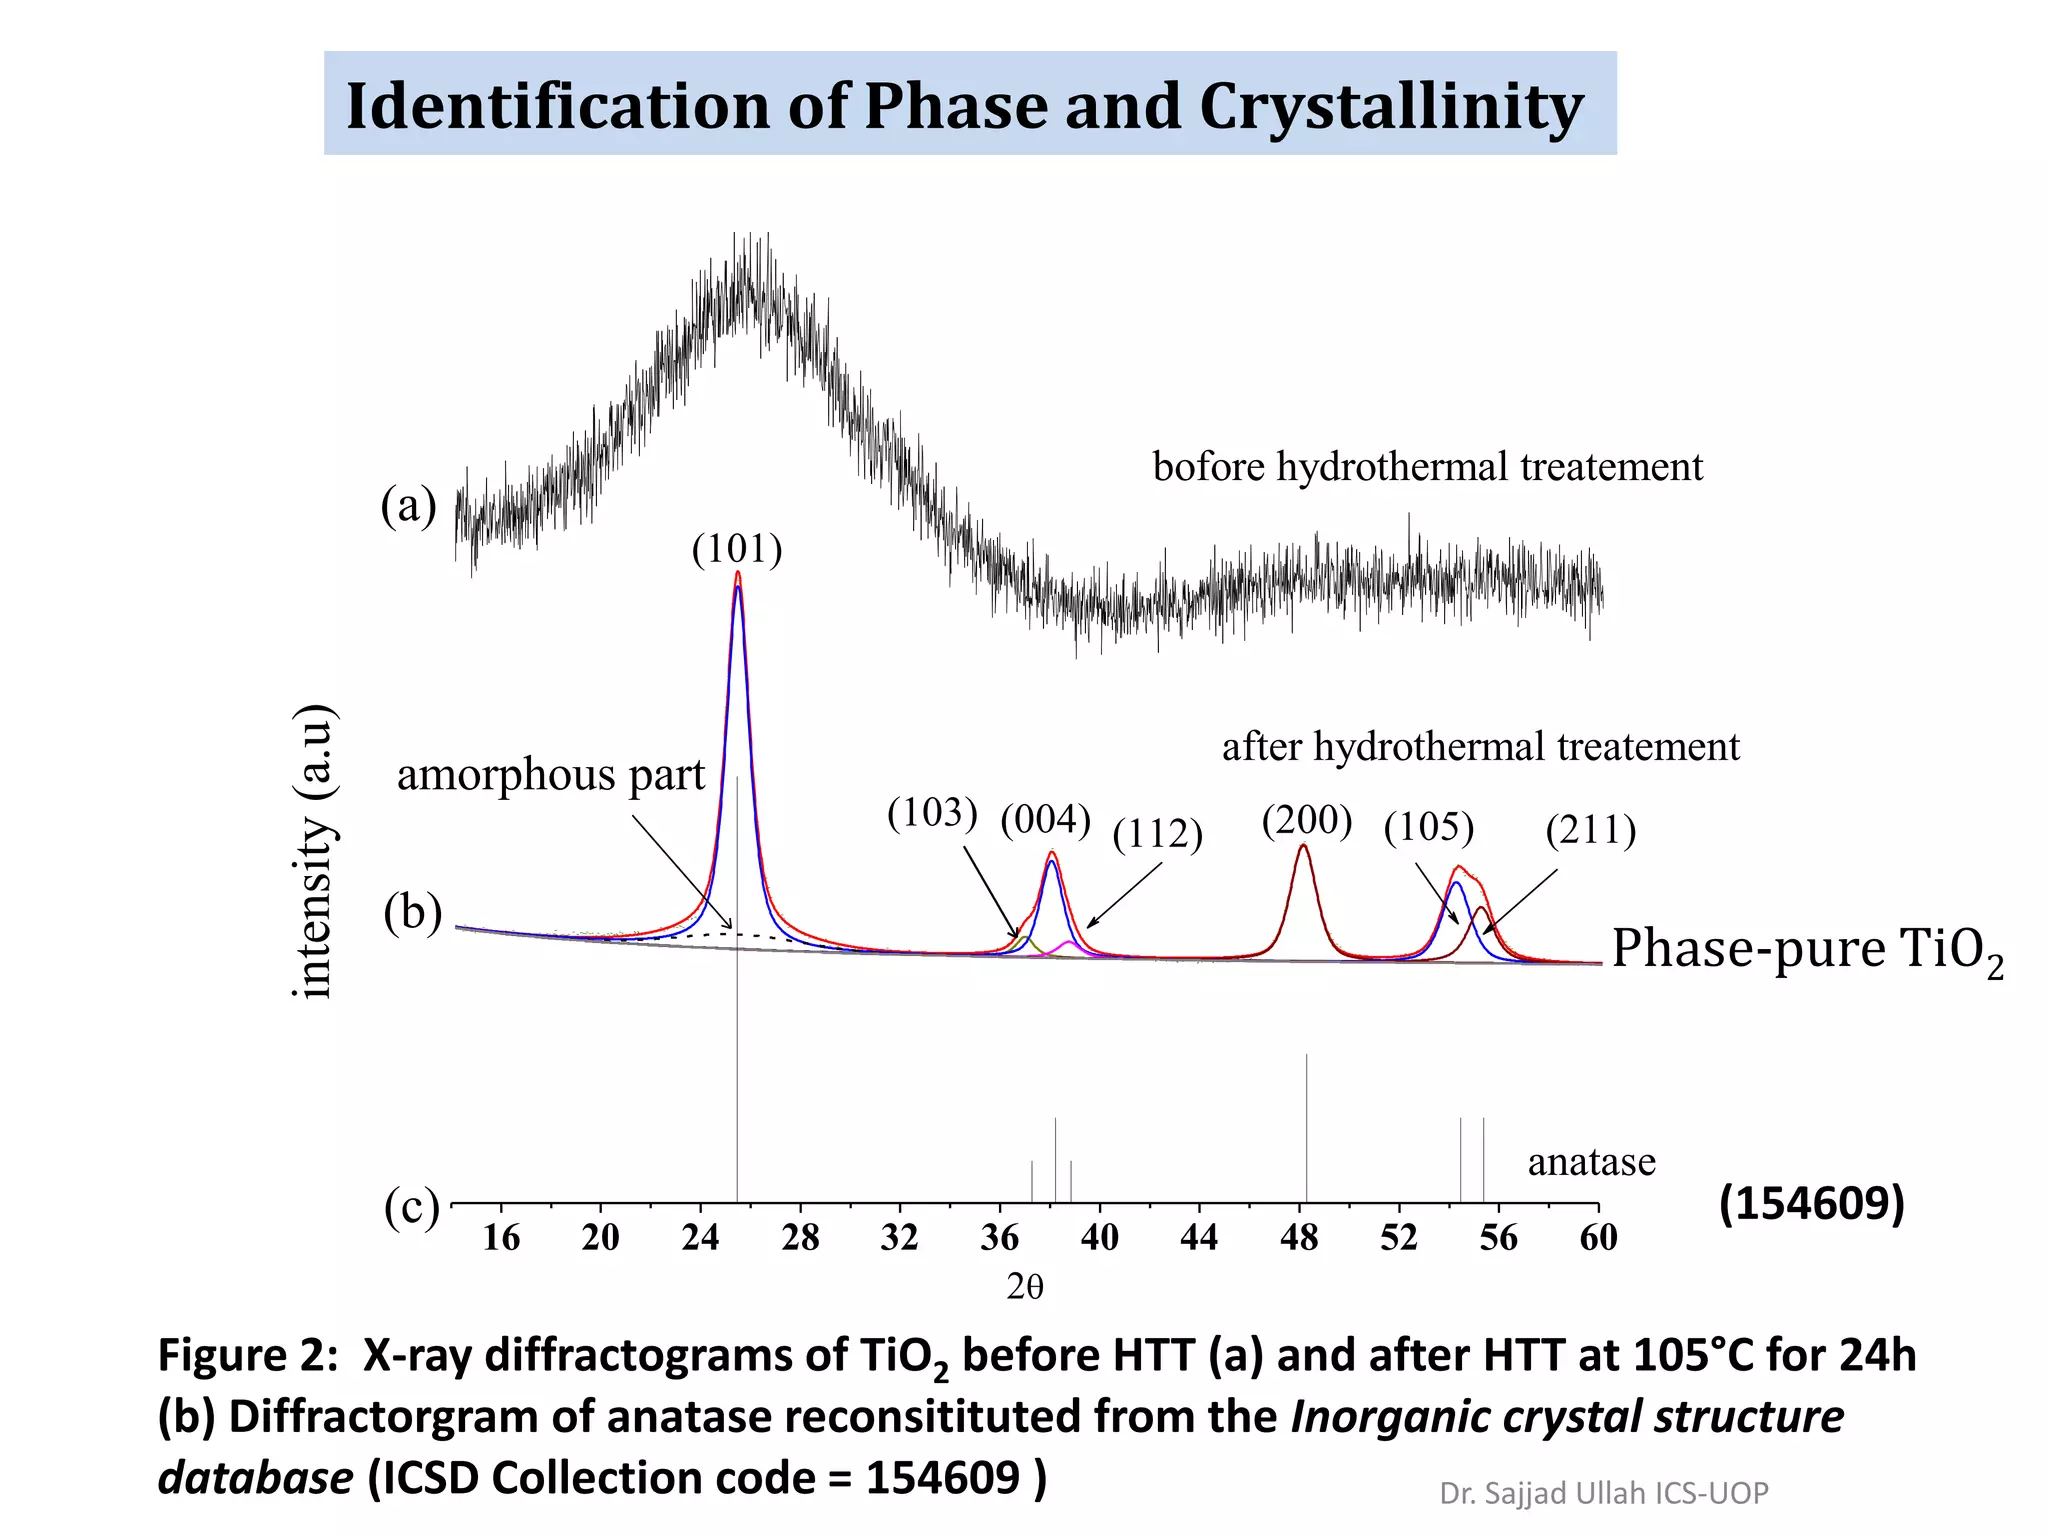
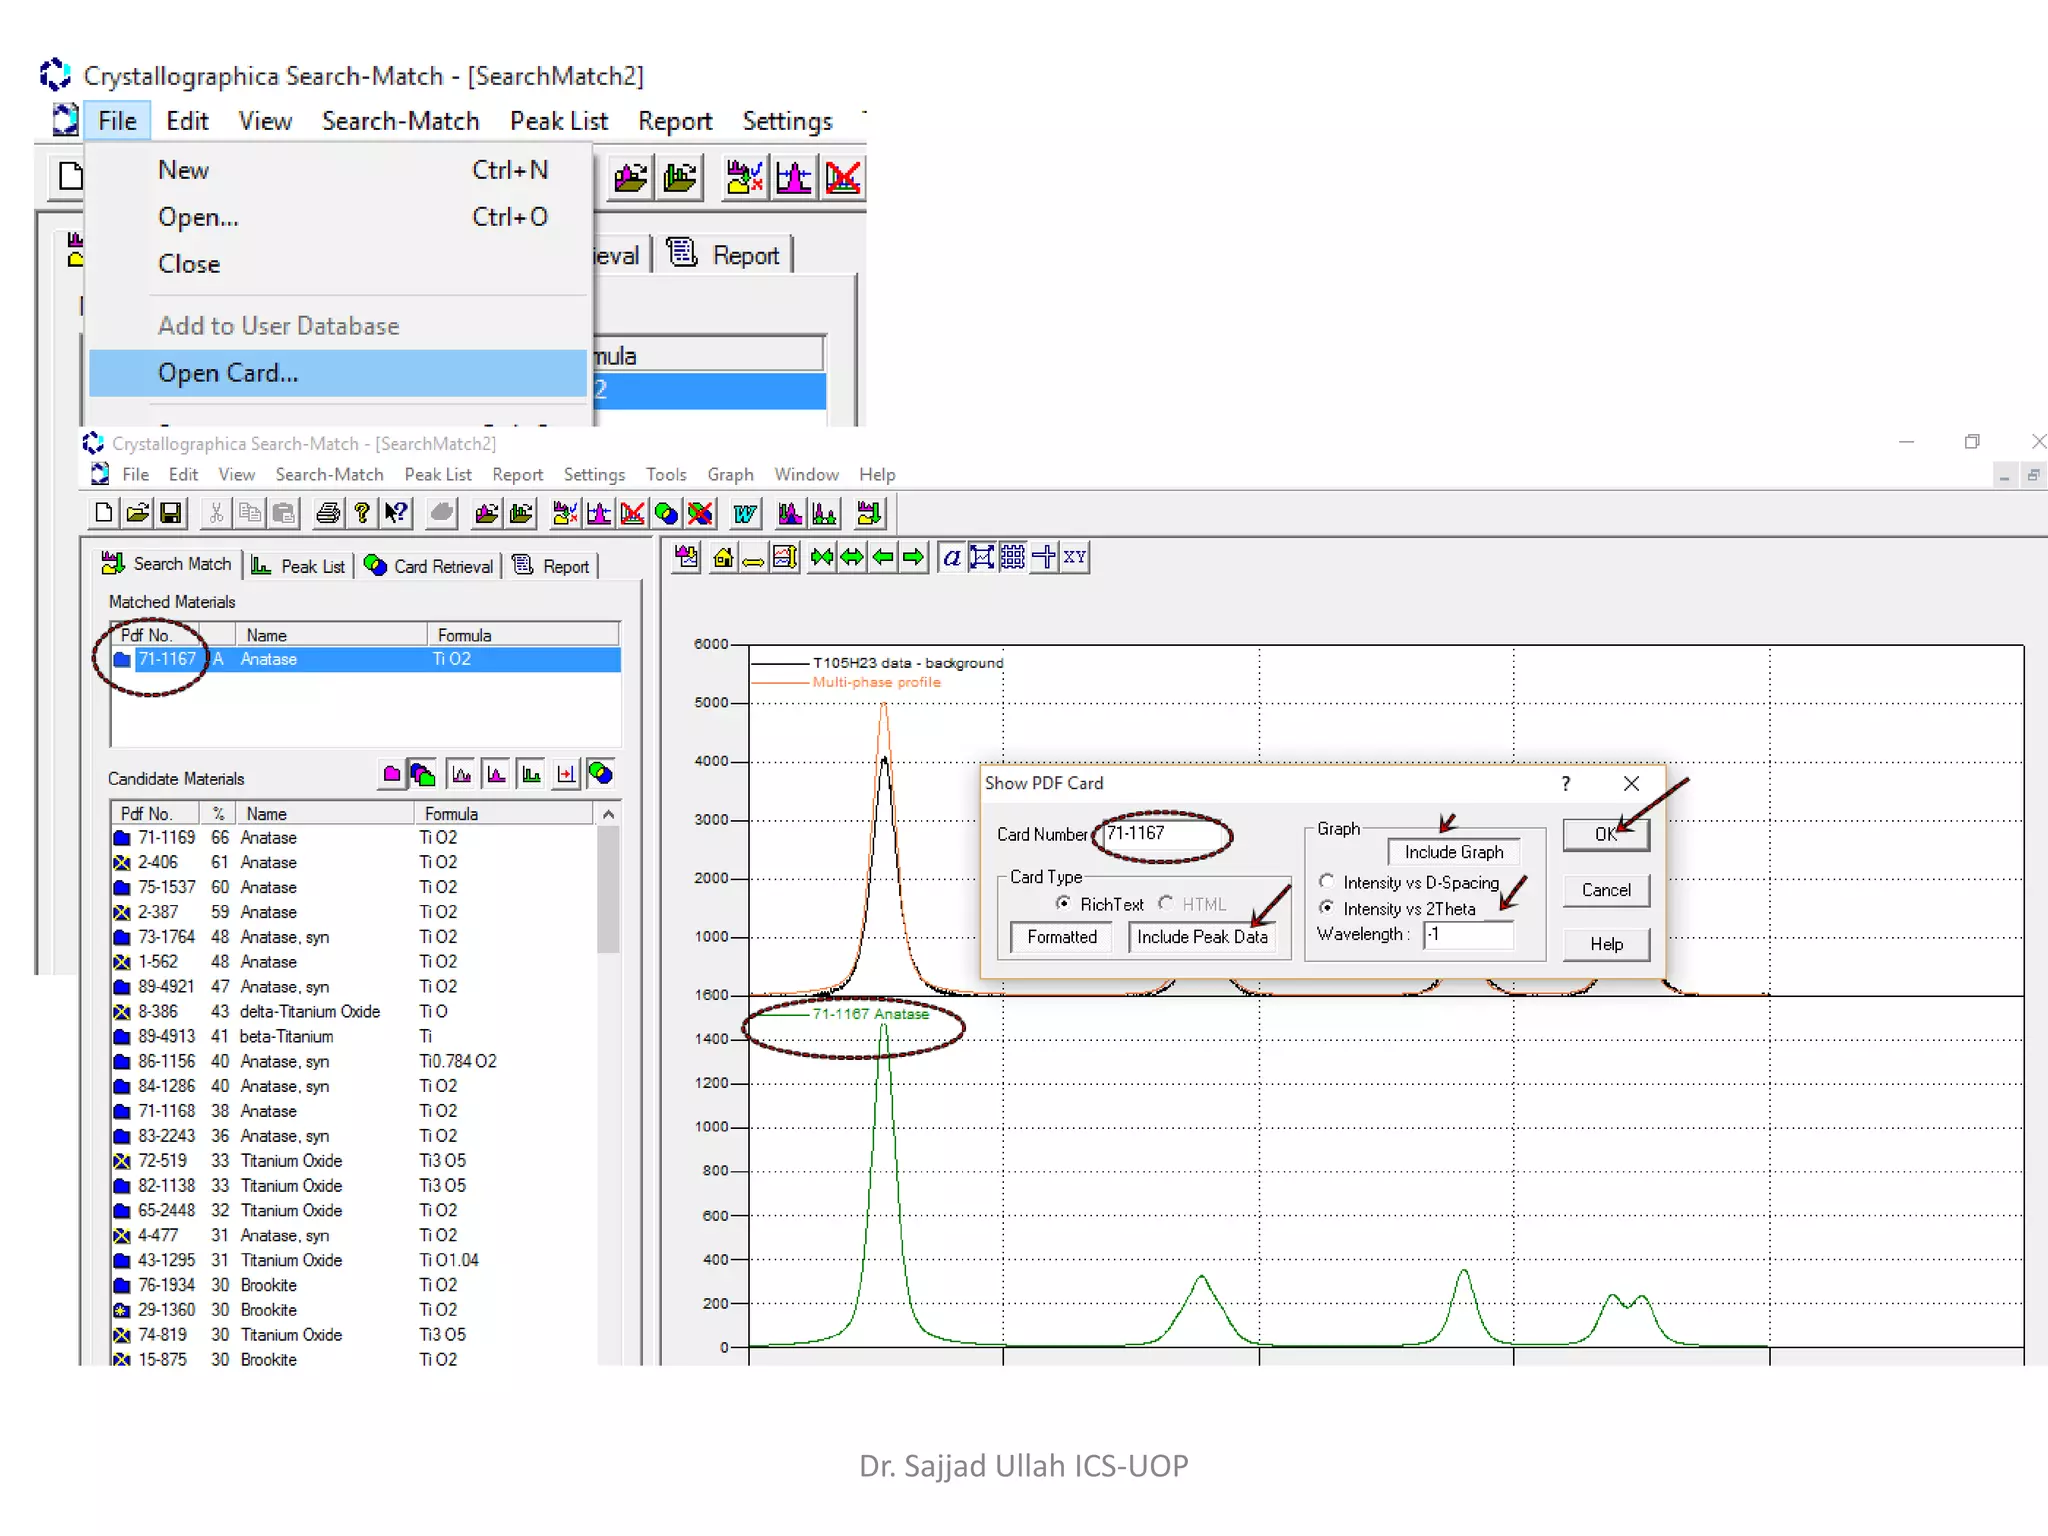
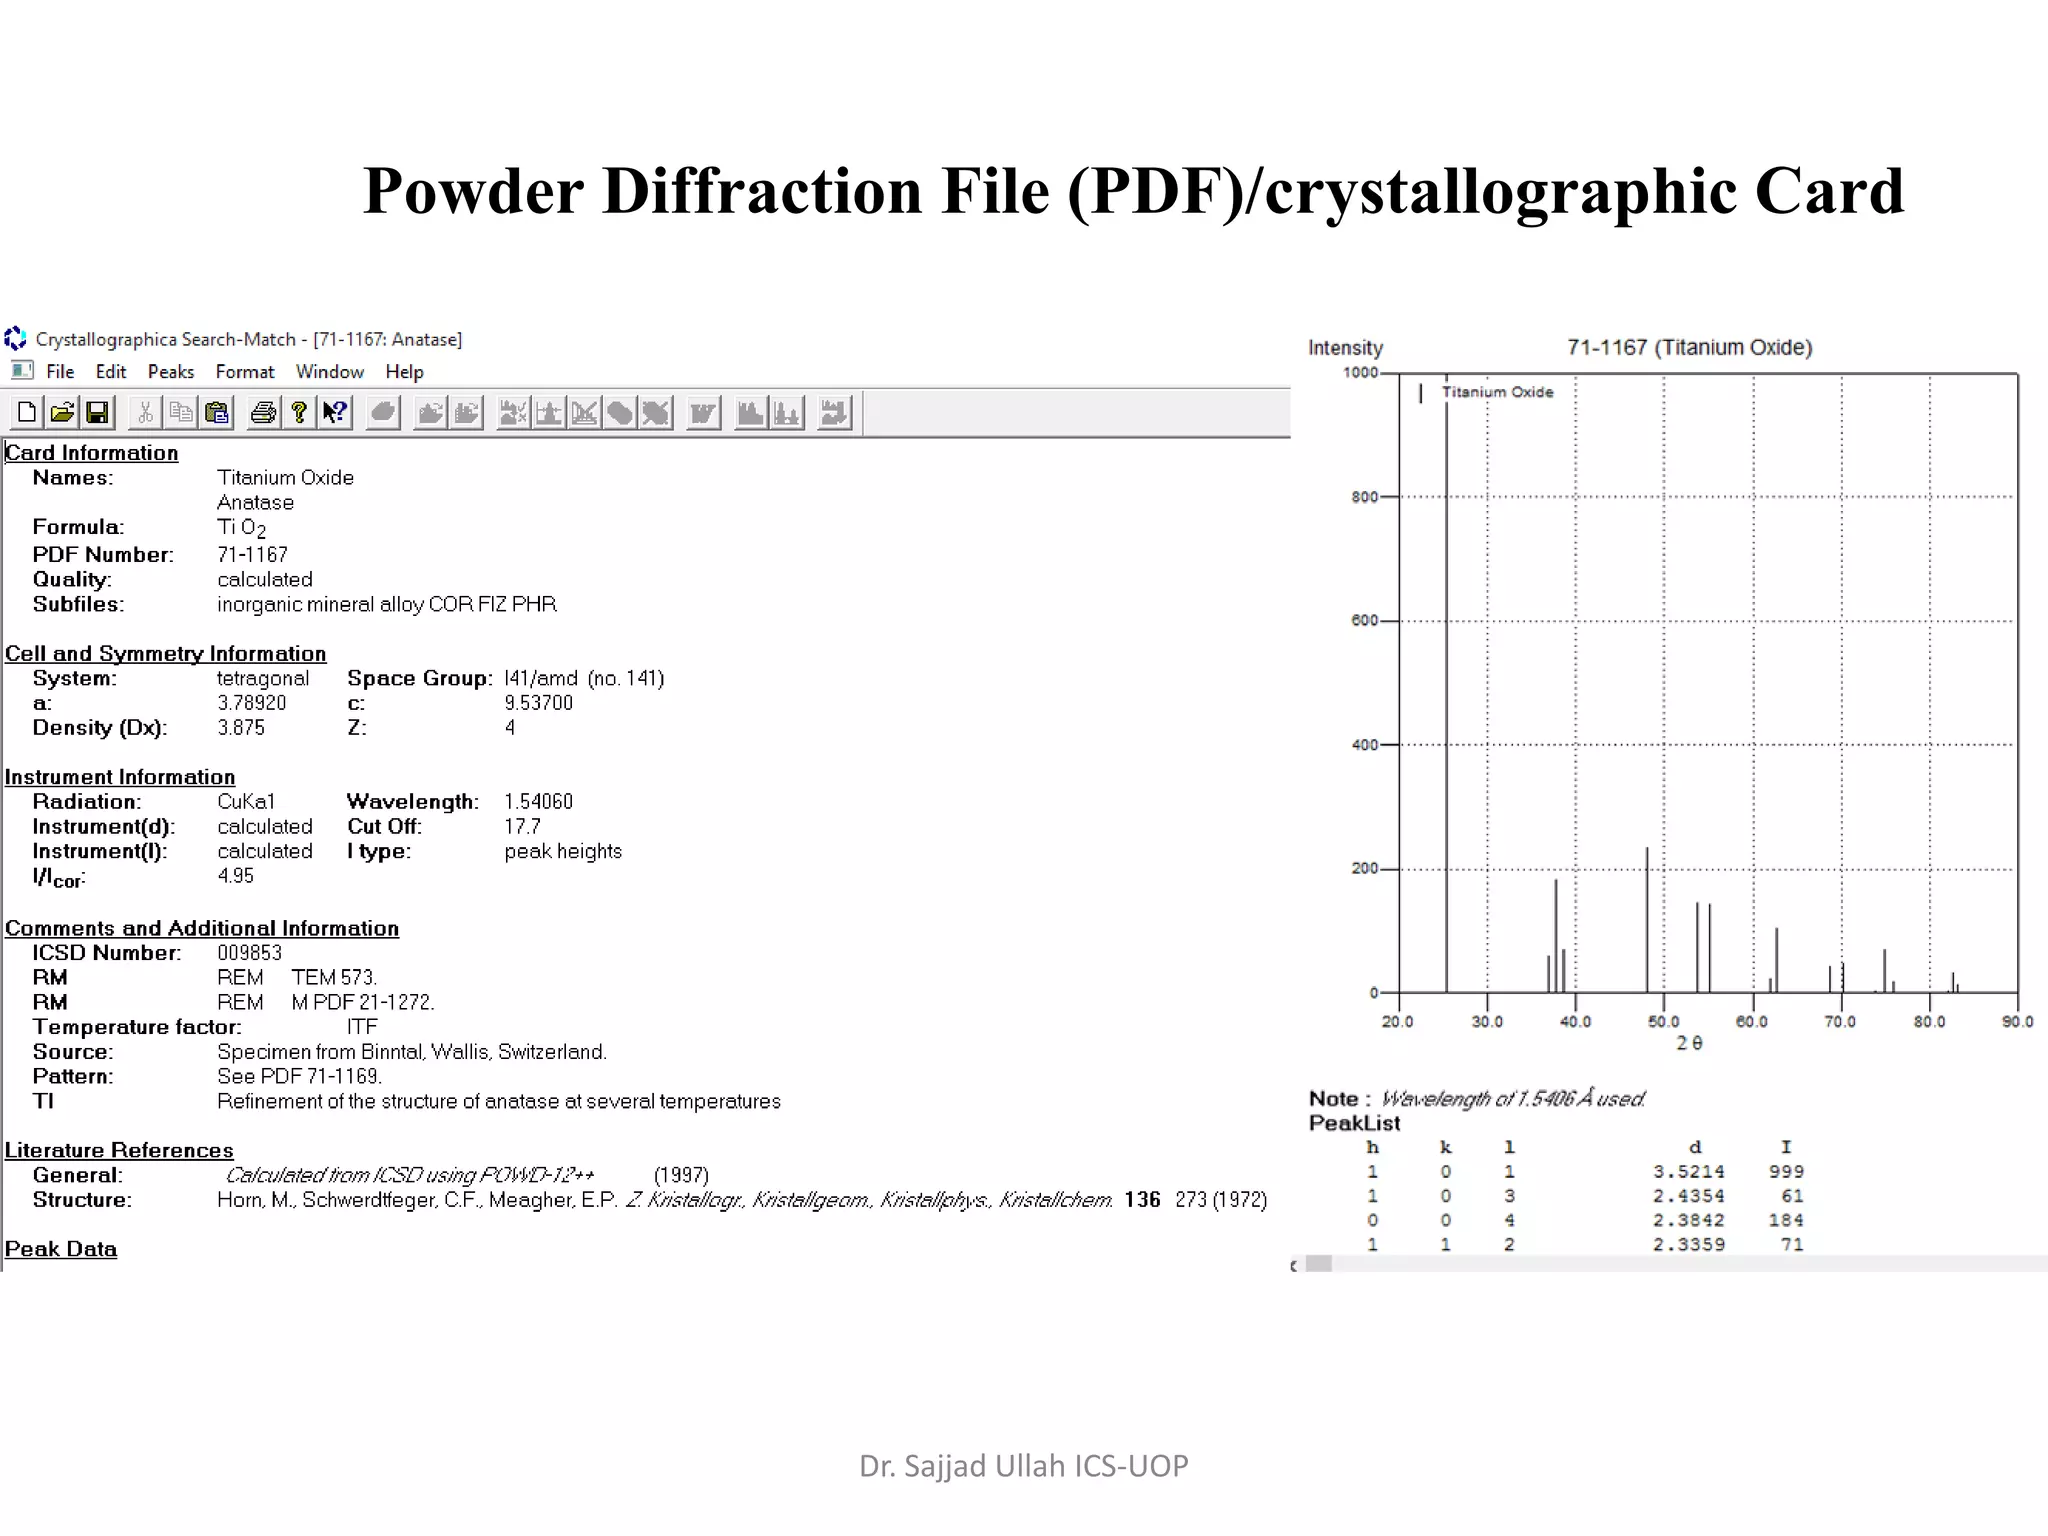
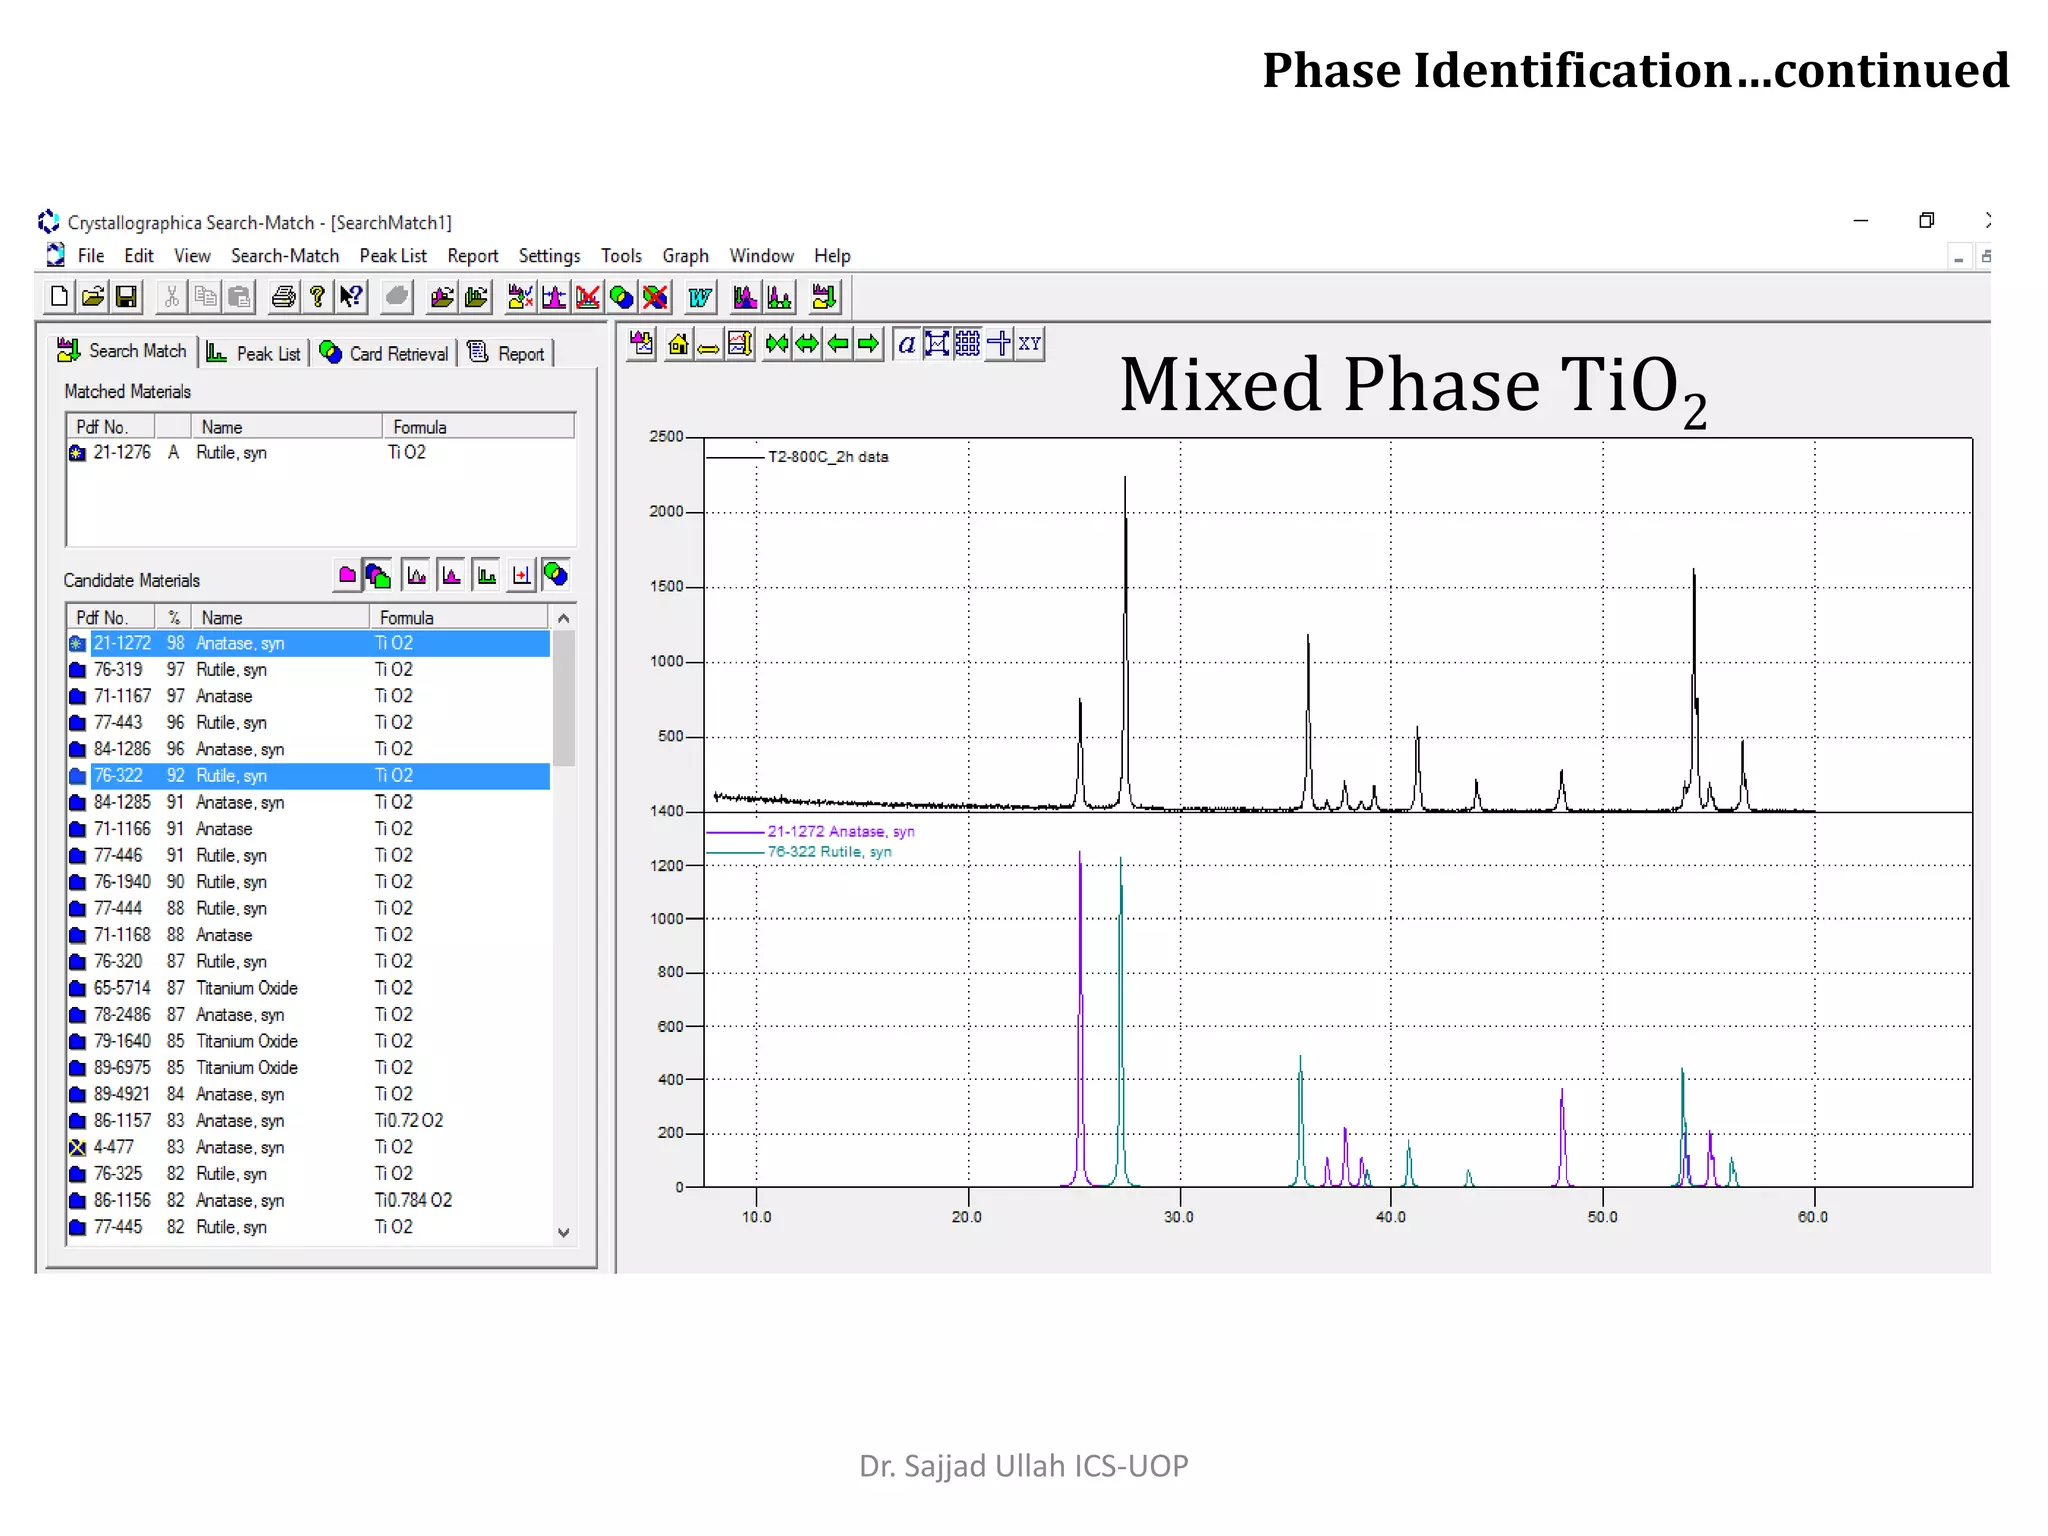
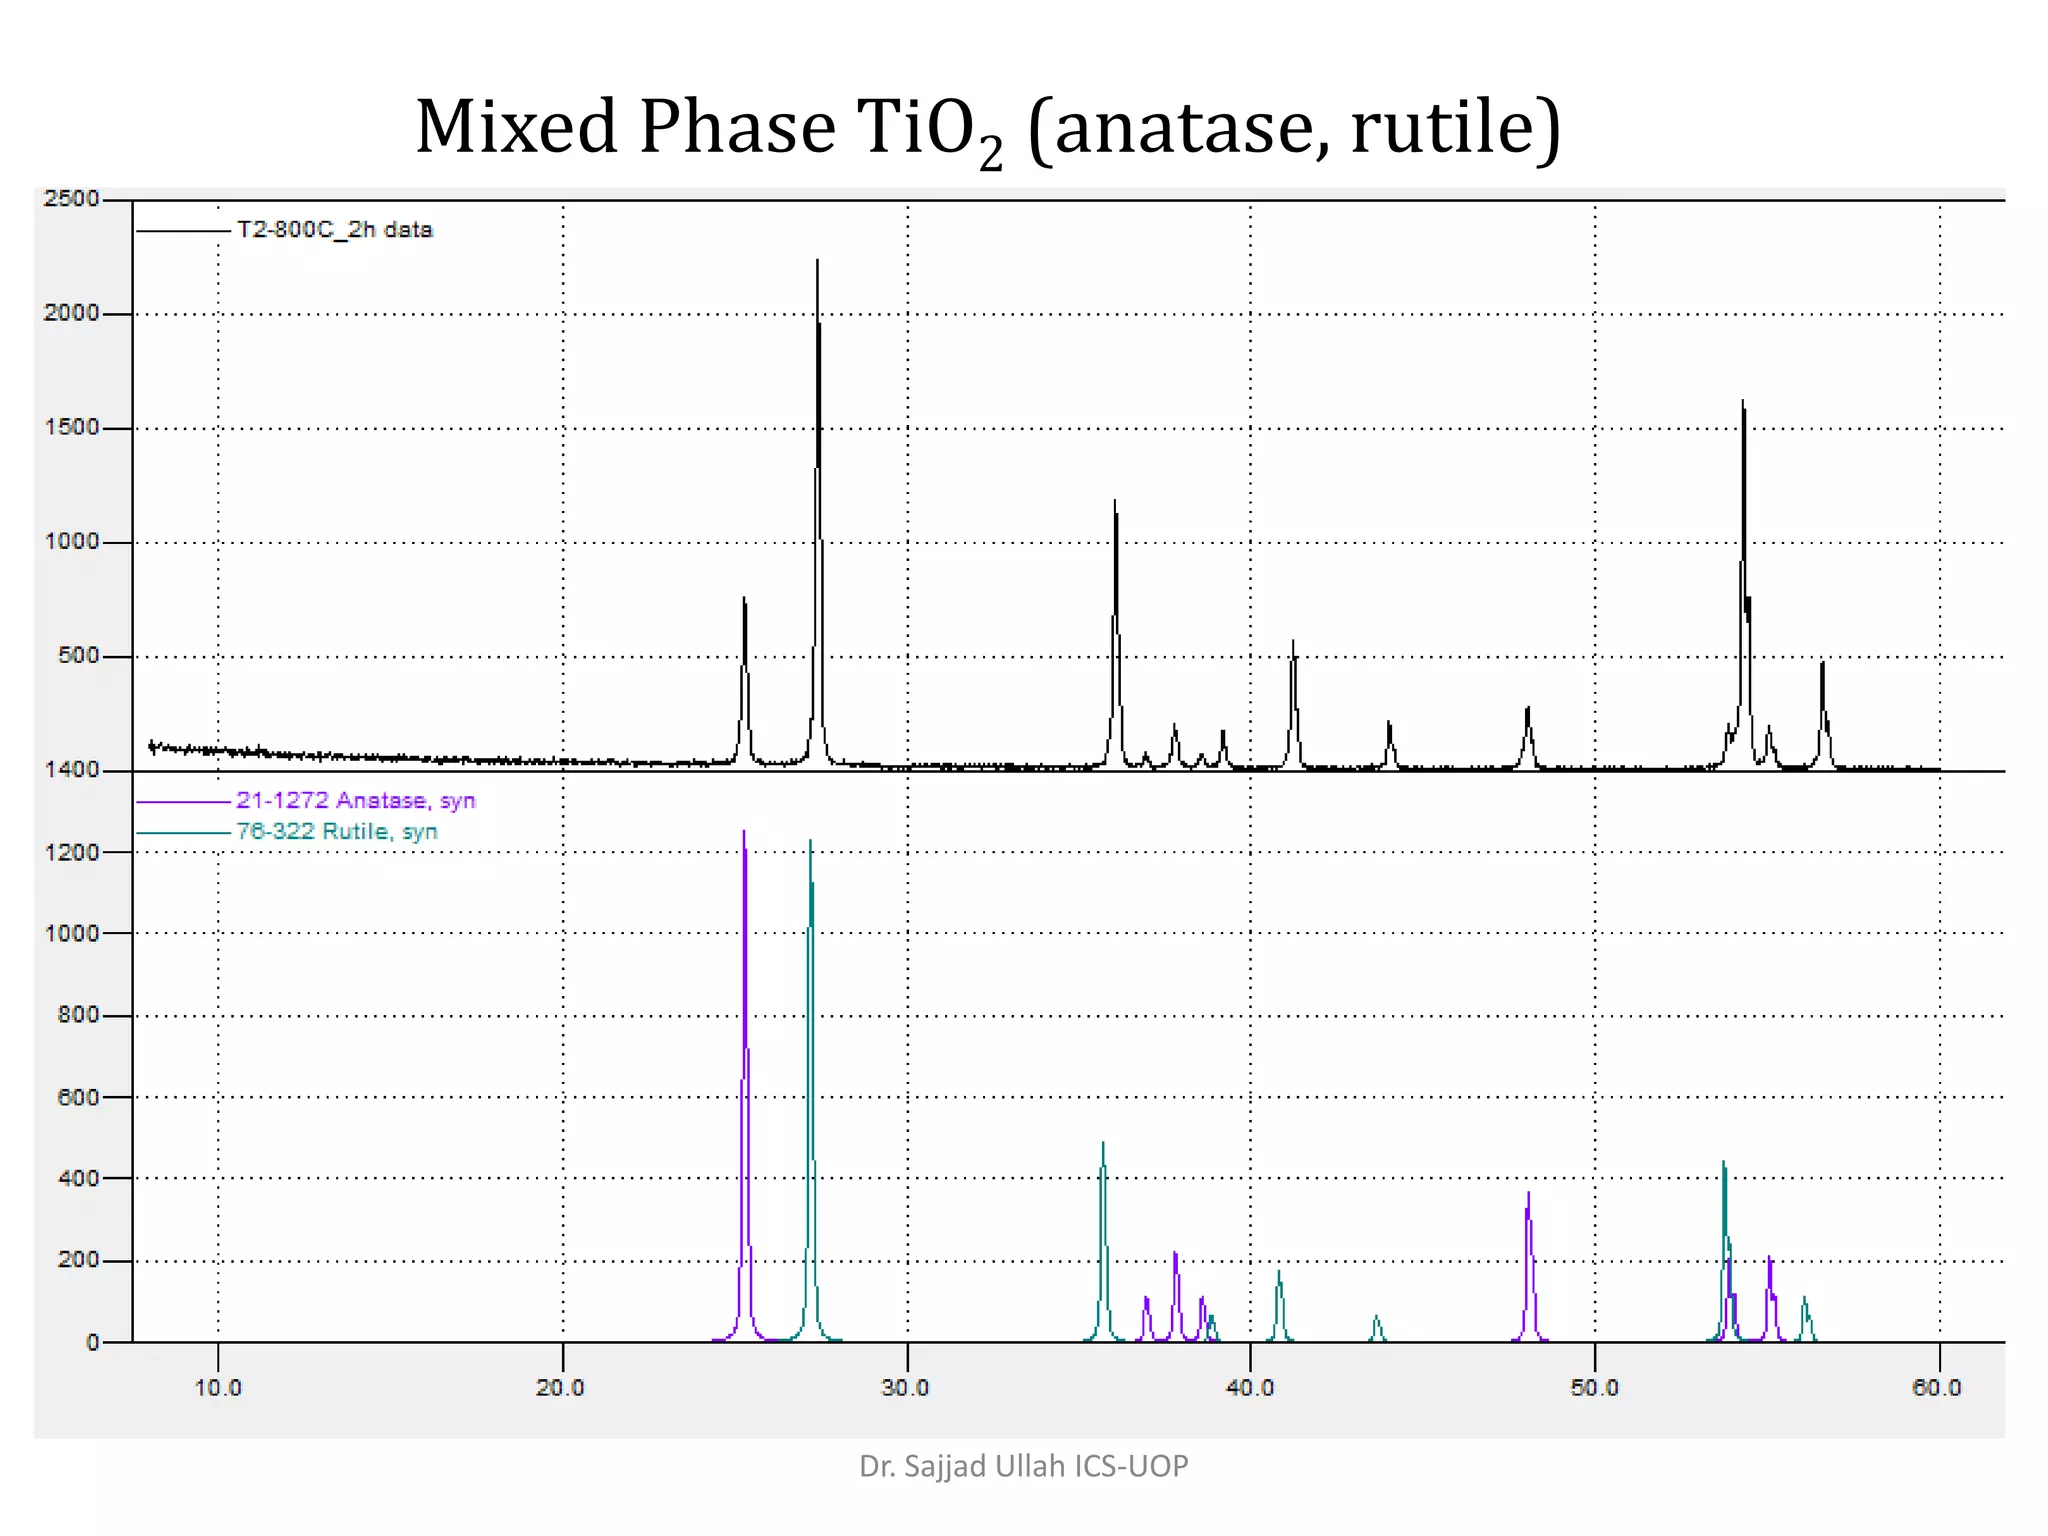
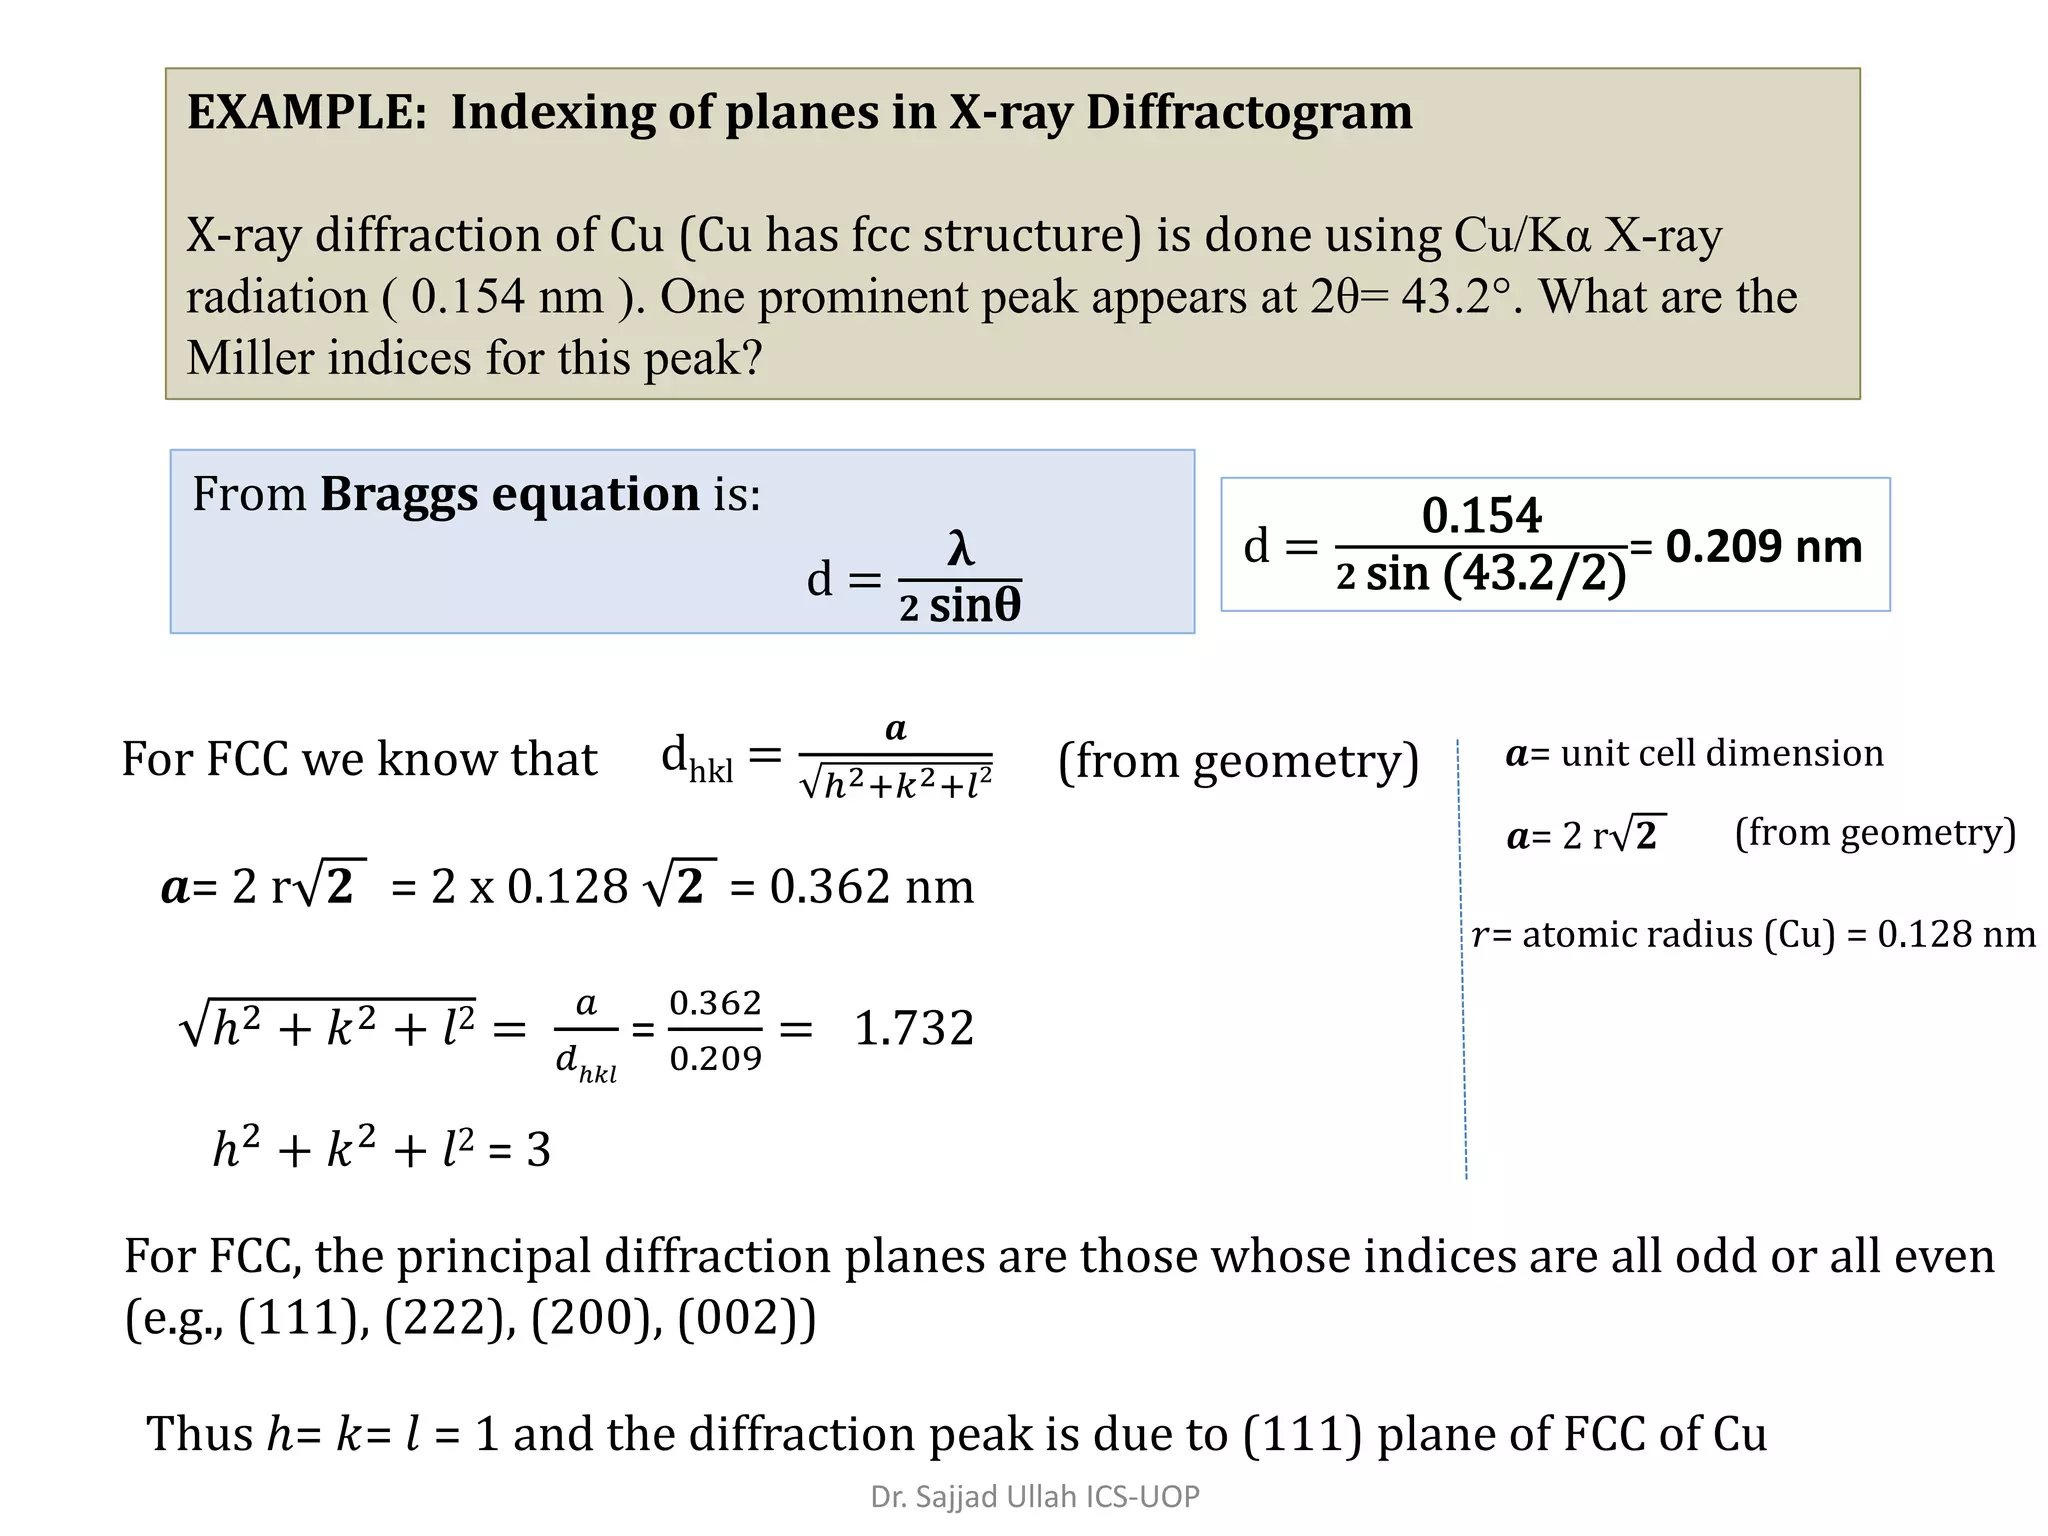
This document discusses the characterization of materials using X-ray diffraction by Dr. Sajjad Ullah of the Institute of Chemical Sciences, University of Peshawar. It covers topics such as X-ray production, sample preparation, Bragg's law, interference upon scattering, XRD analysis including crystallinity determination, phase identification using search-match software, crystallite size estimation using Scherrer's formula, unit cell determination from diffraction data, and indexing of diffraction peaks. Examples are provided to demonstrate the application of these XRD techniques.
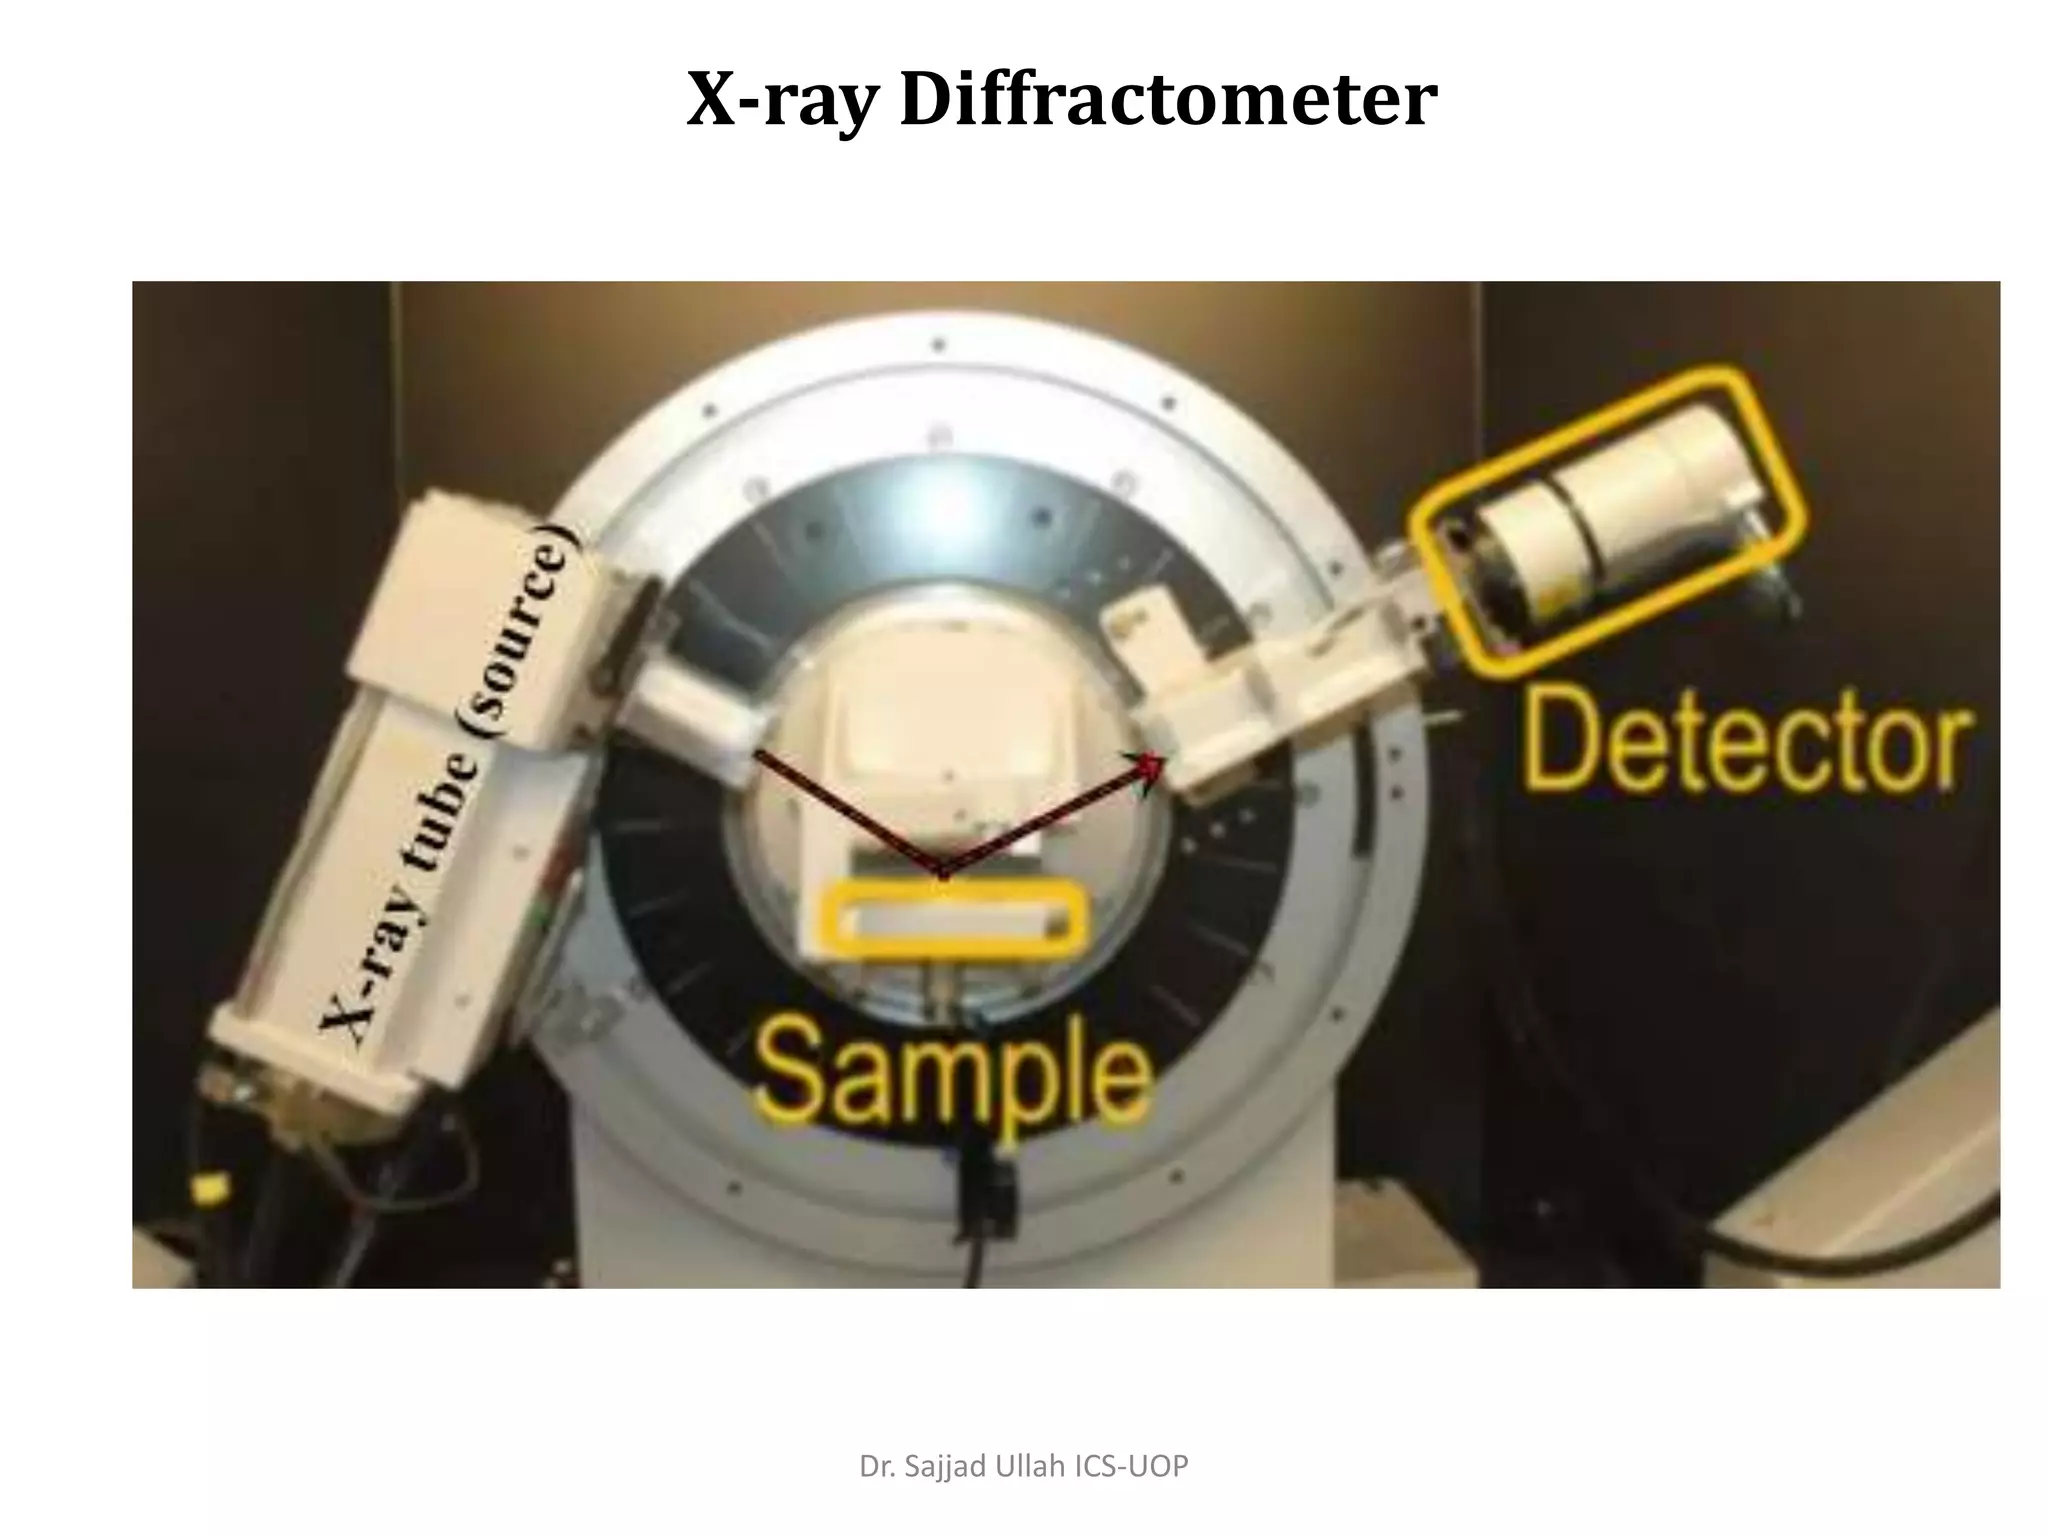
Overview of XRD for material characterization and sample preparation by Dr. Sajjad Ullah.
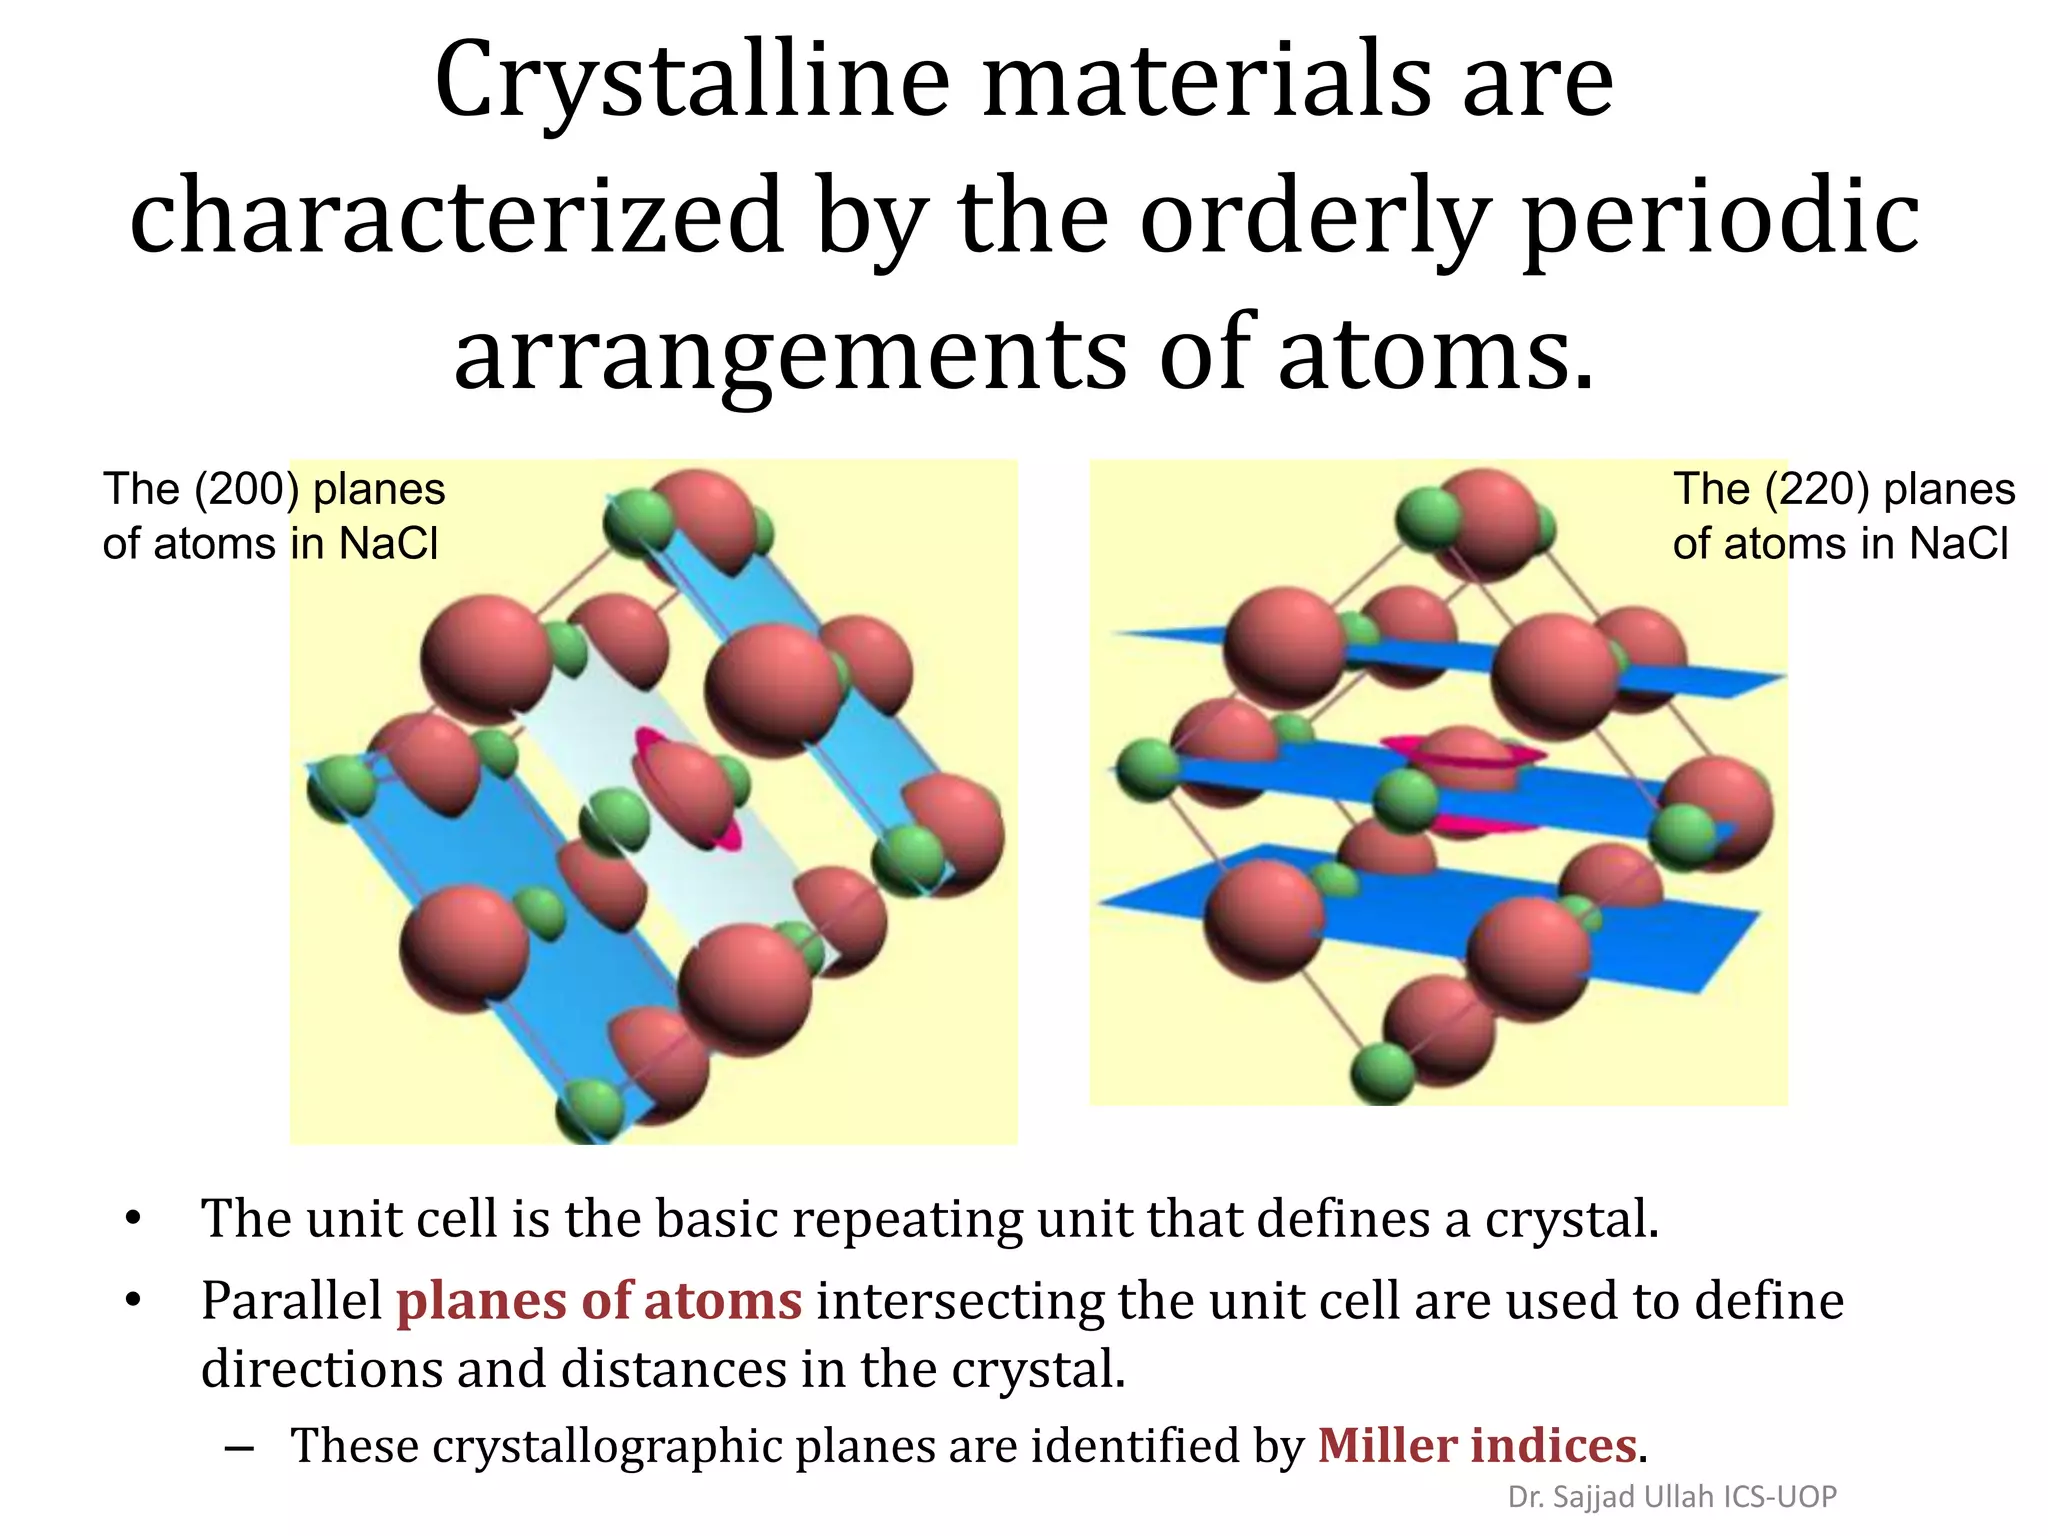
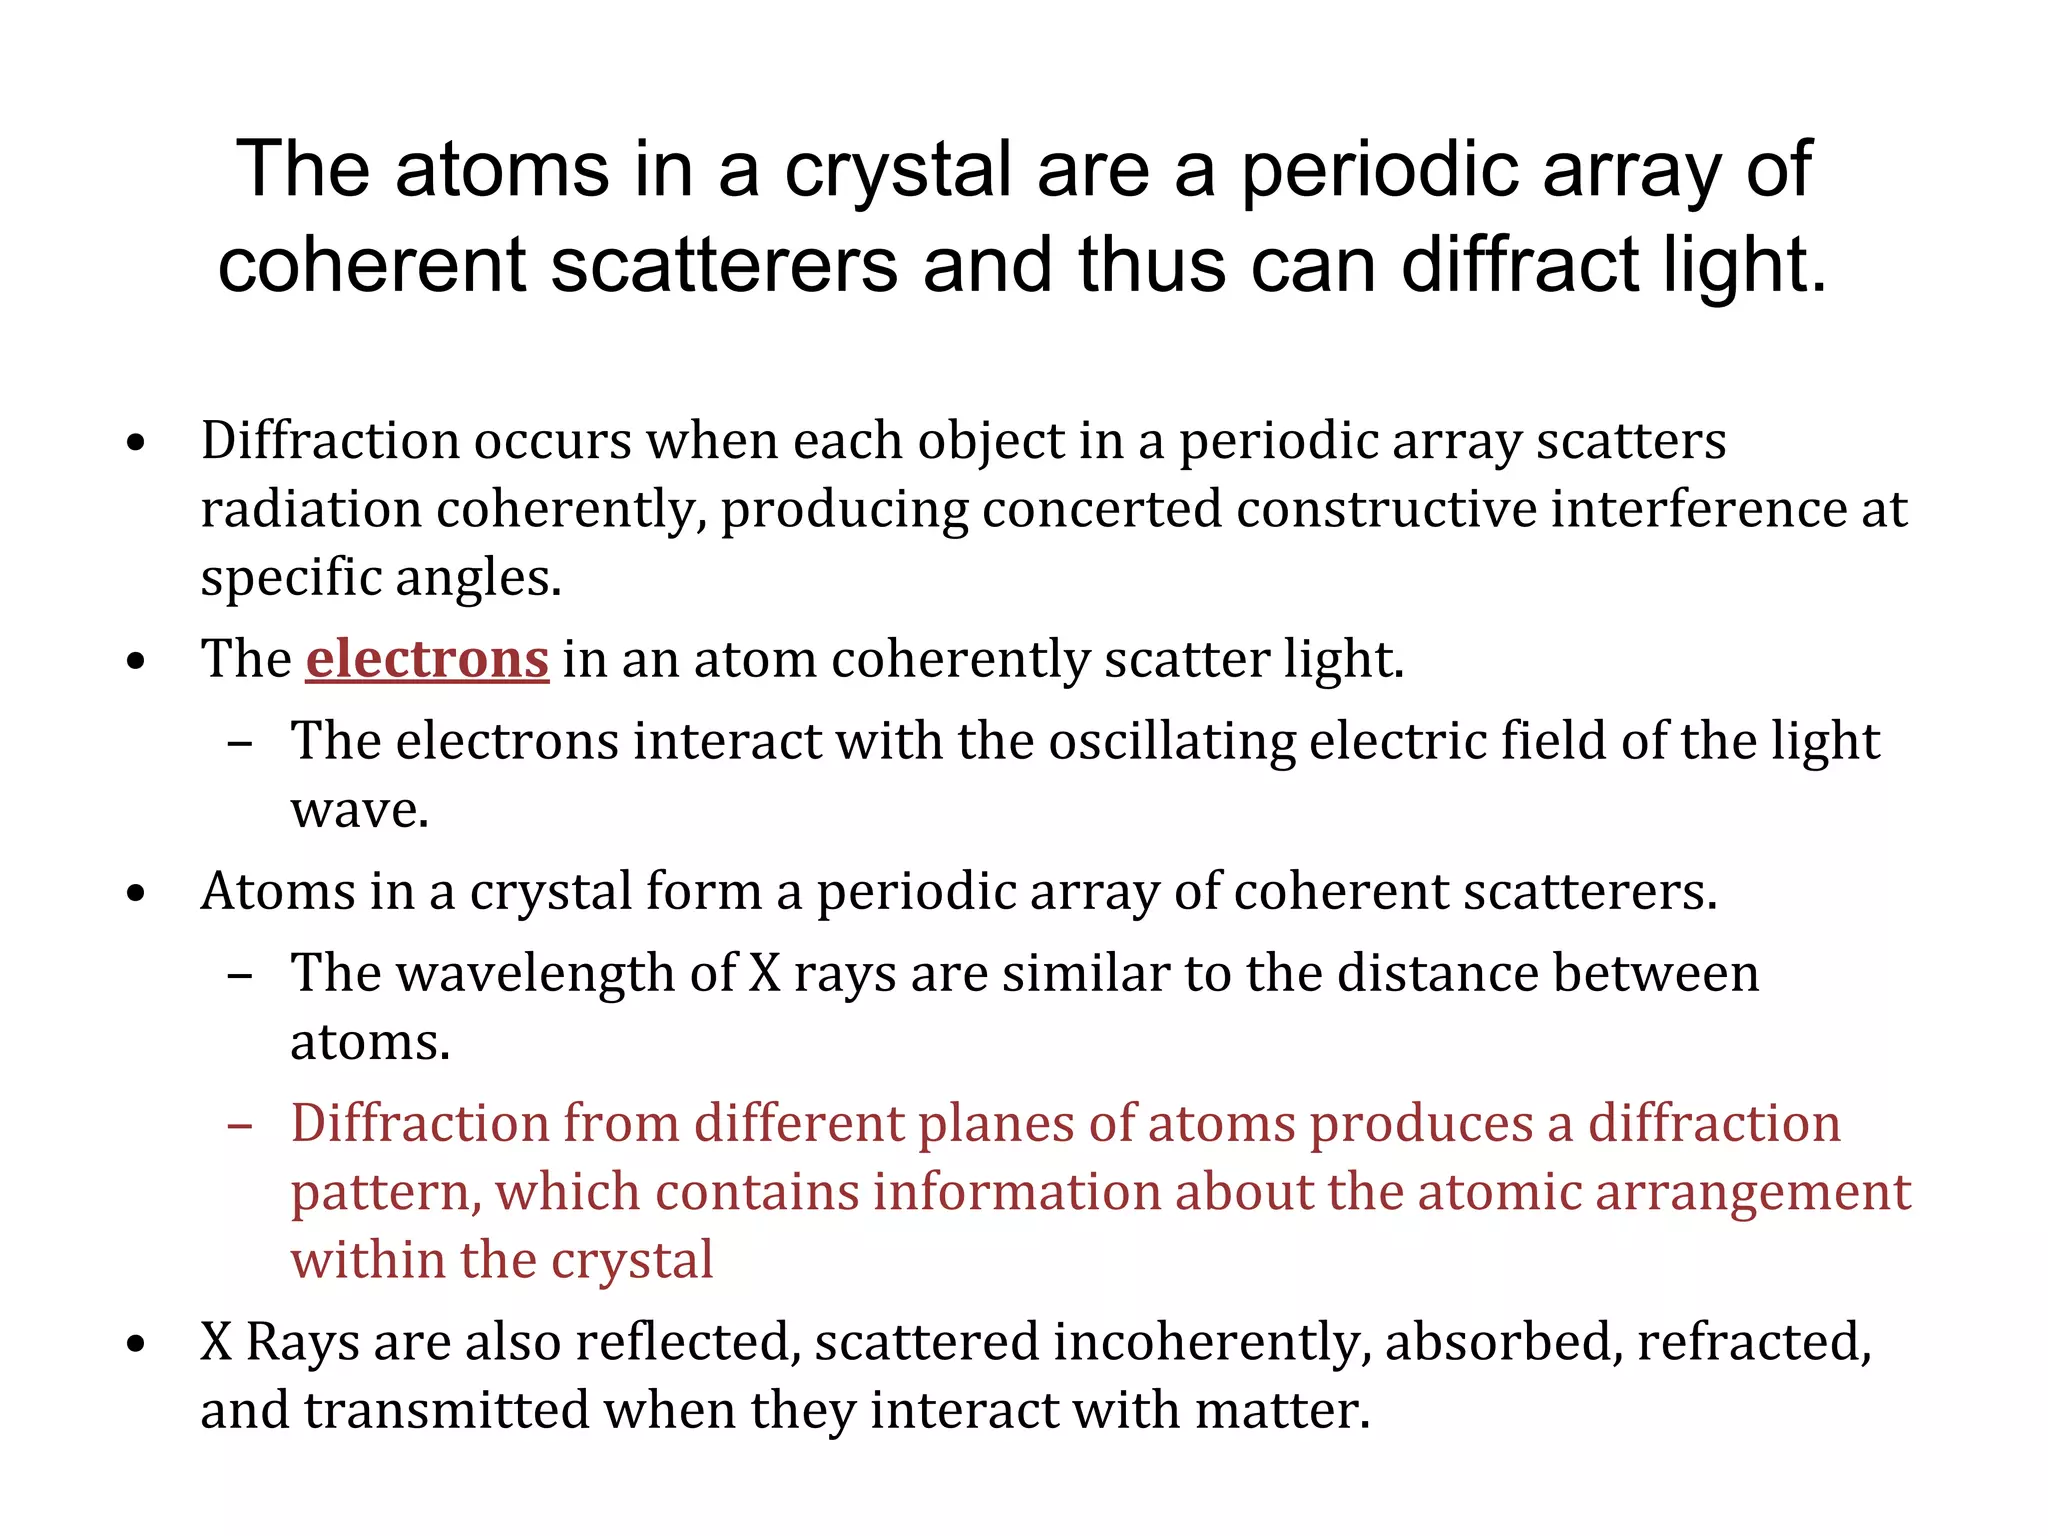
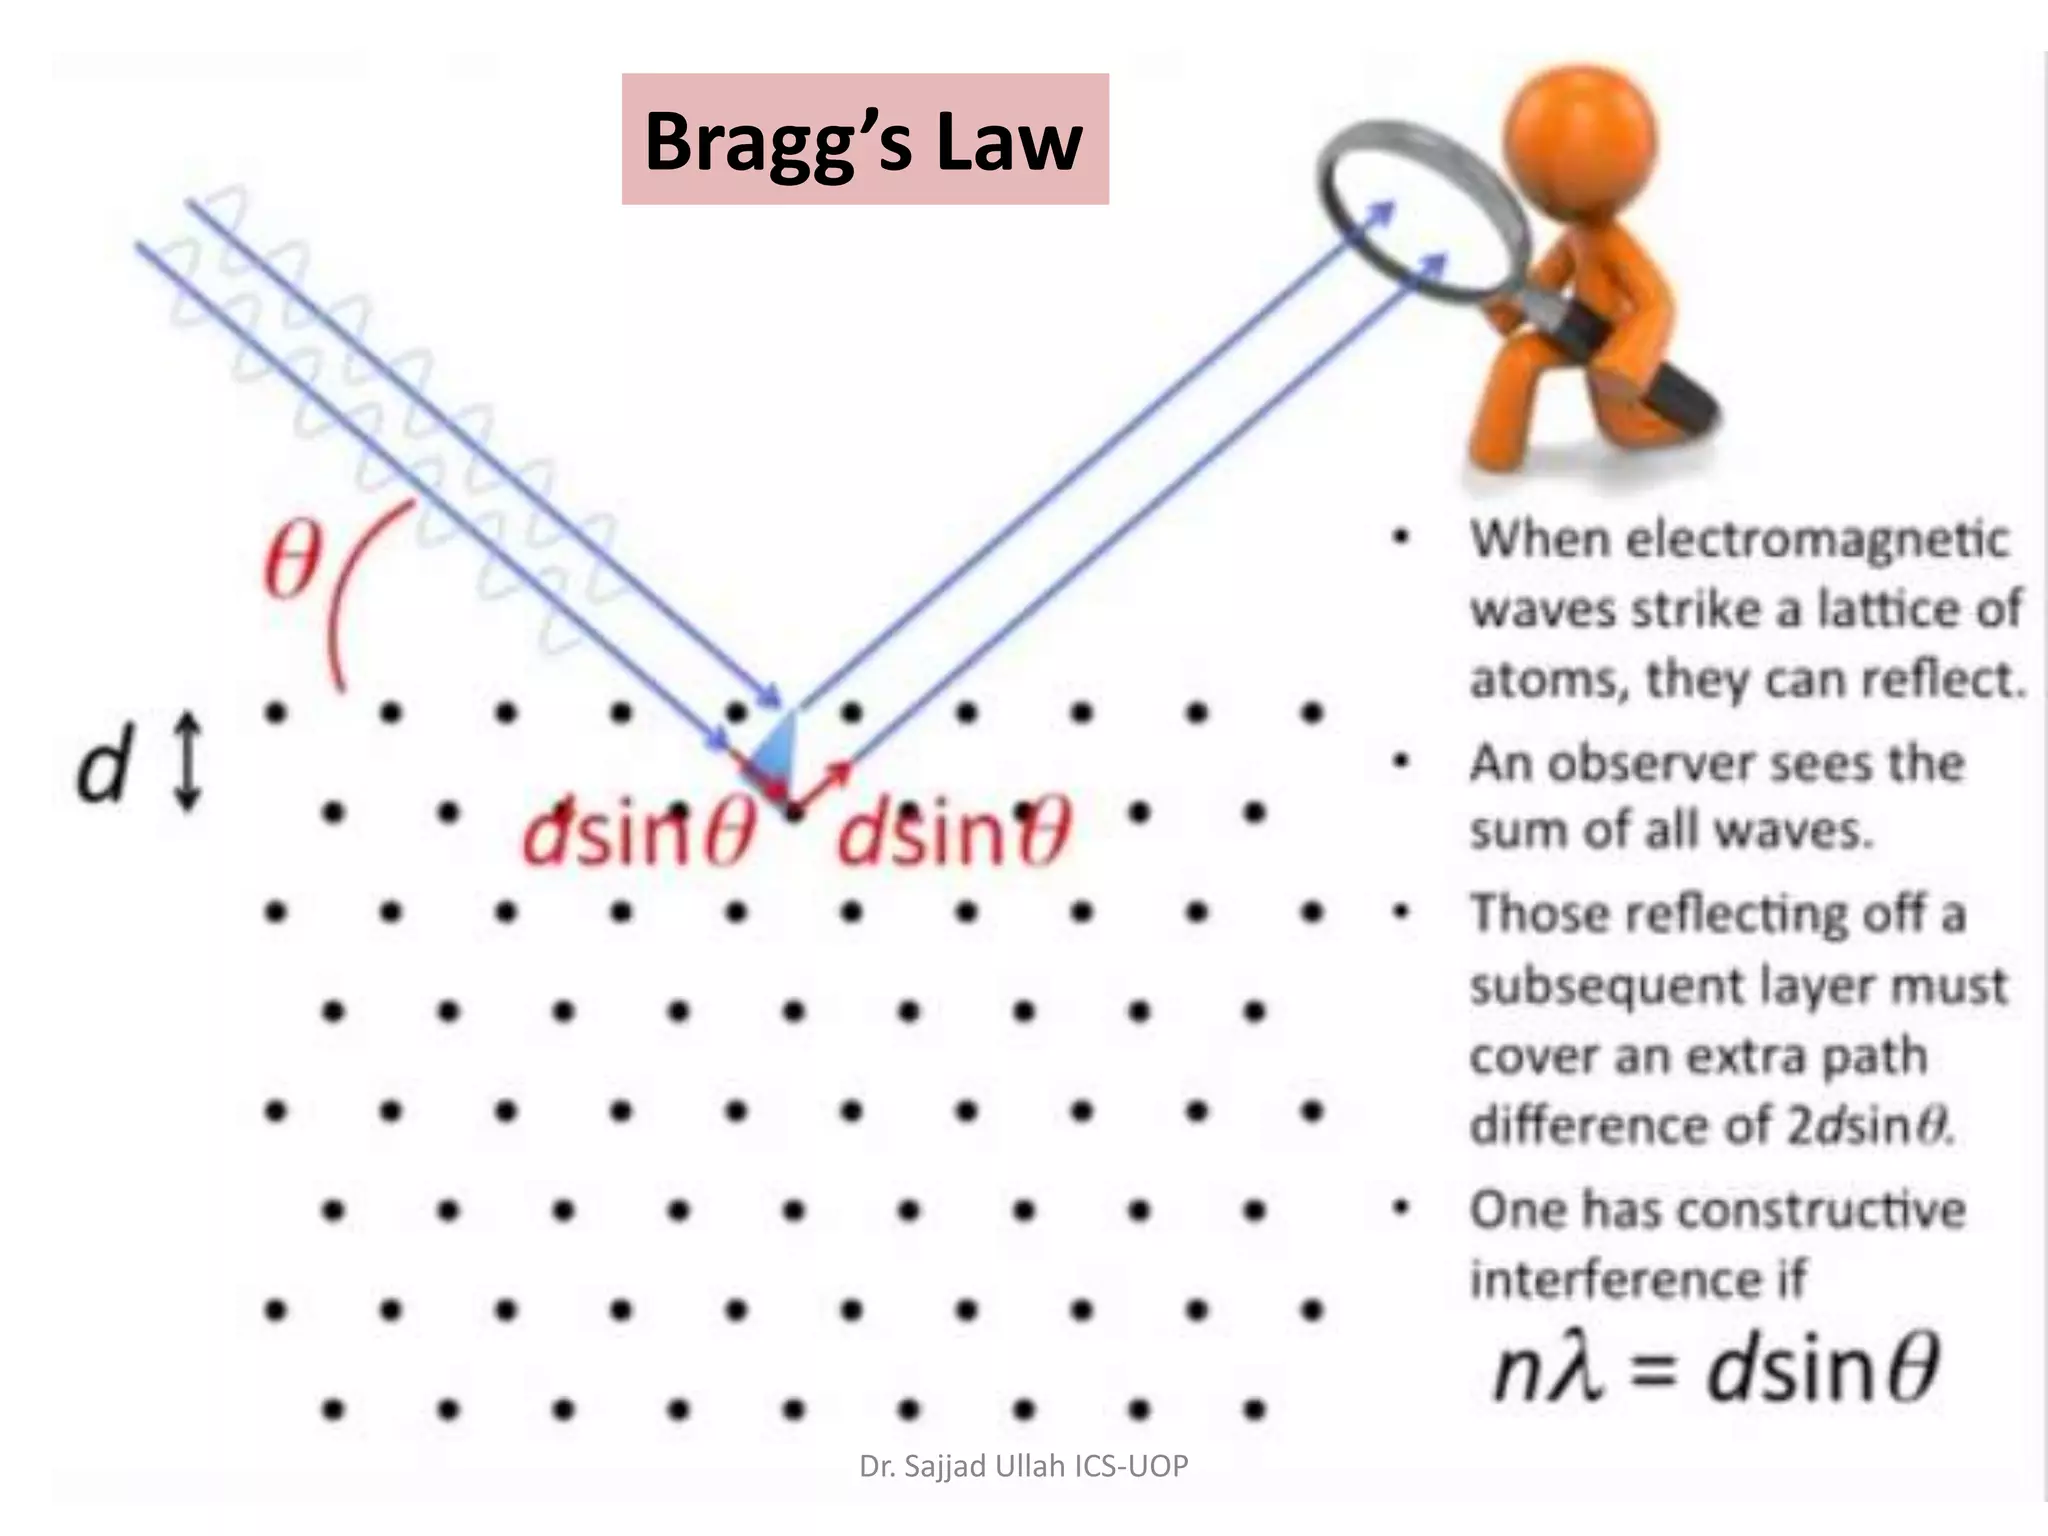
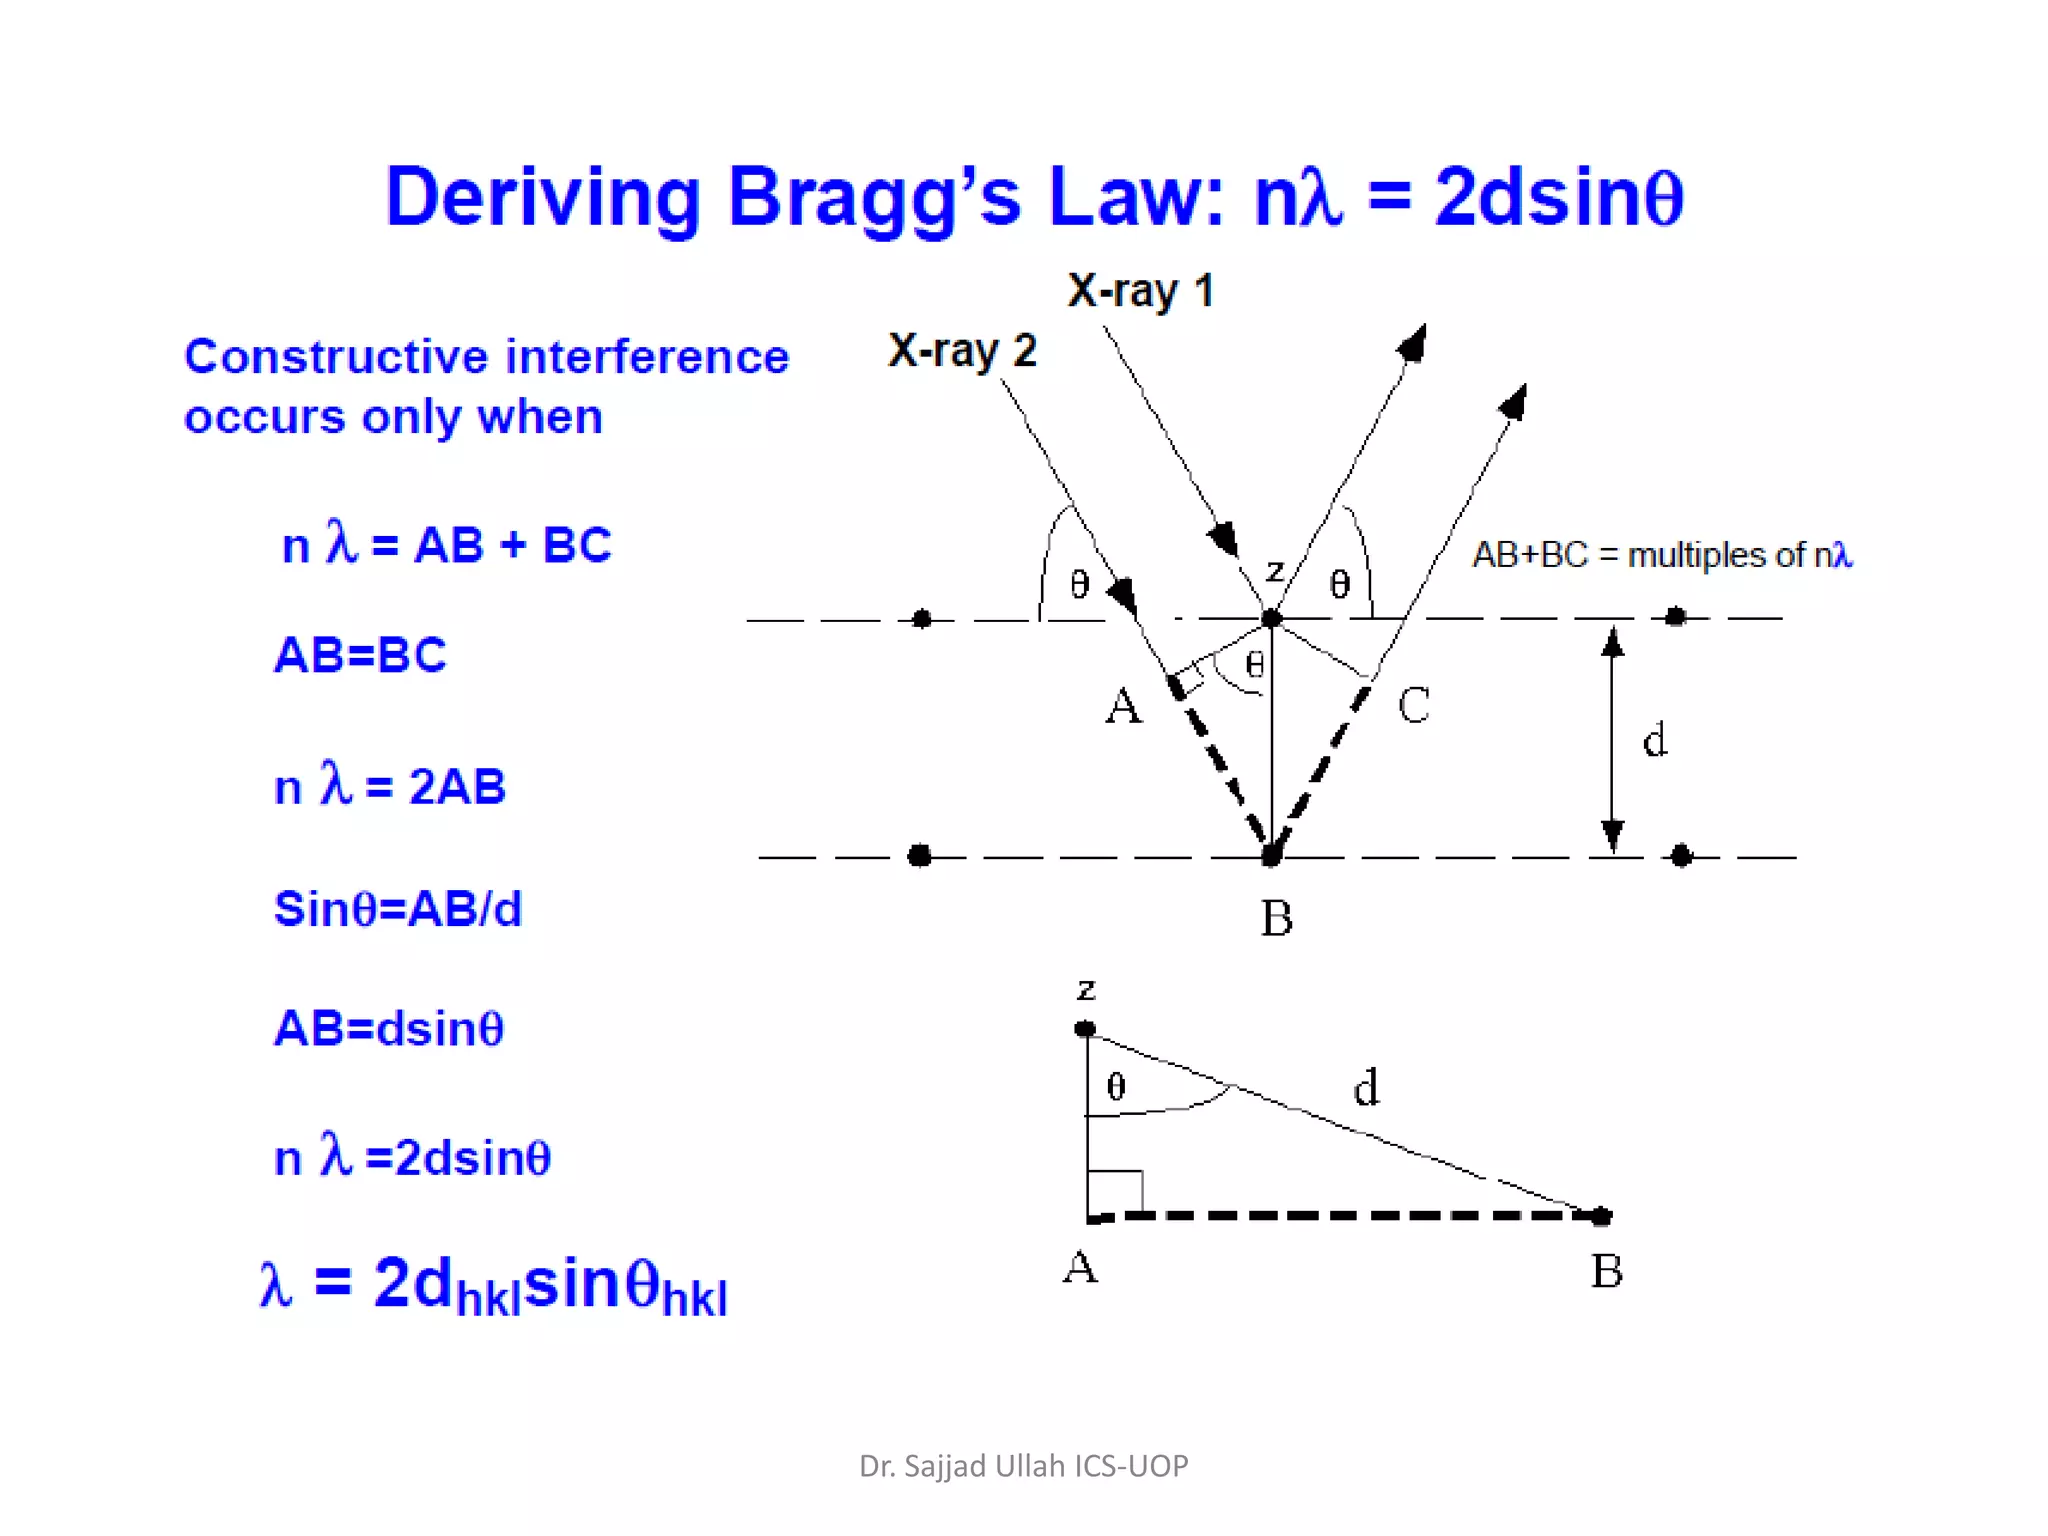
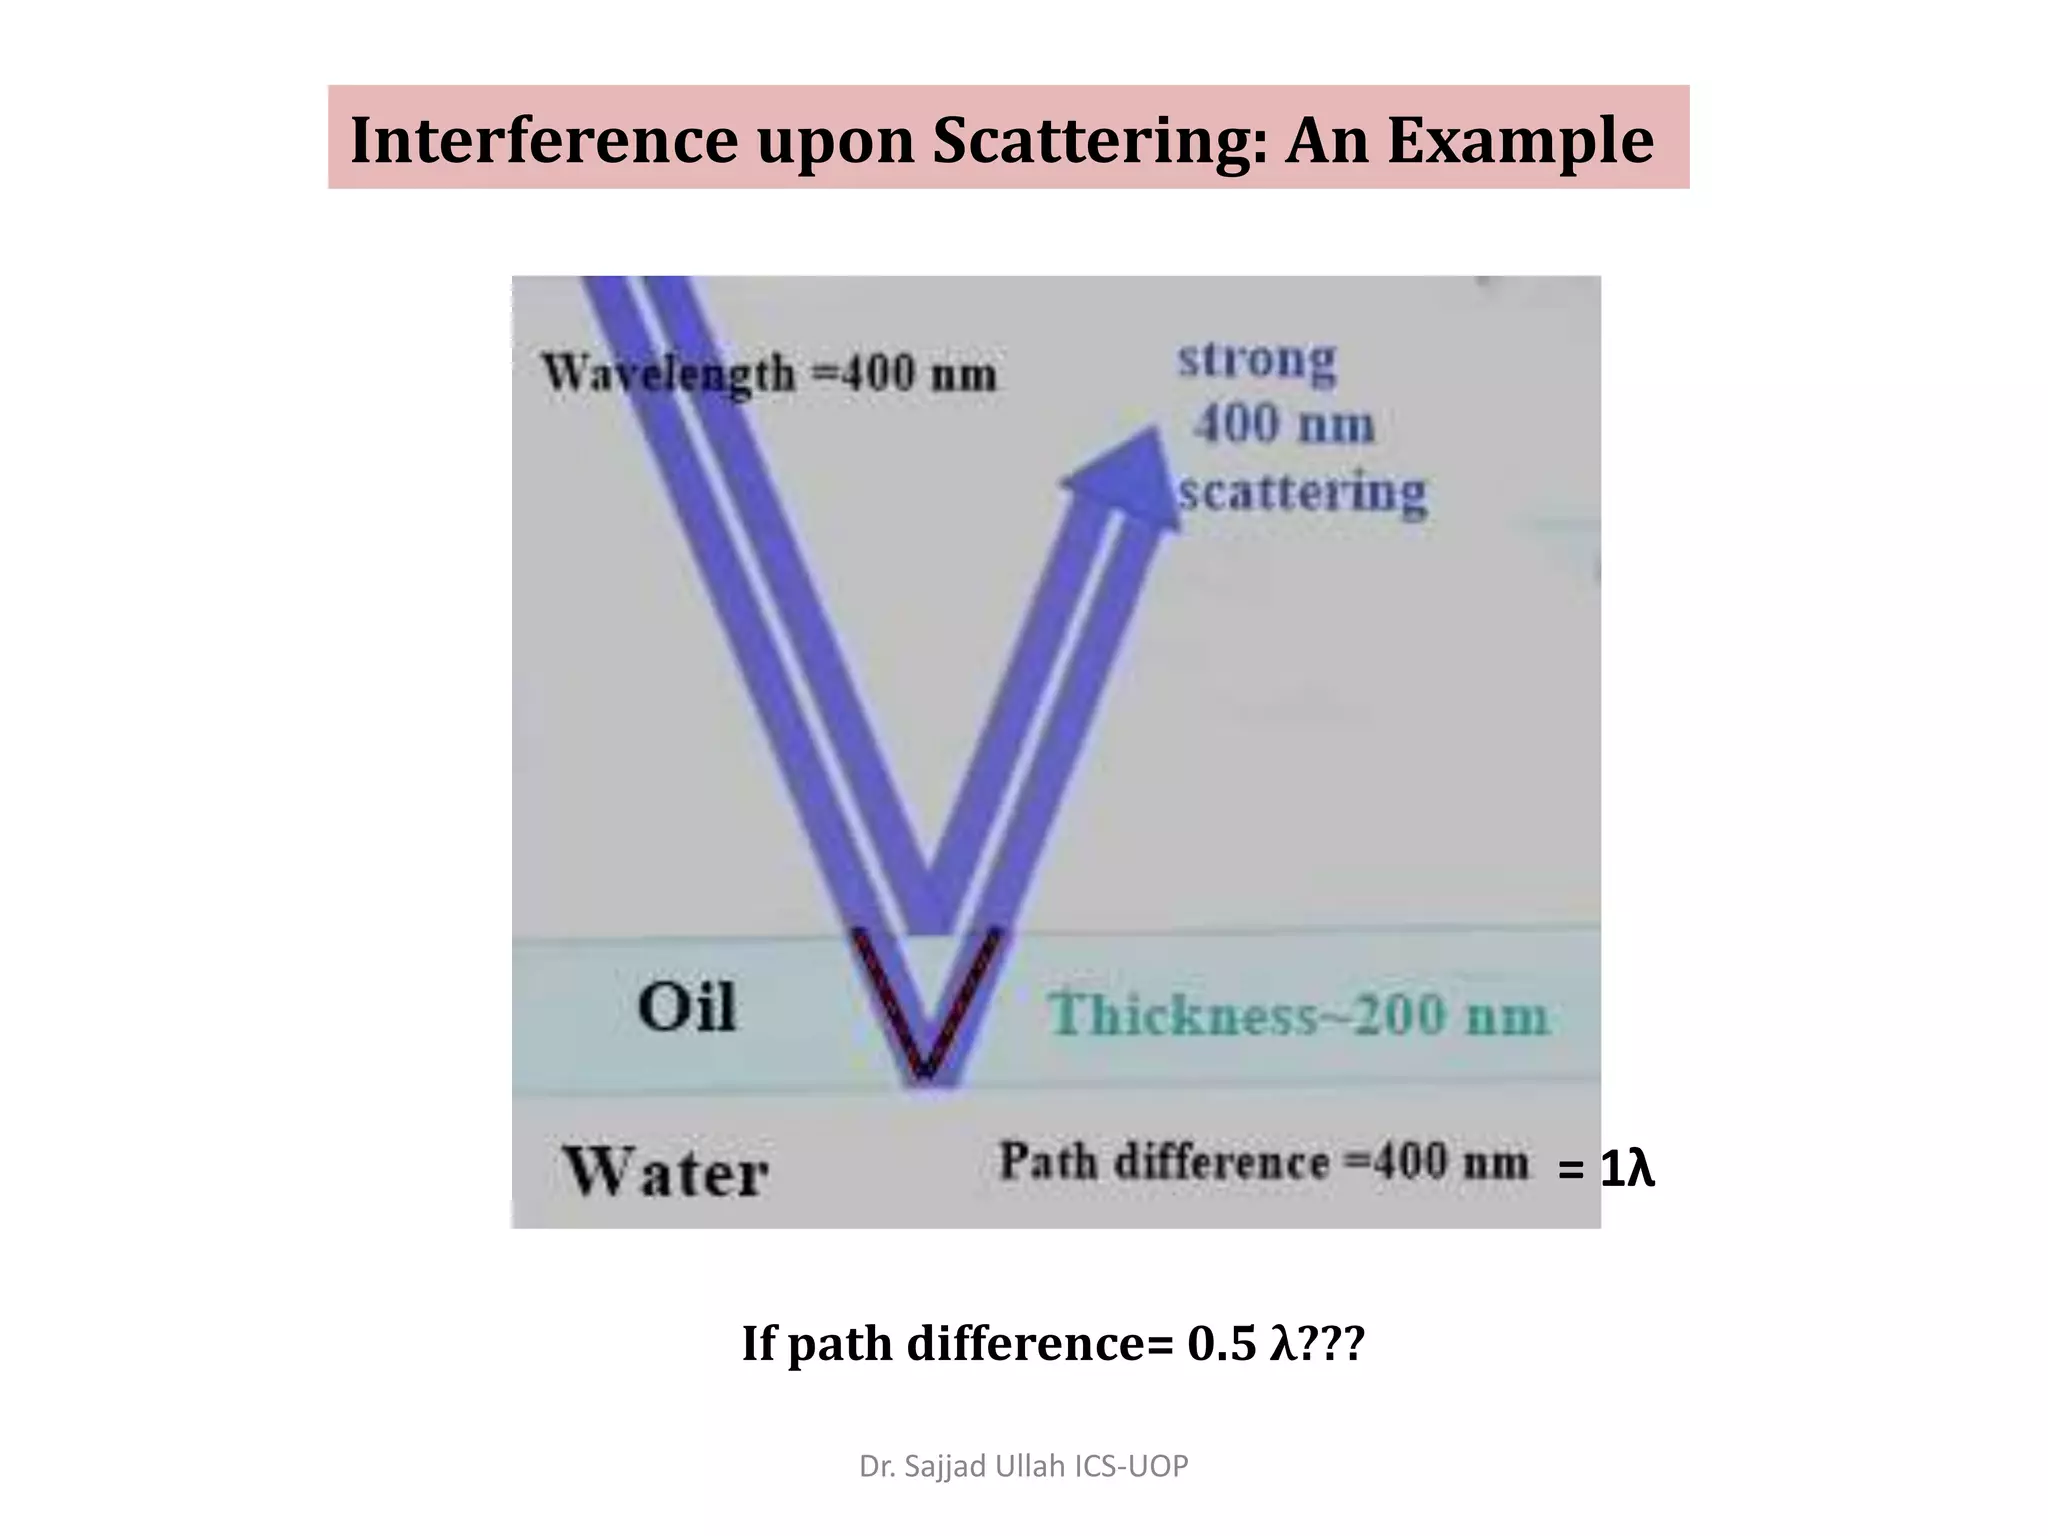
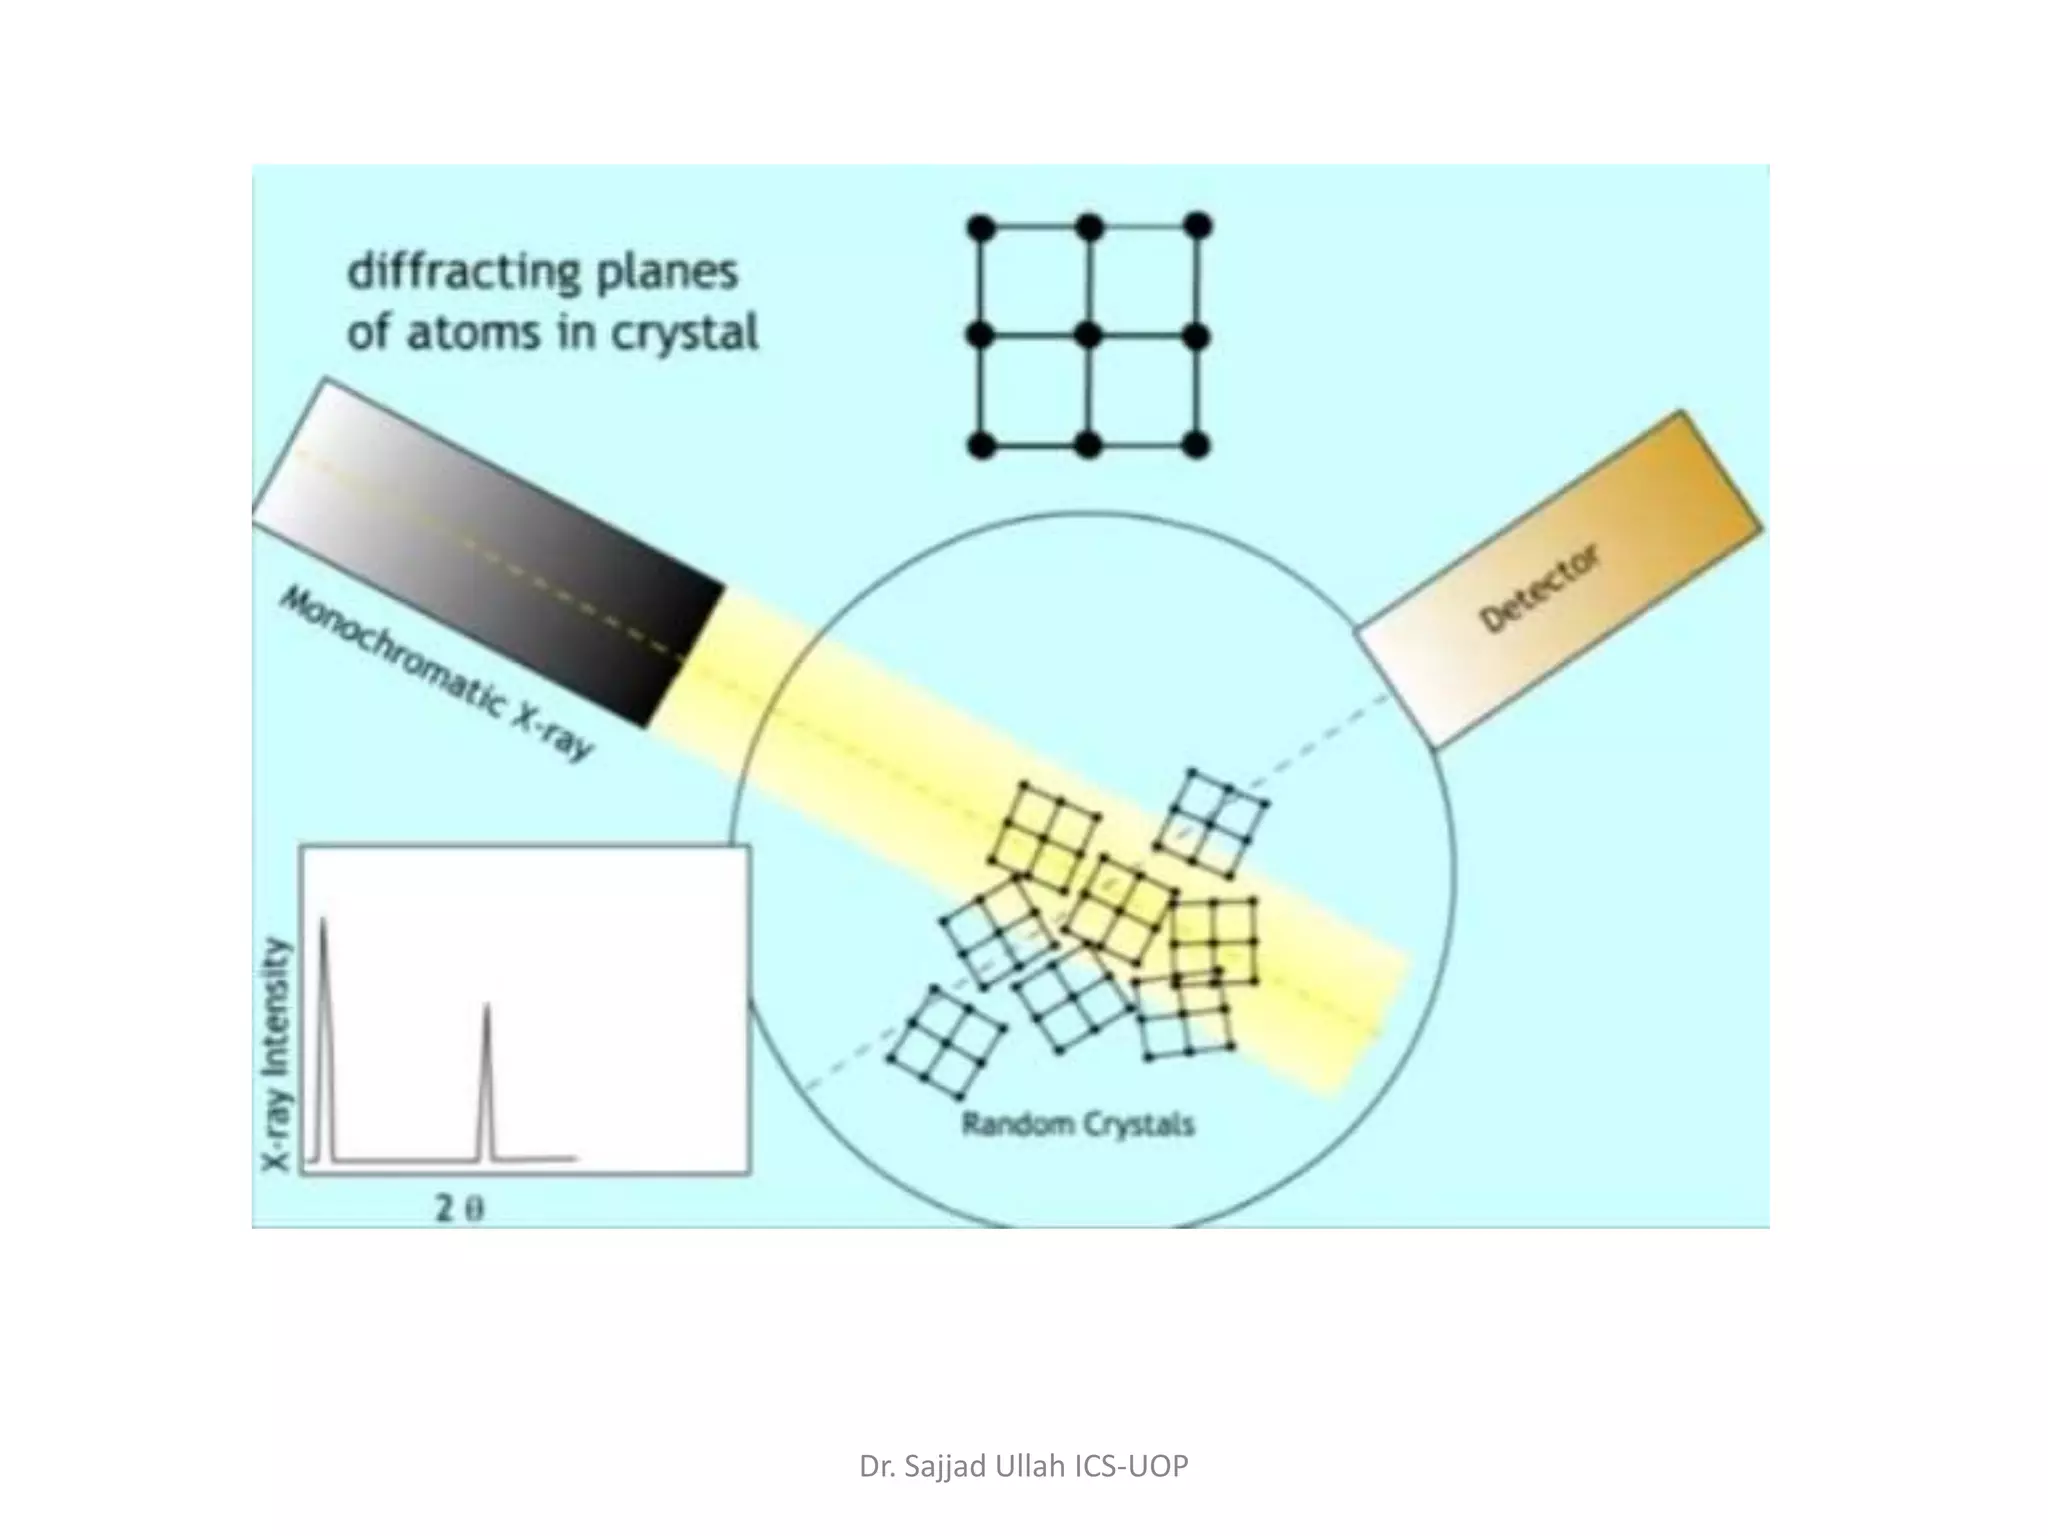
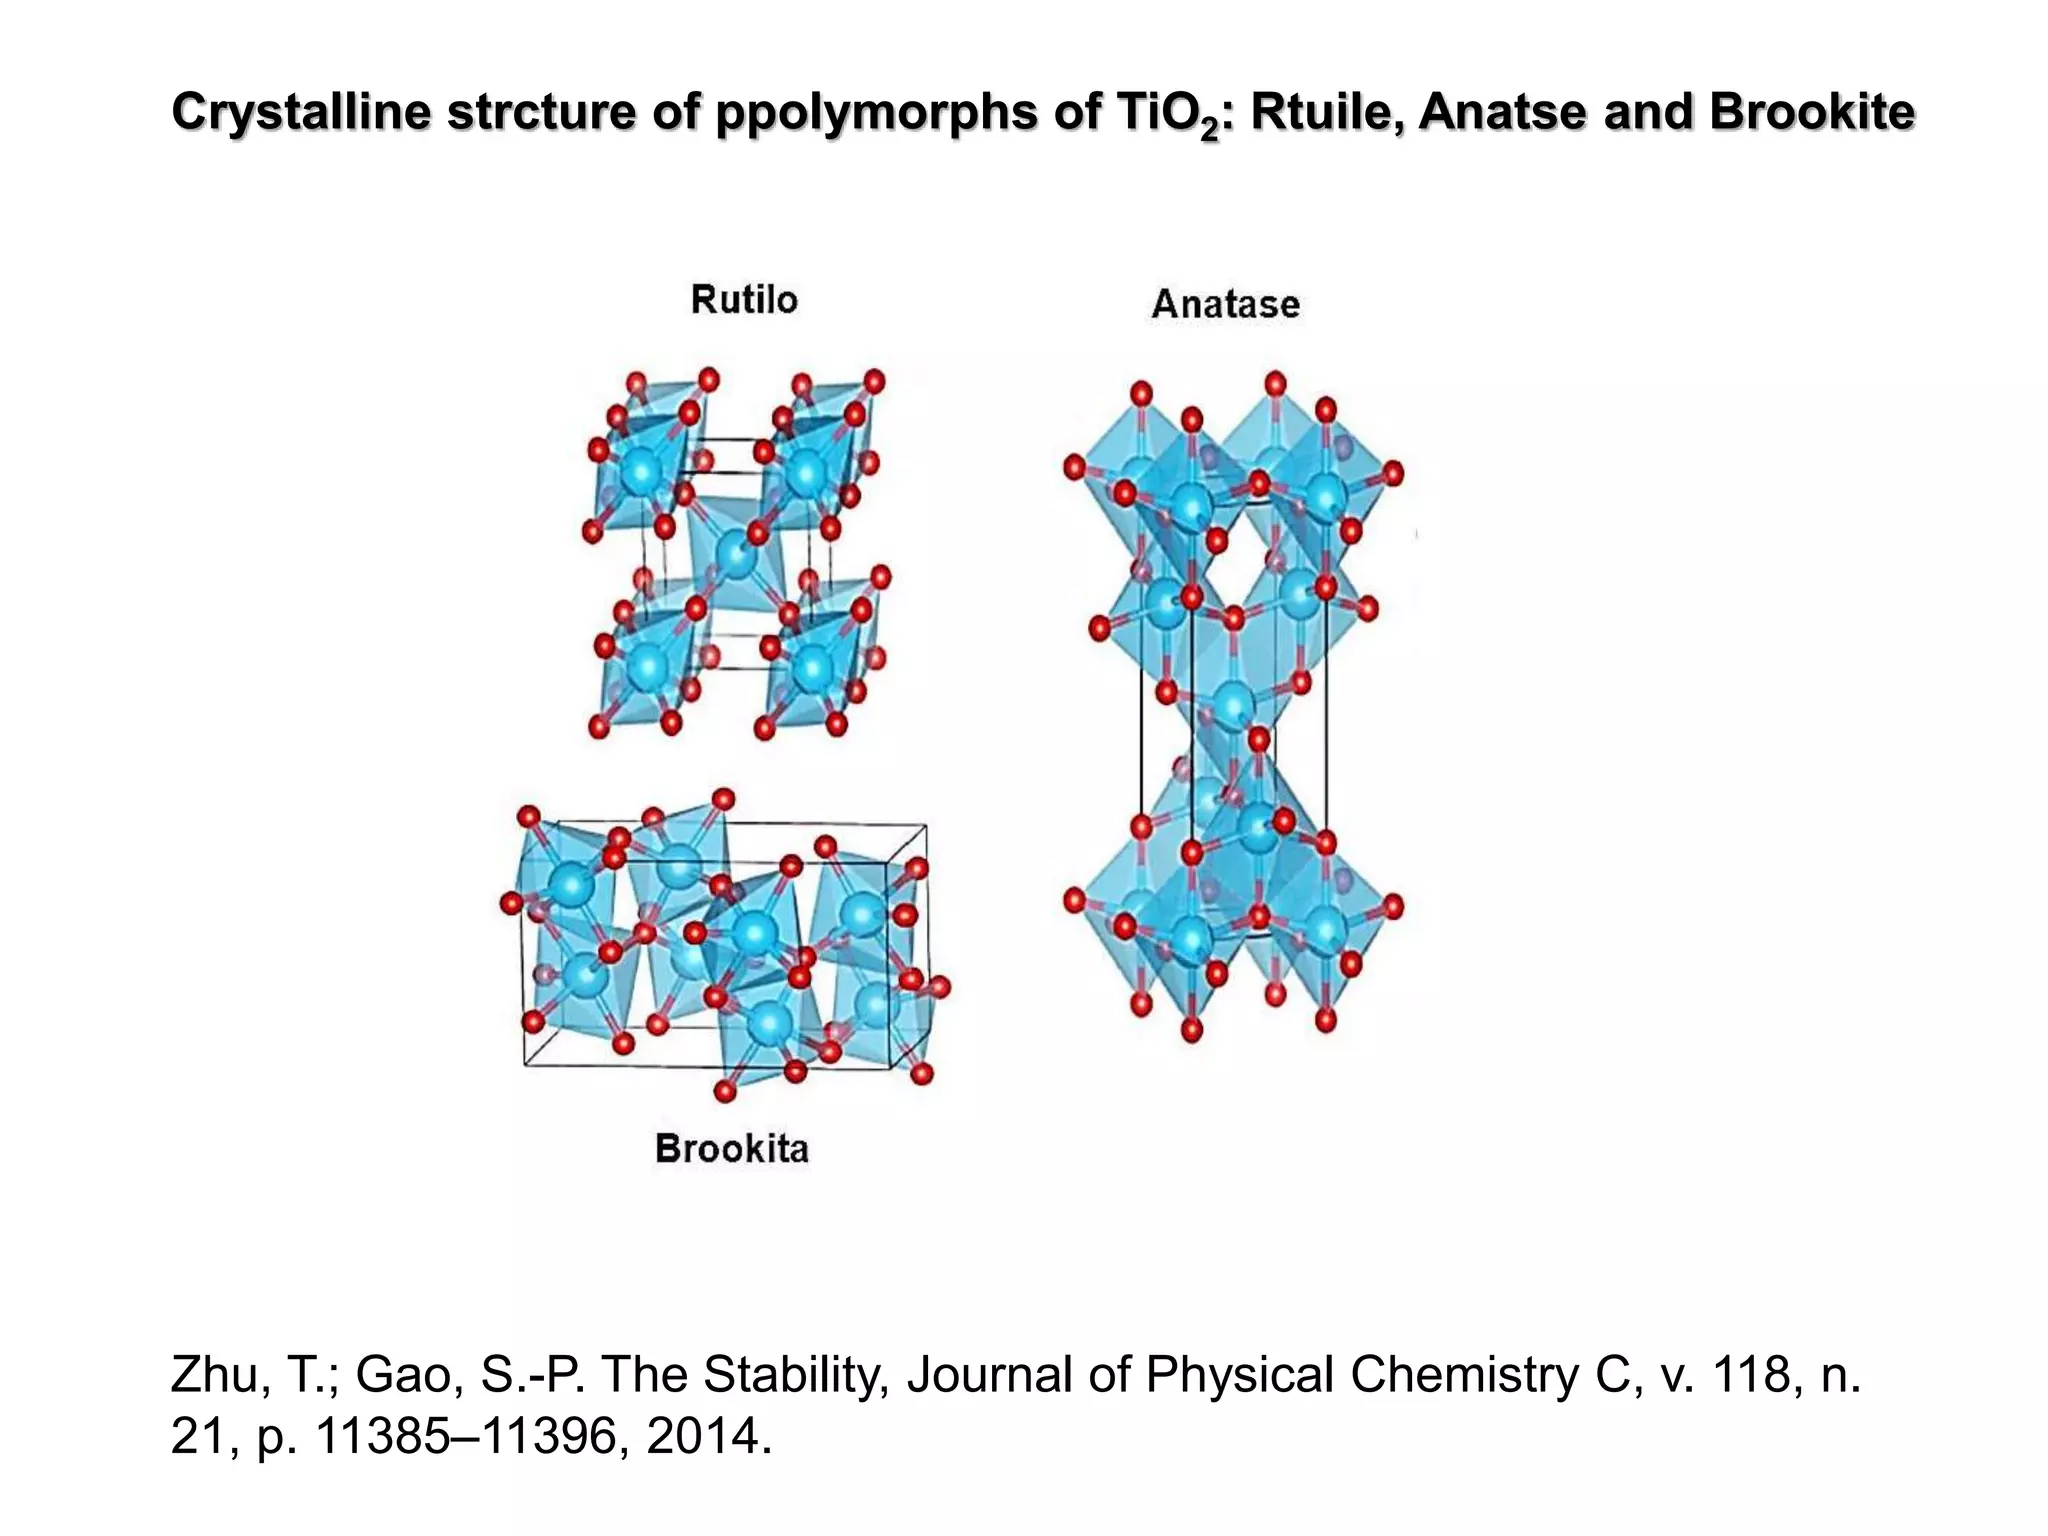
Discussion on the unit cell, atomic arrangements, X-rays diffraction patterns, and Bragg's Law.
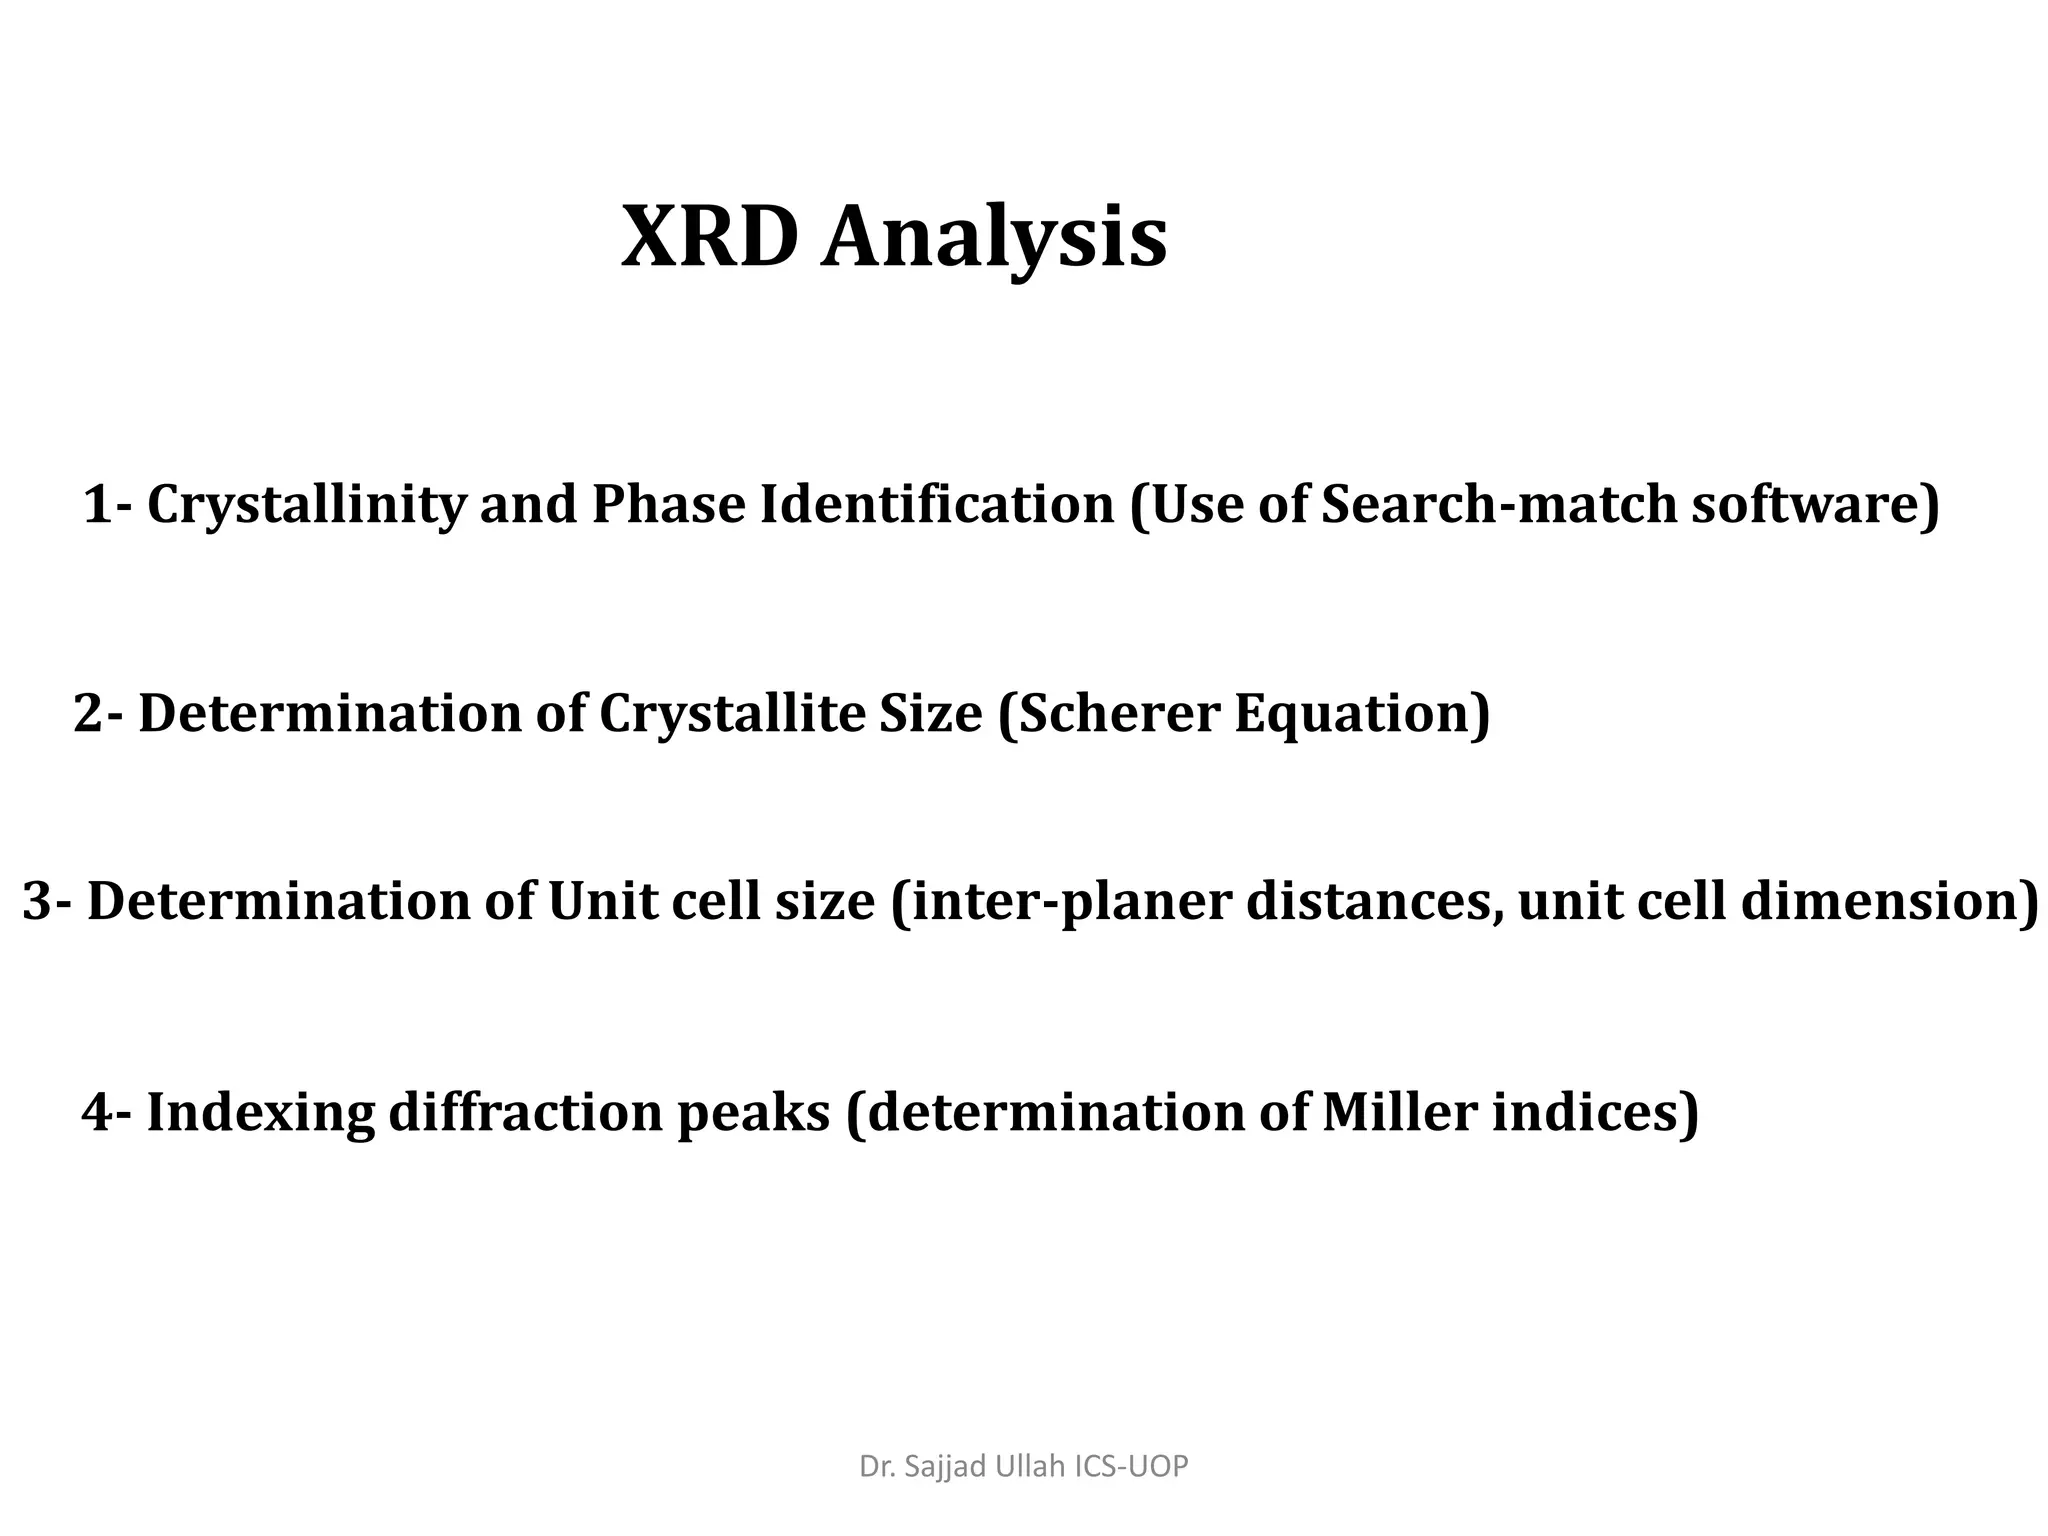
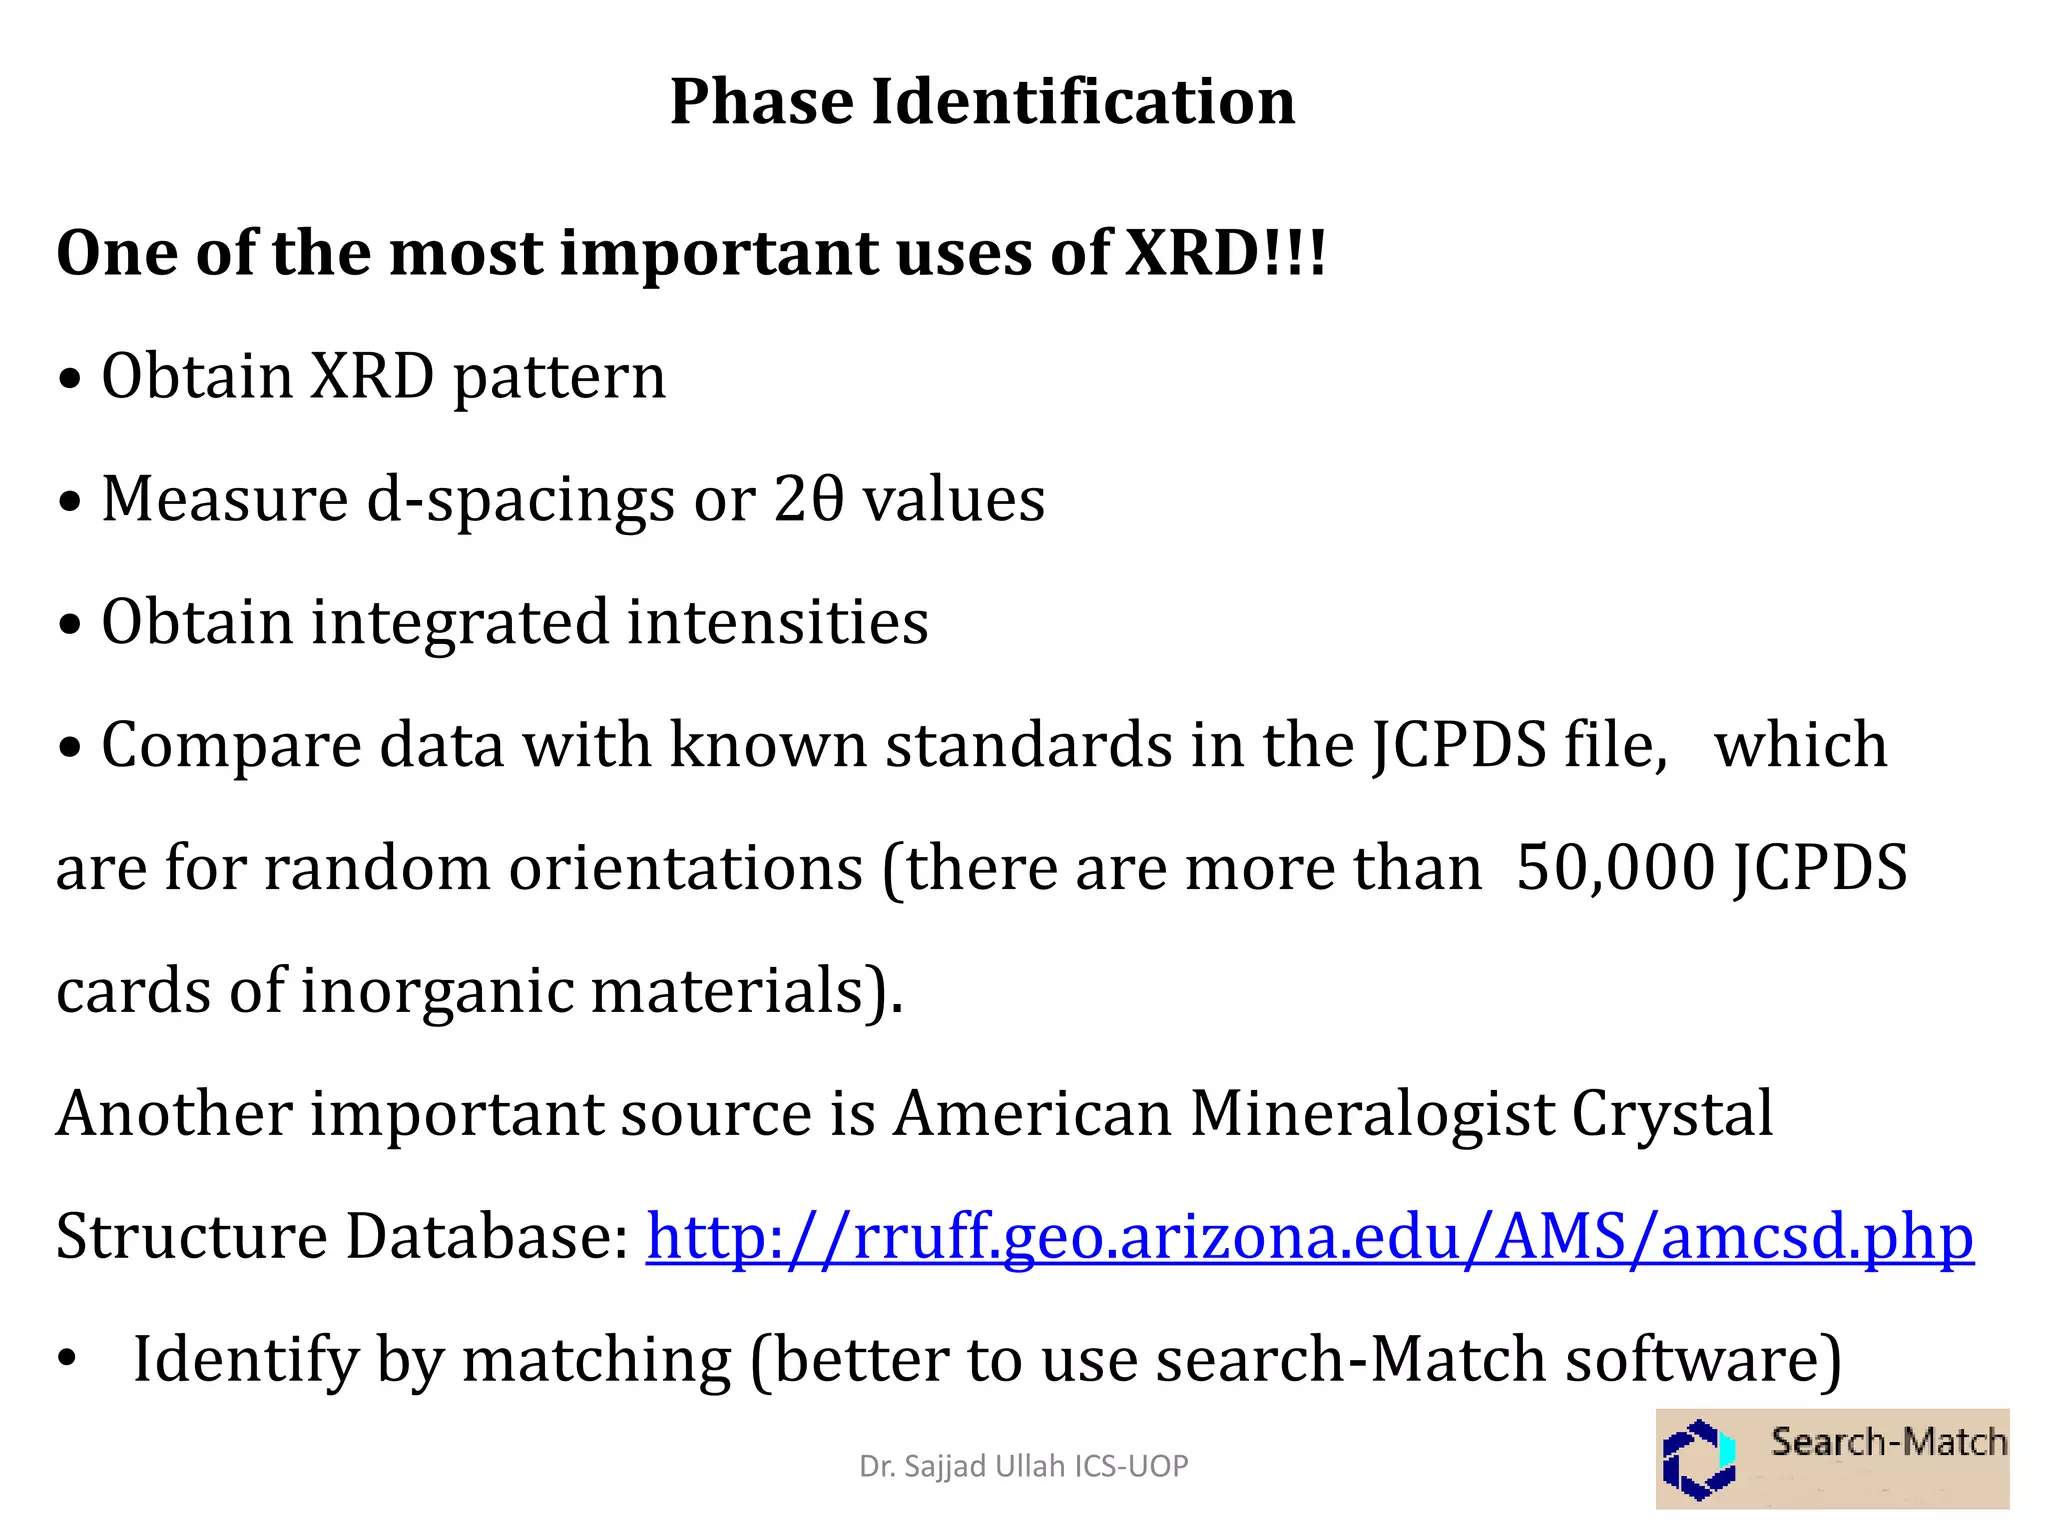
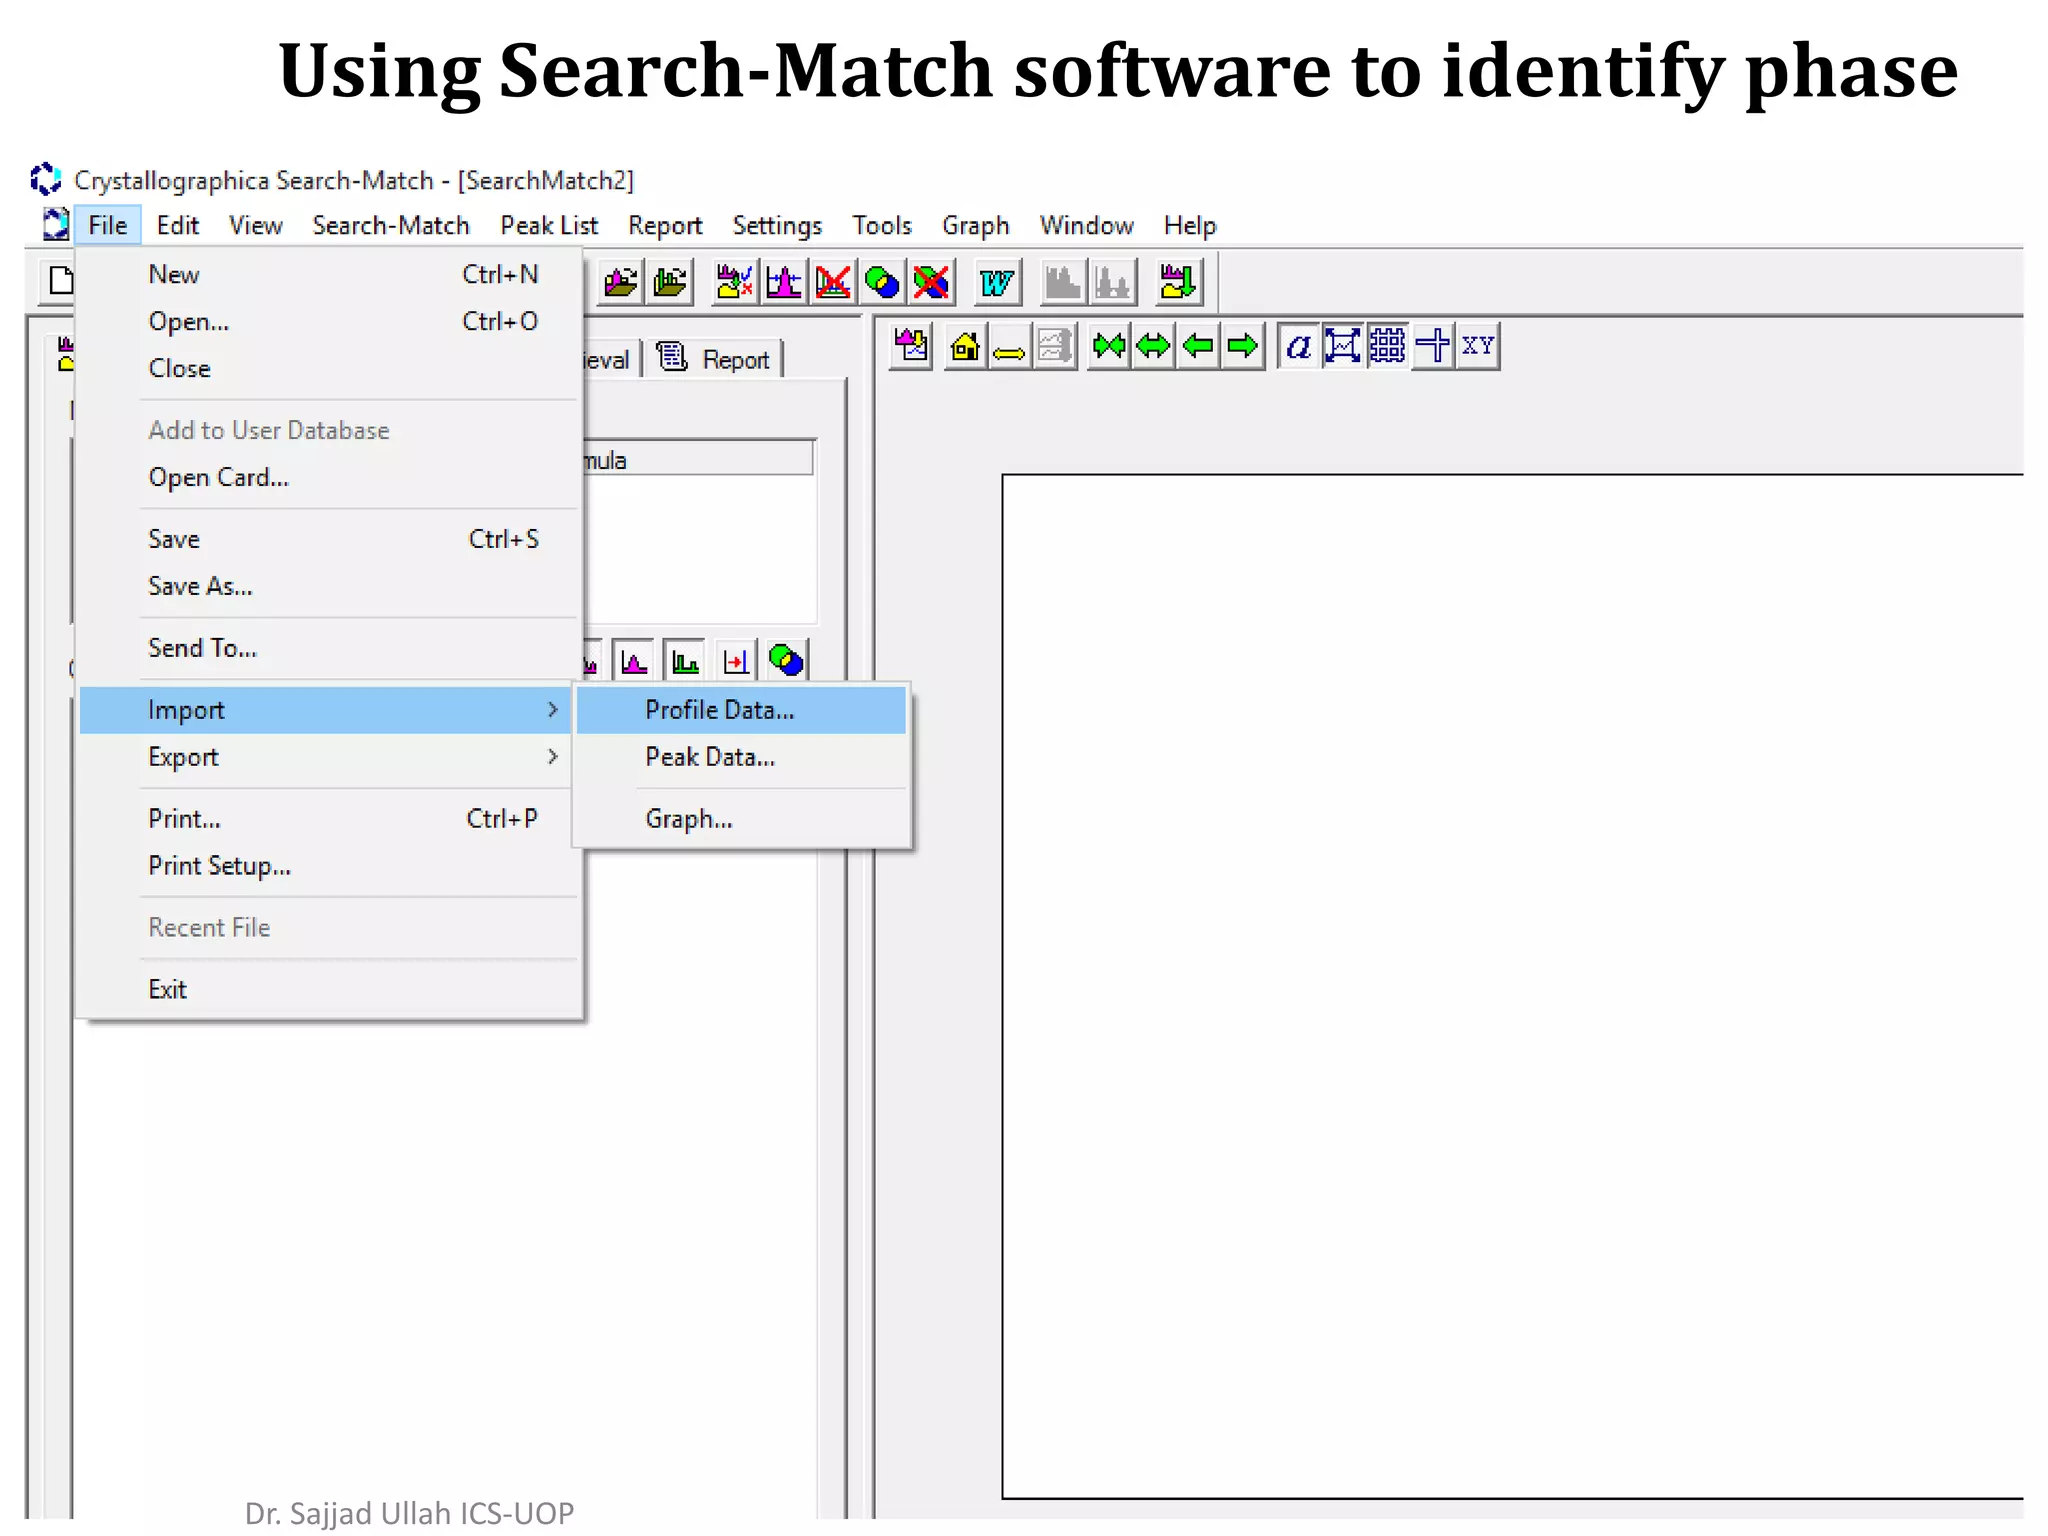
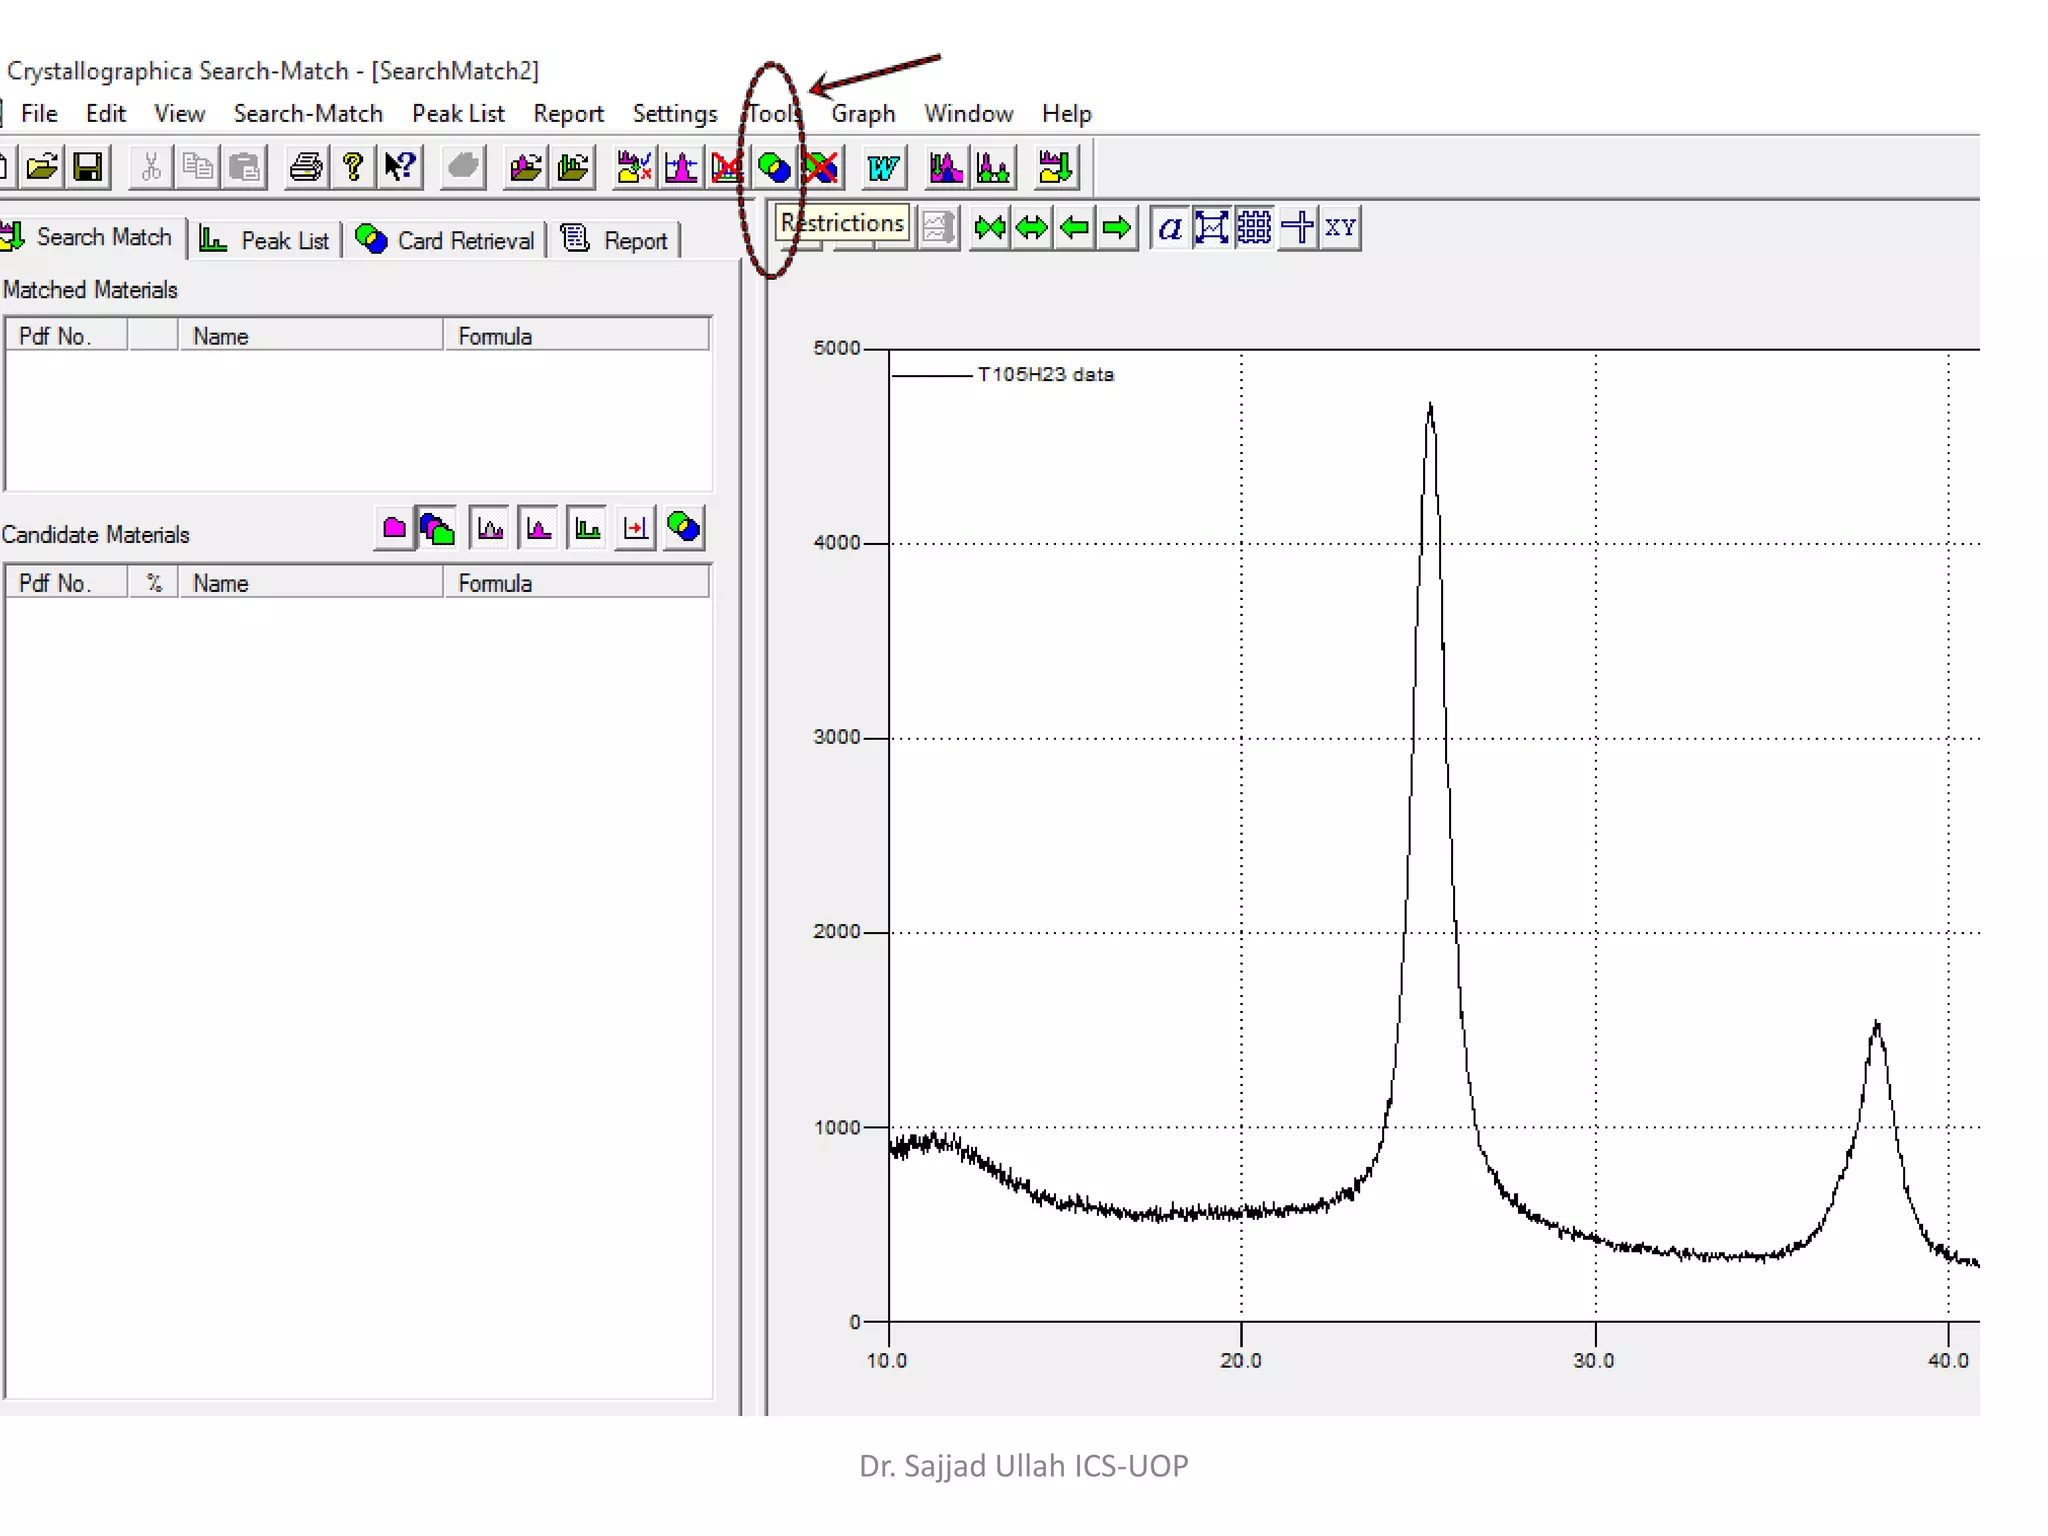
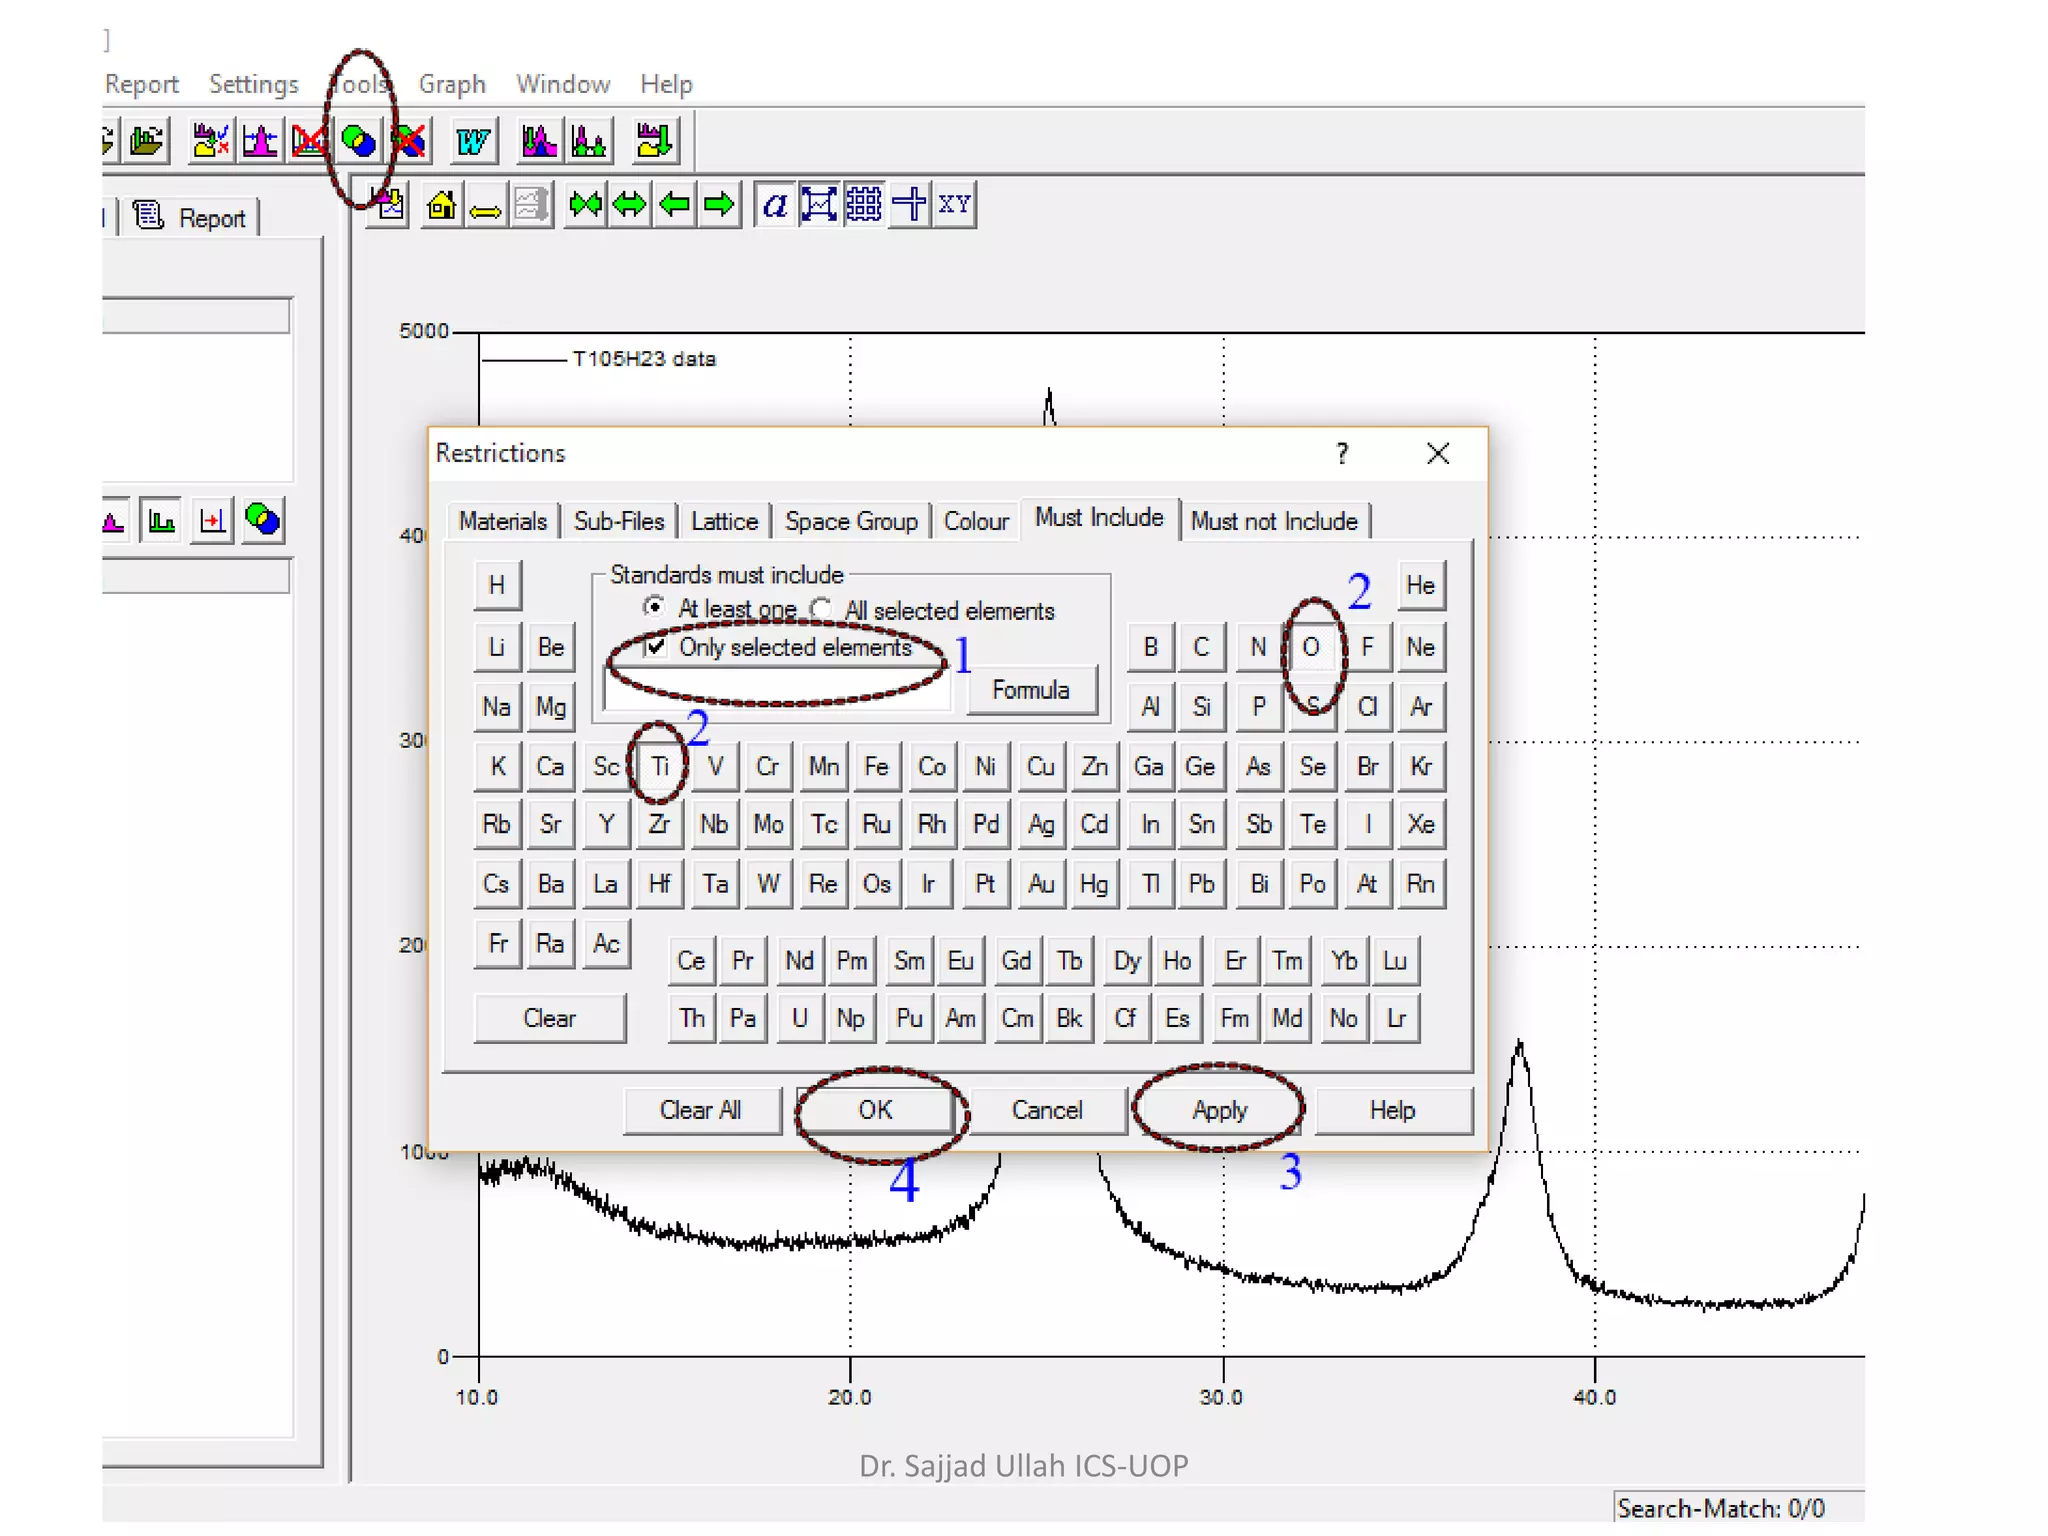
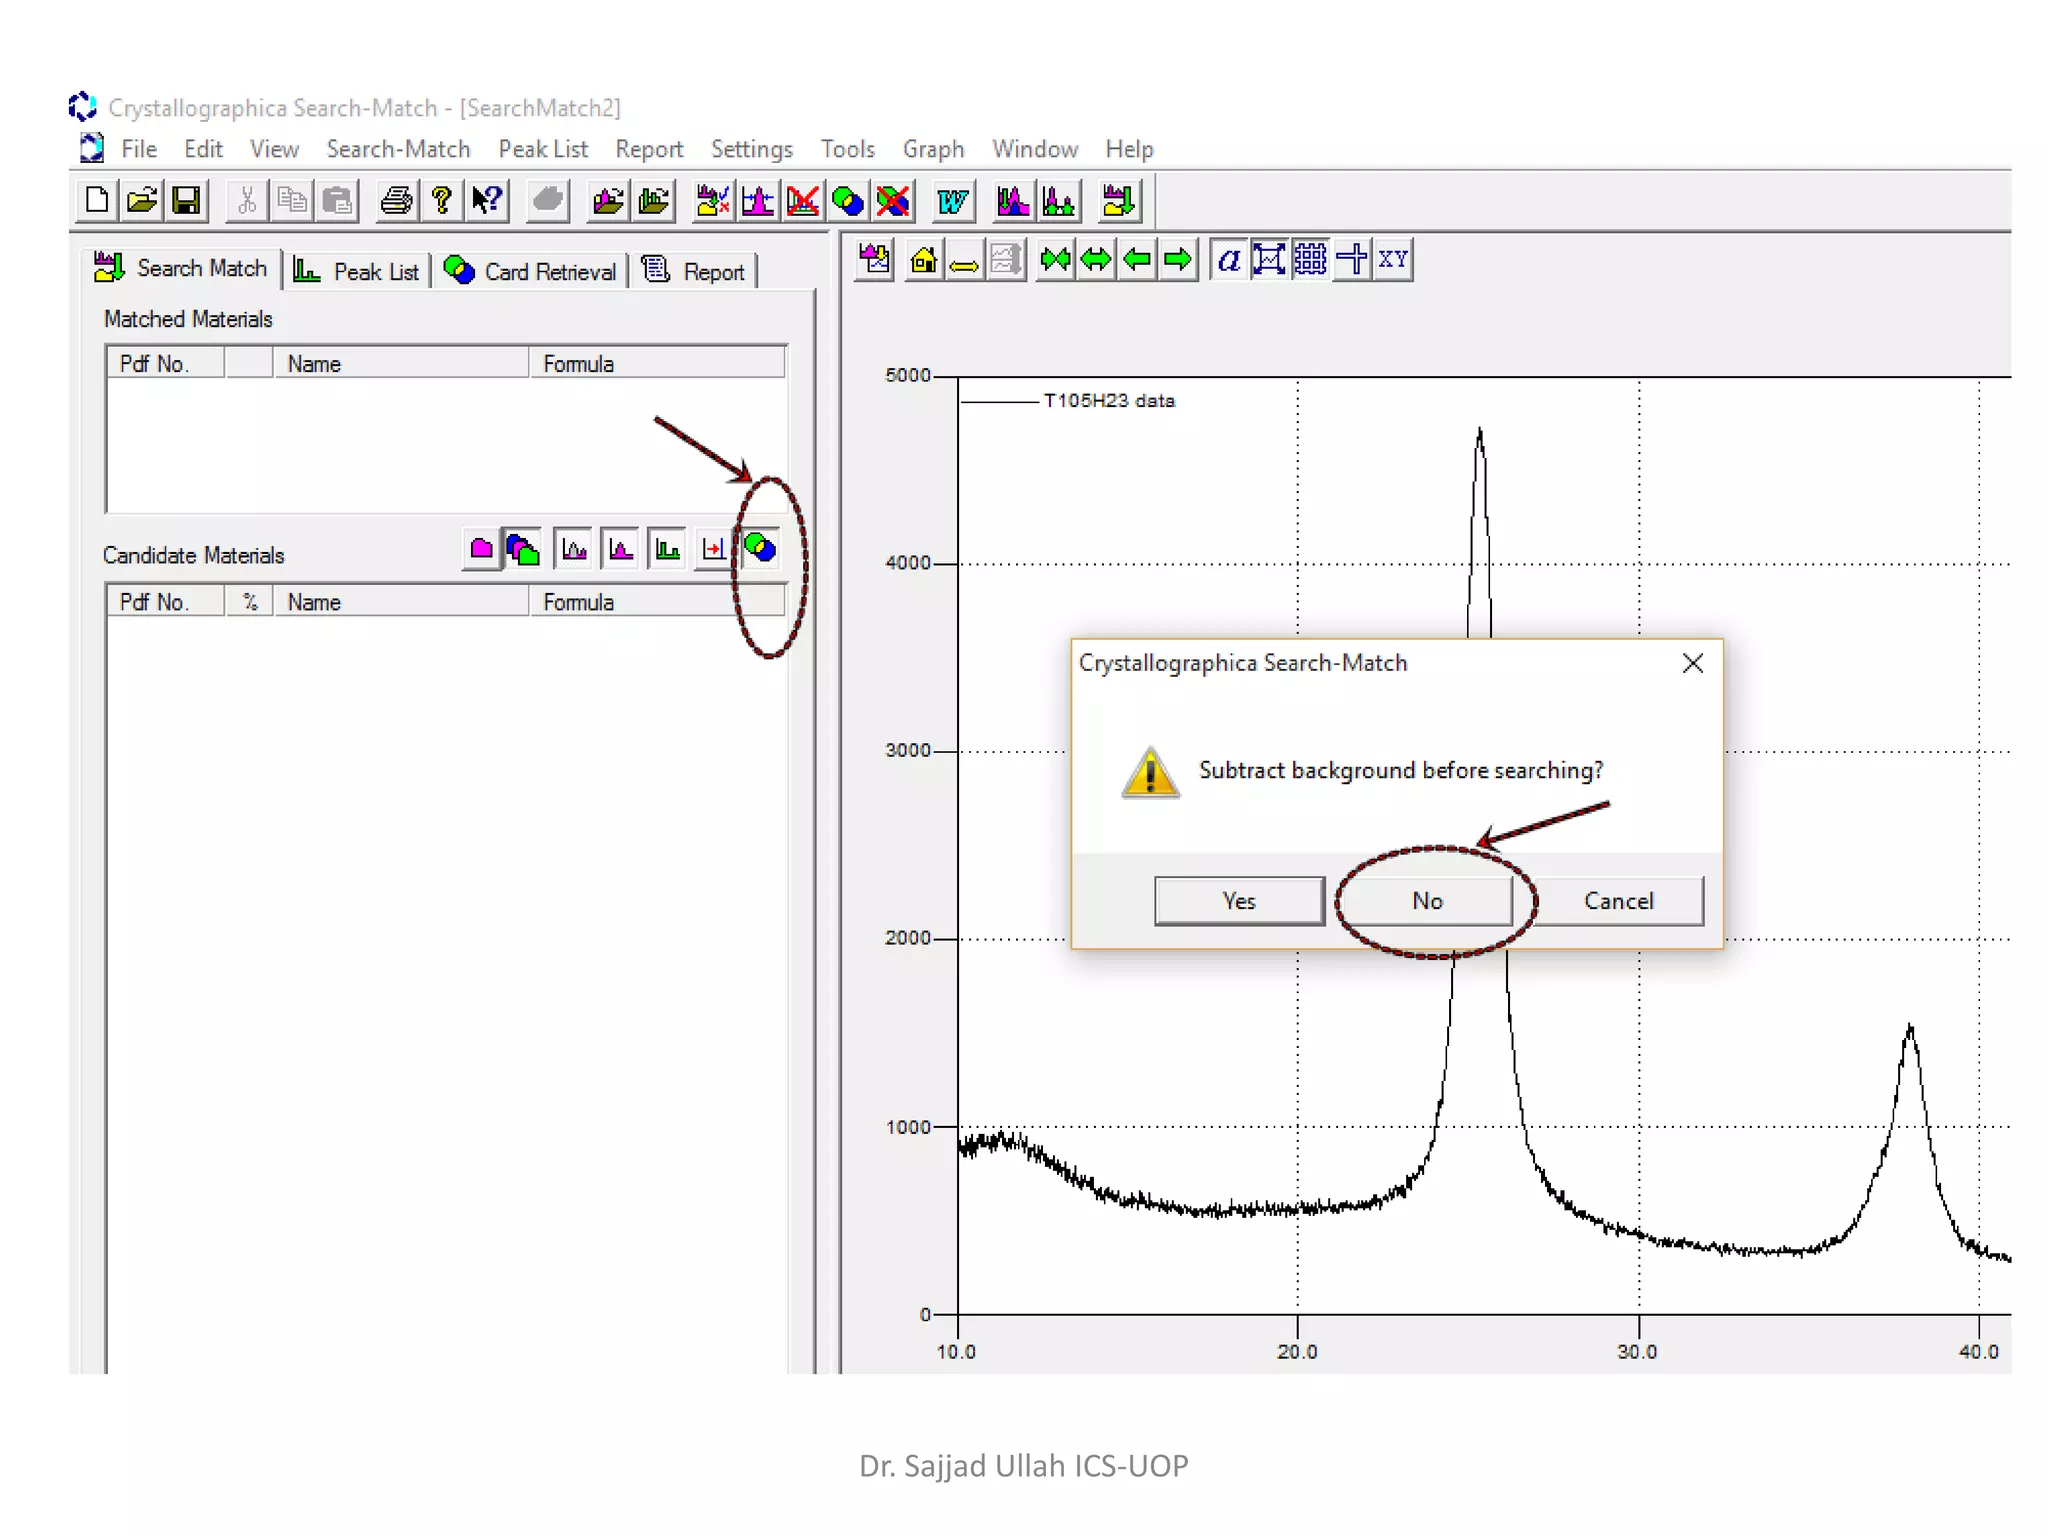
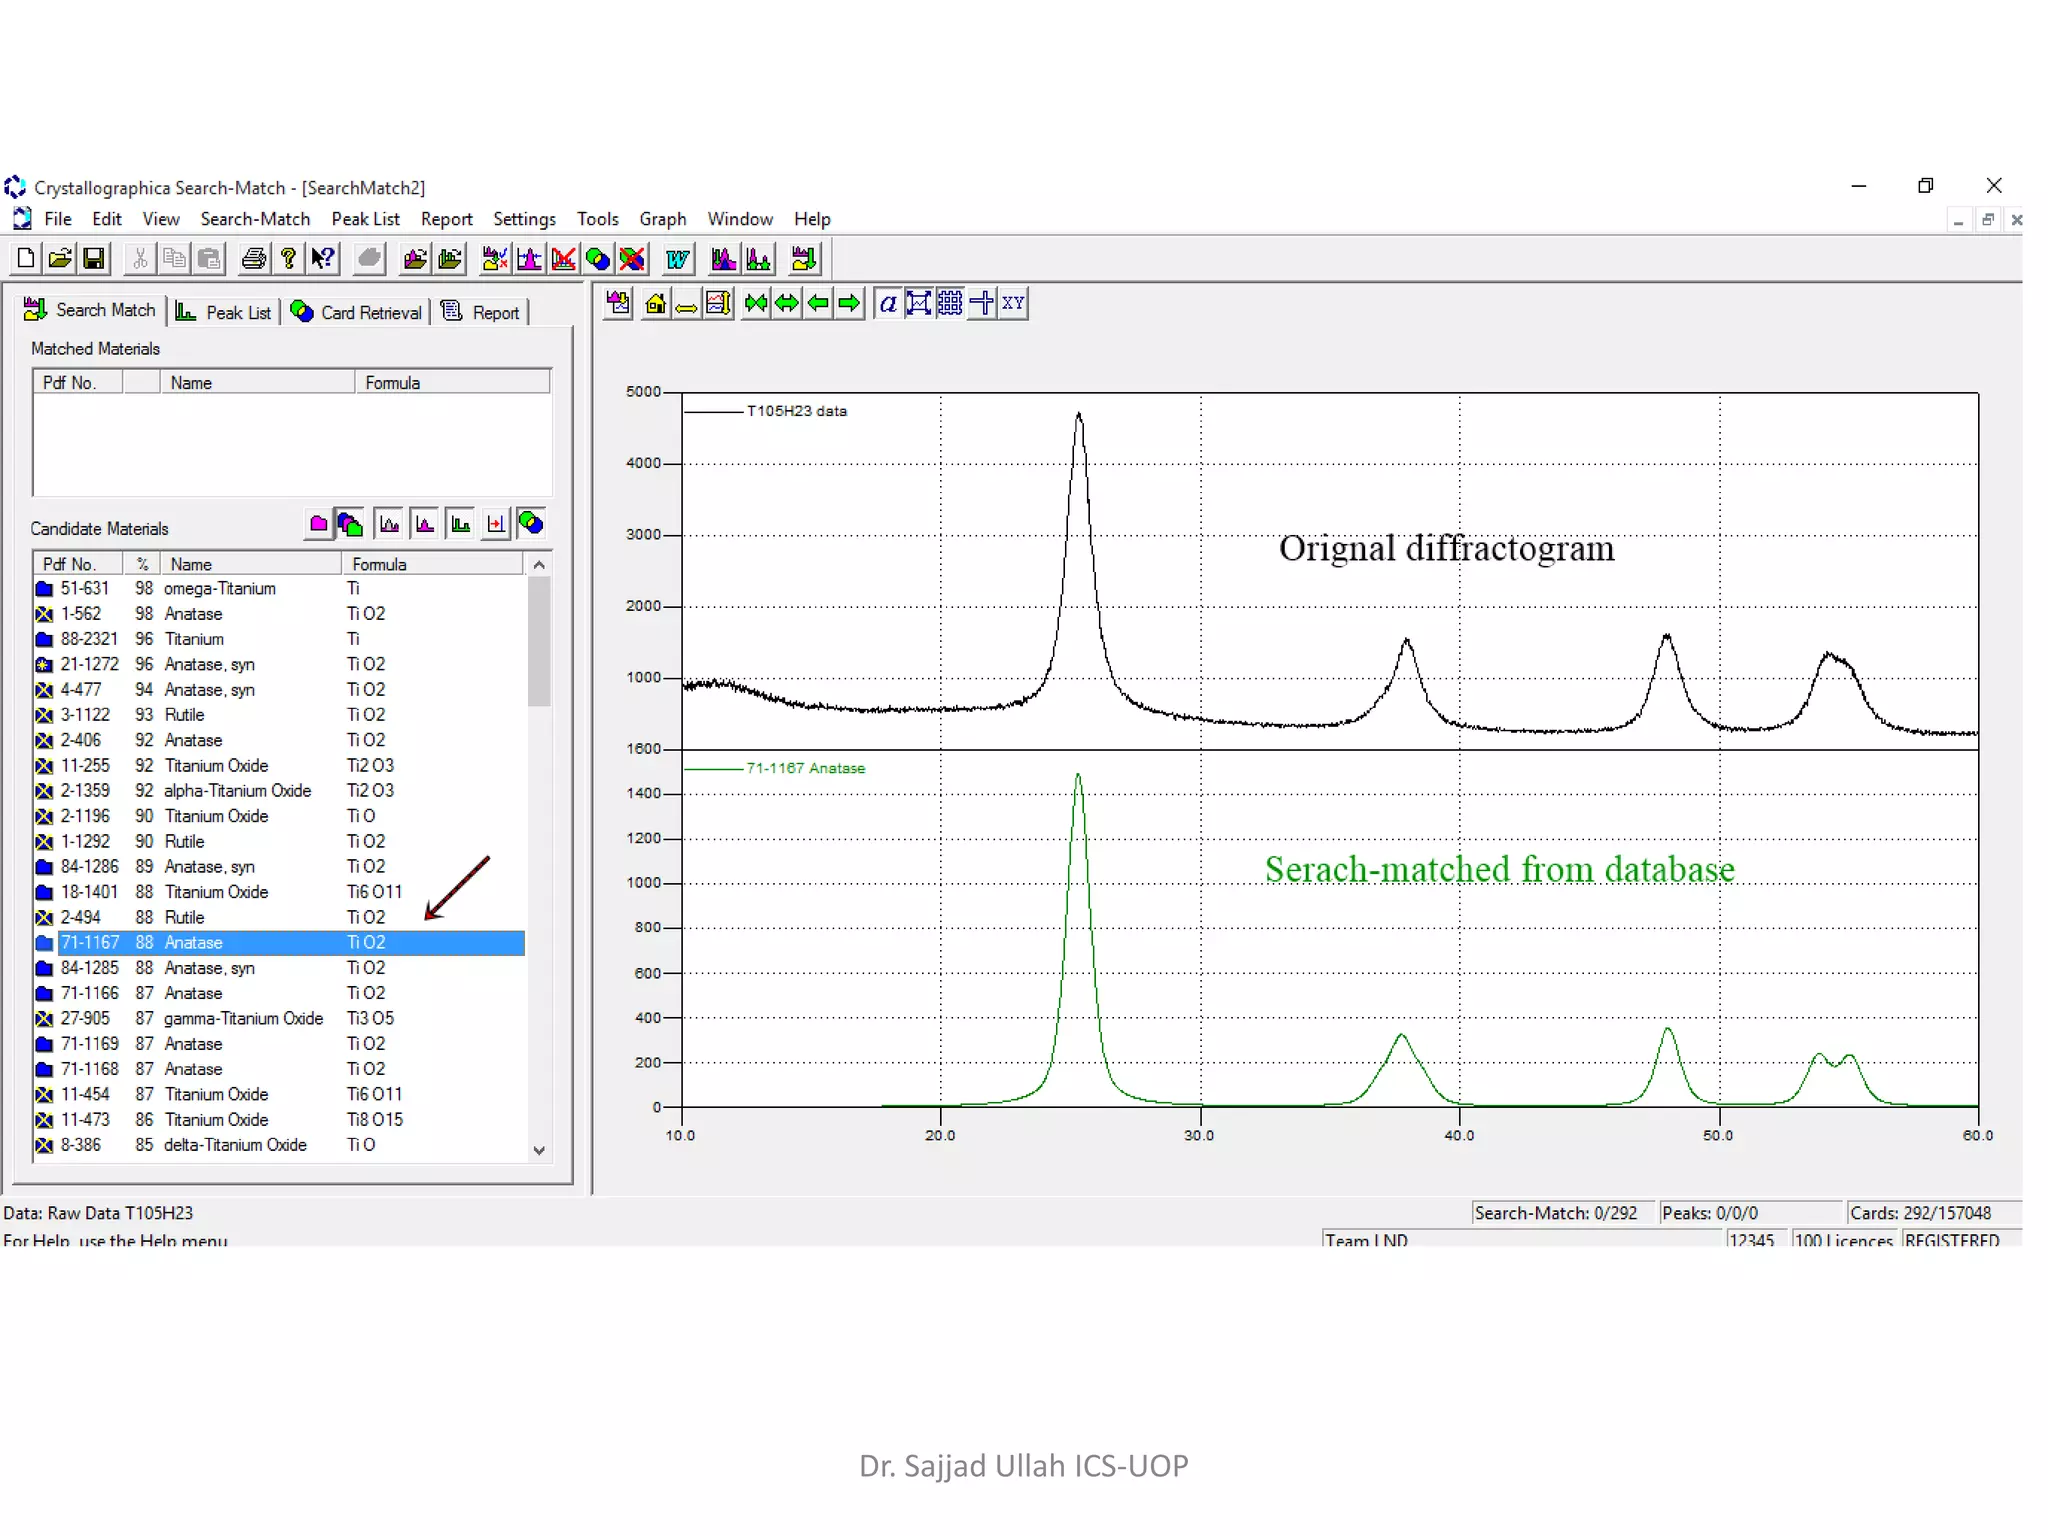
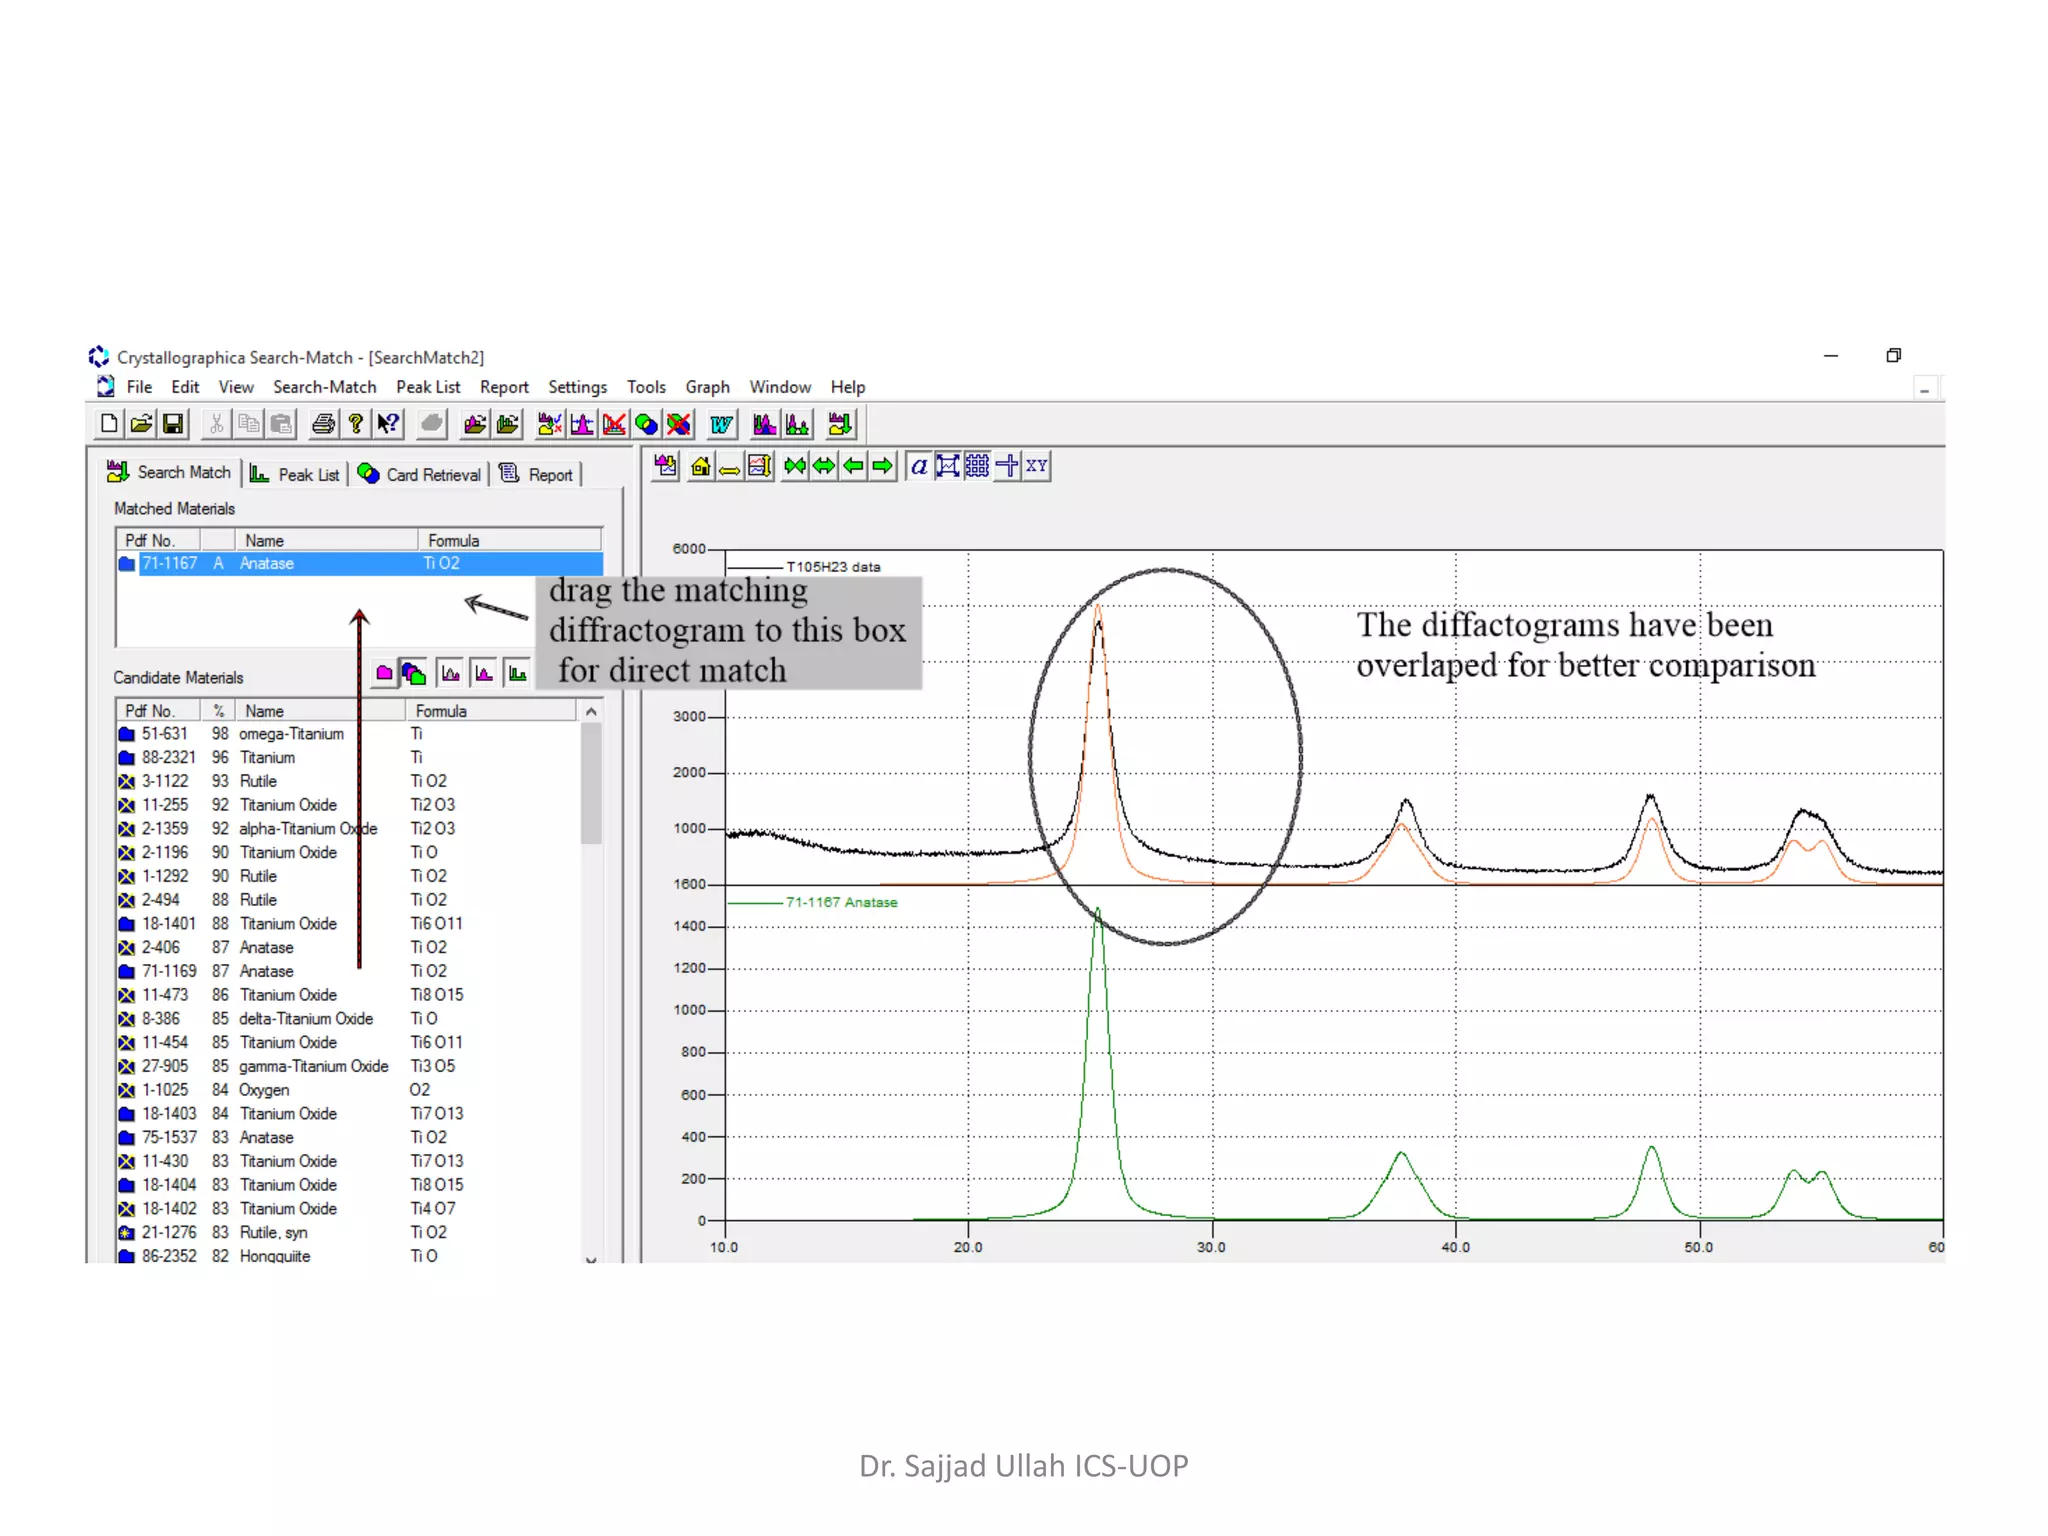
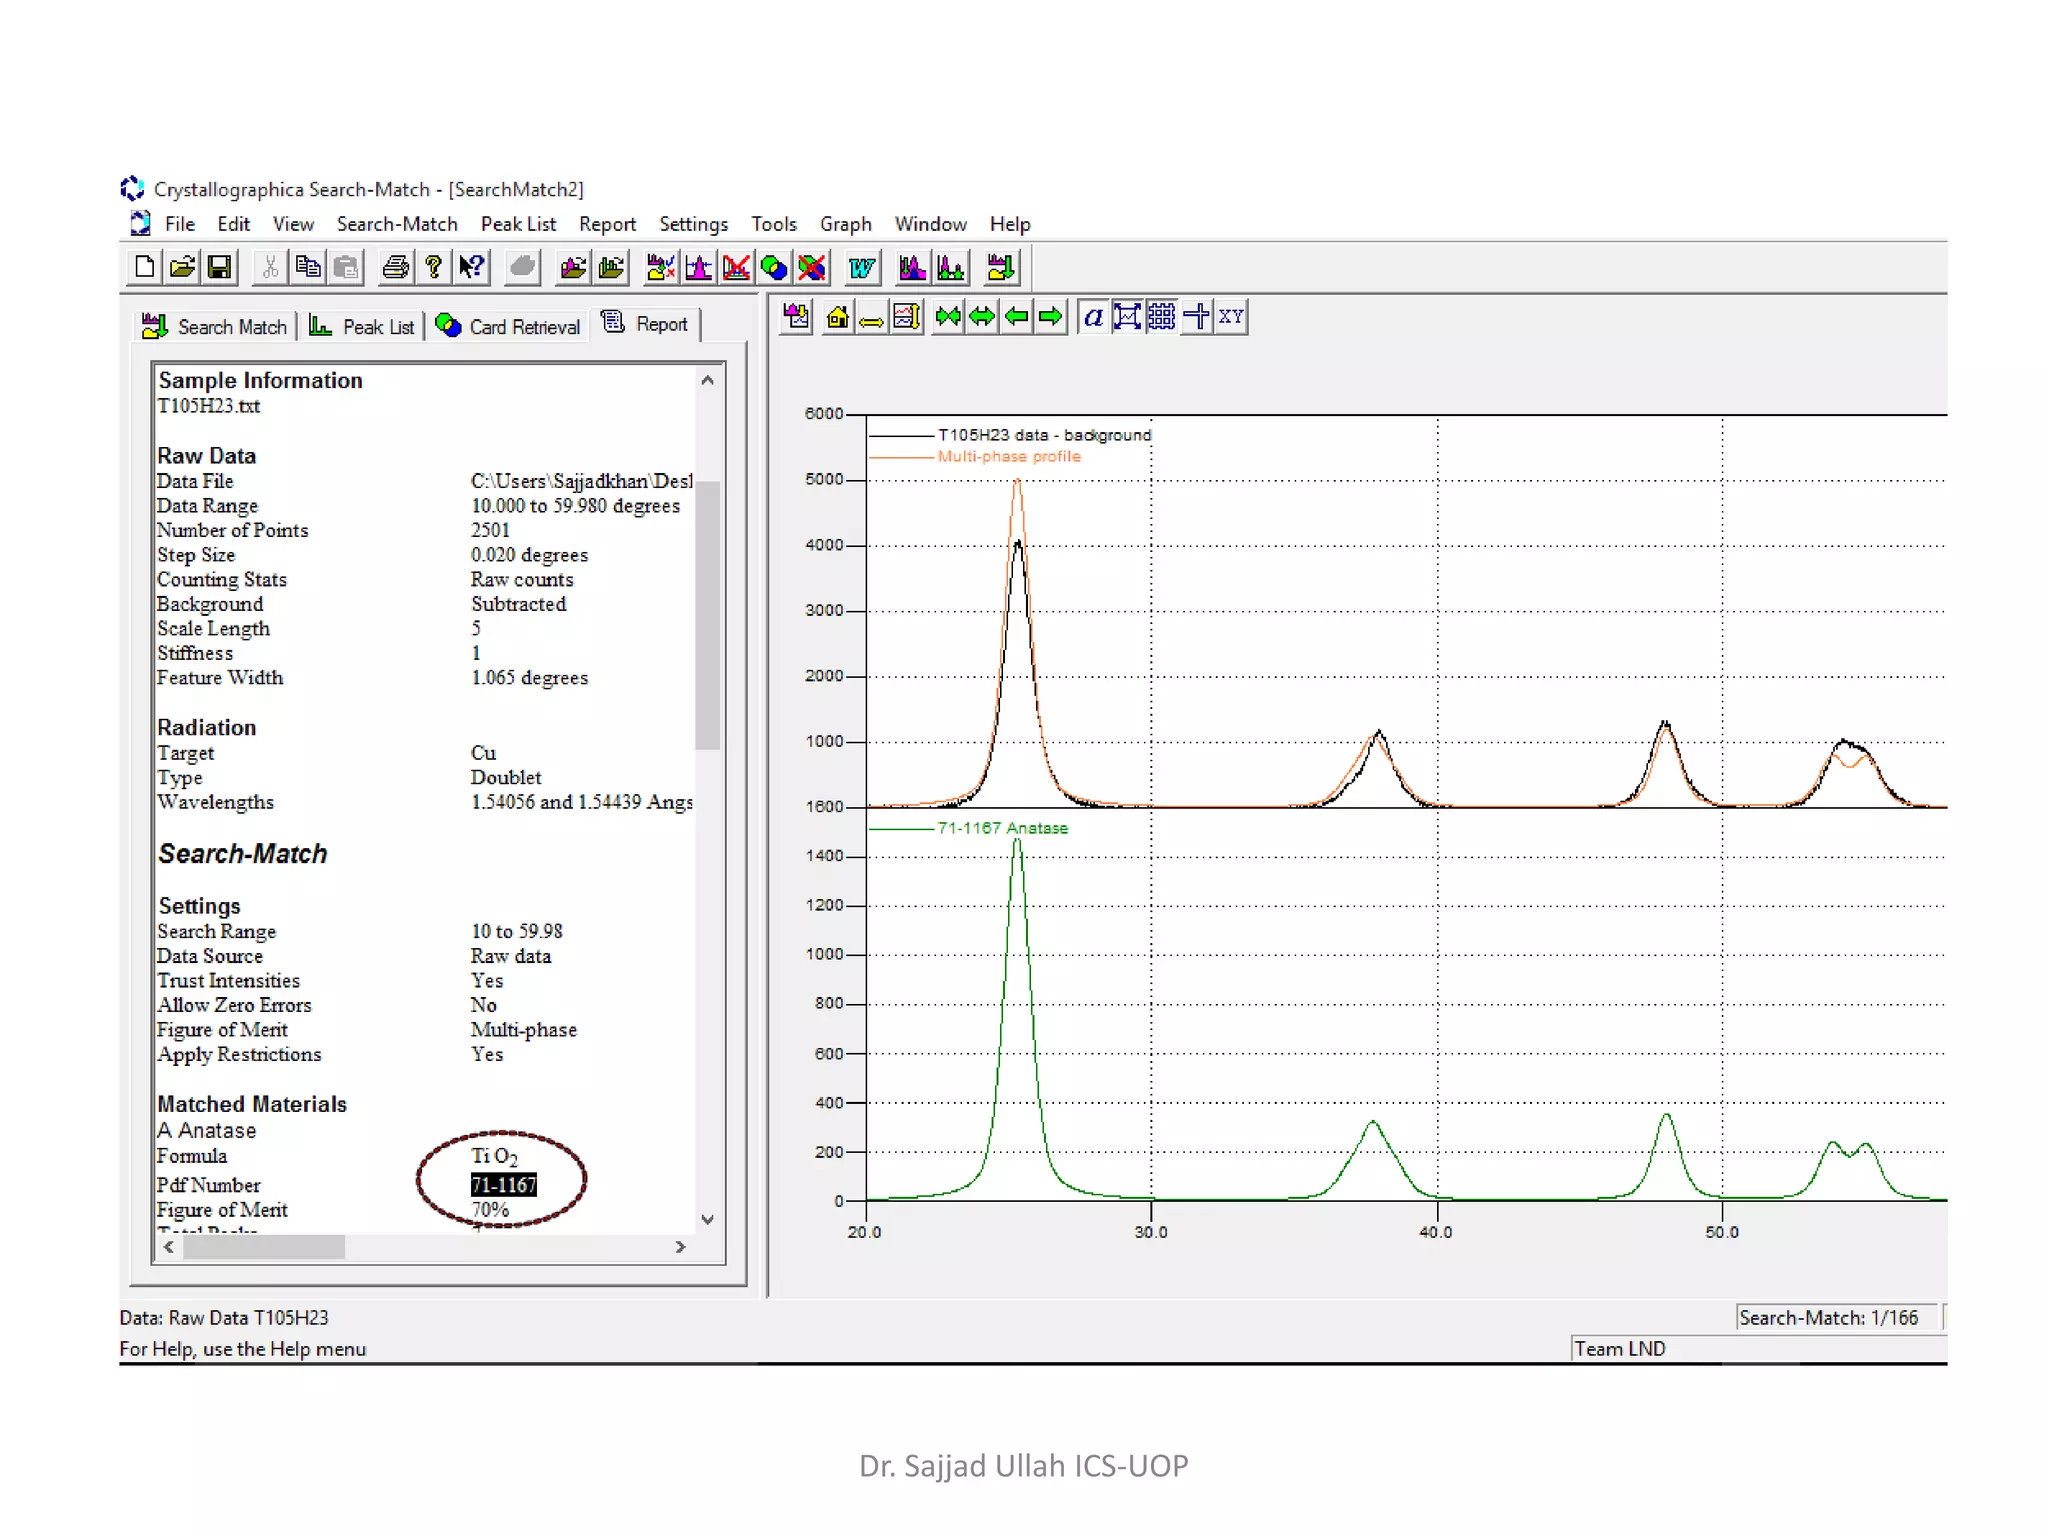
Methods for analyzing crystallinity, phase identification, and utilizing Search-match software in XRD.
Identifying materials using XRD patterns and JCPDS files for phase purity and crystallinity assessment.
Crystallite size estimation using Scherrer Formula, discussing peak broadening effects due to particle size.
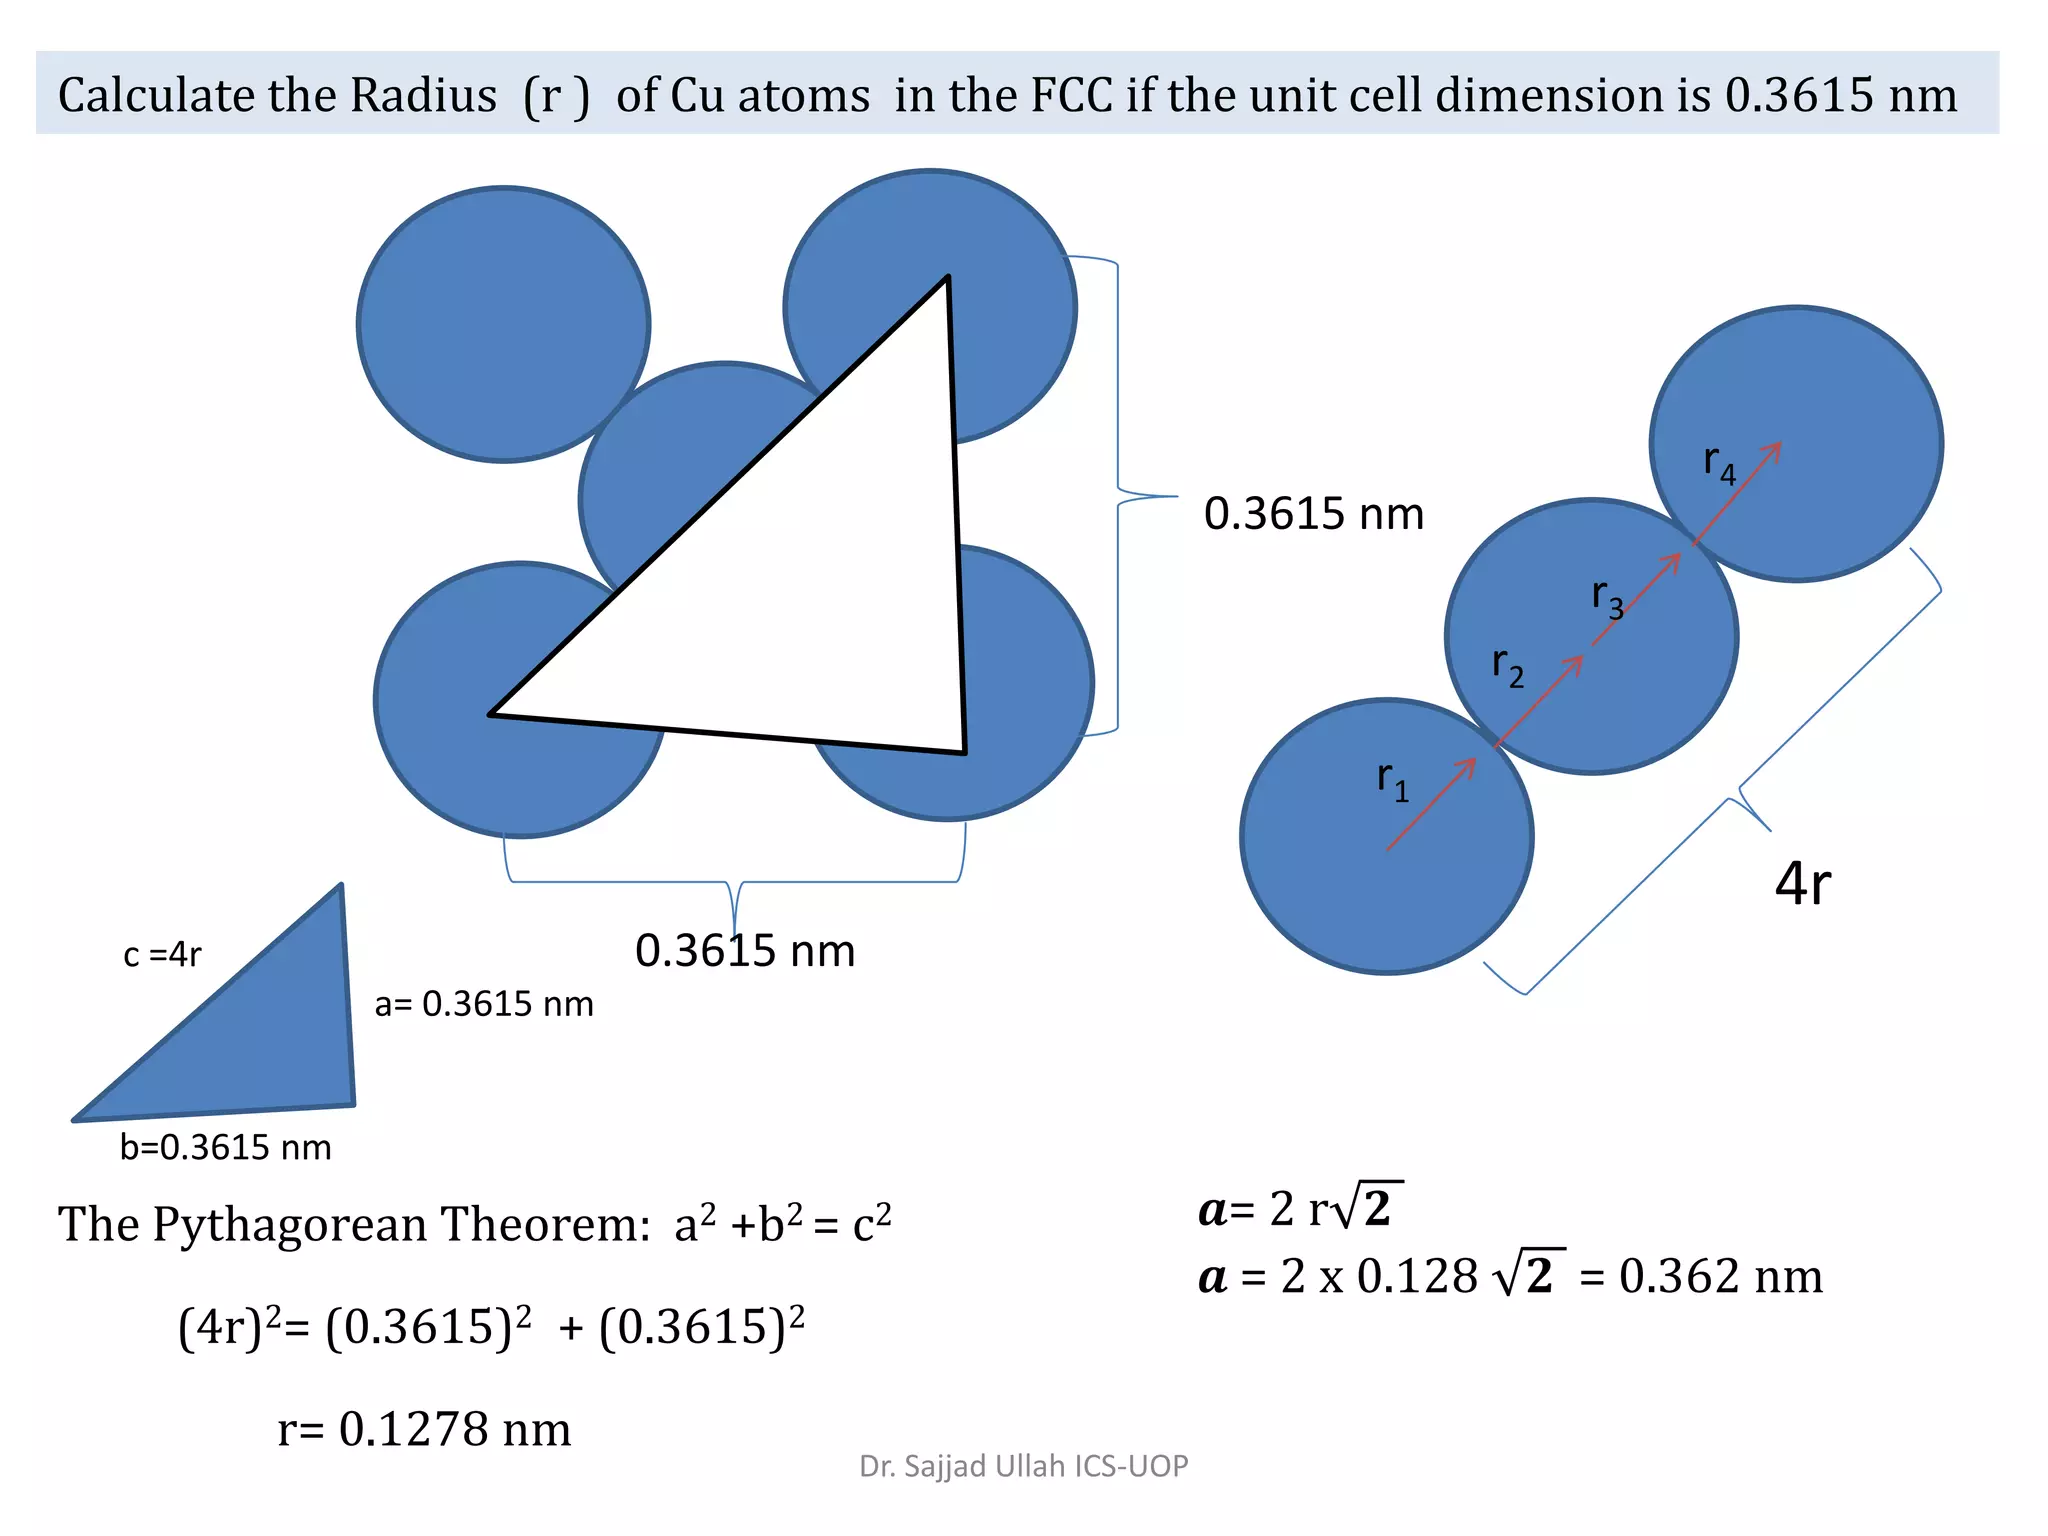
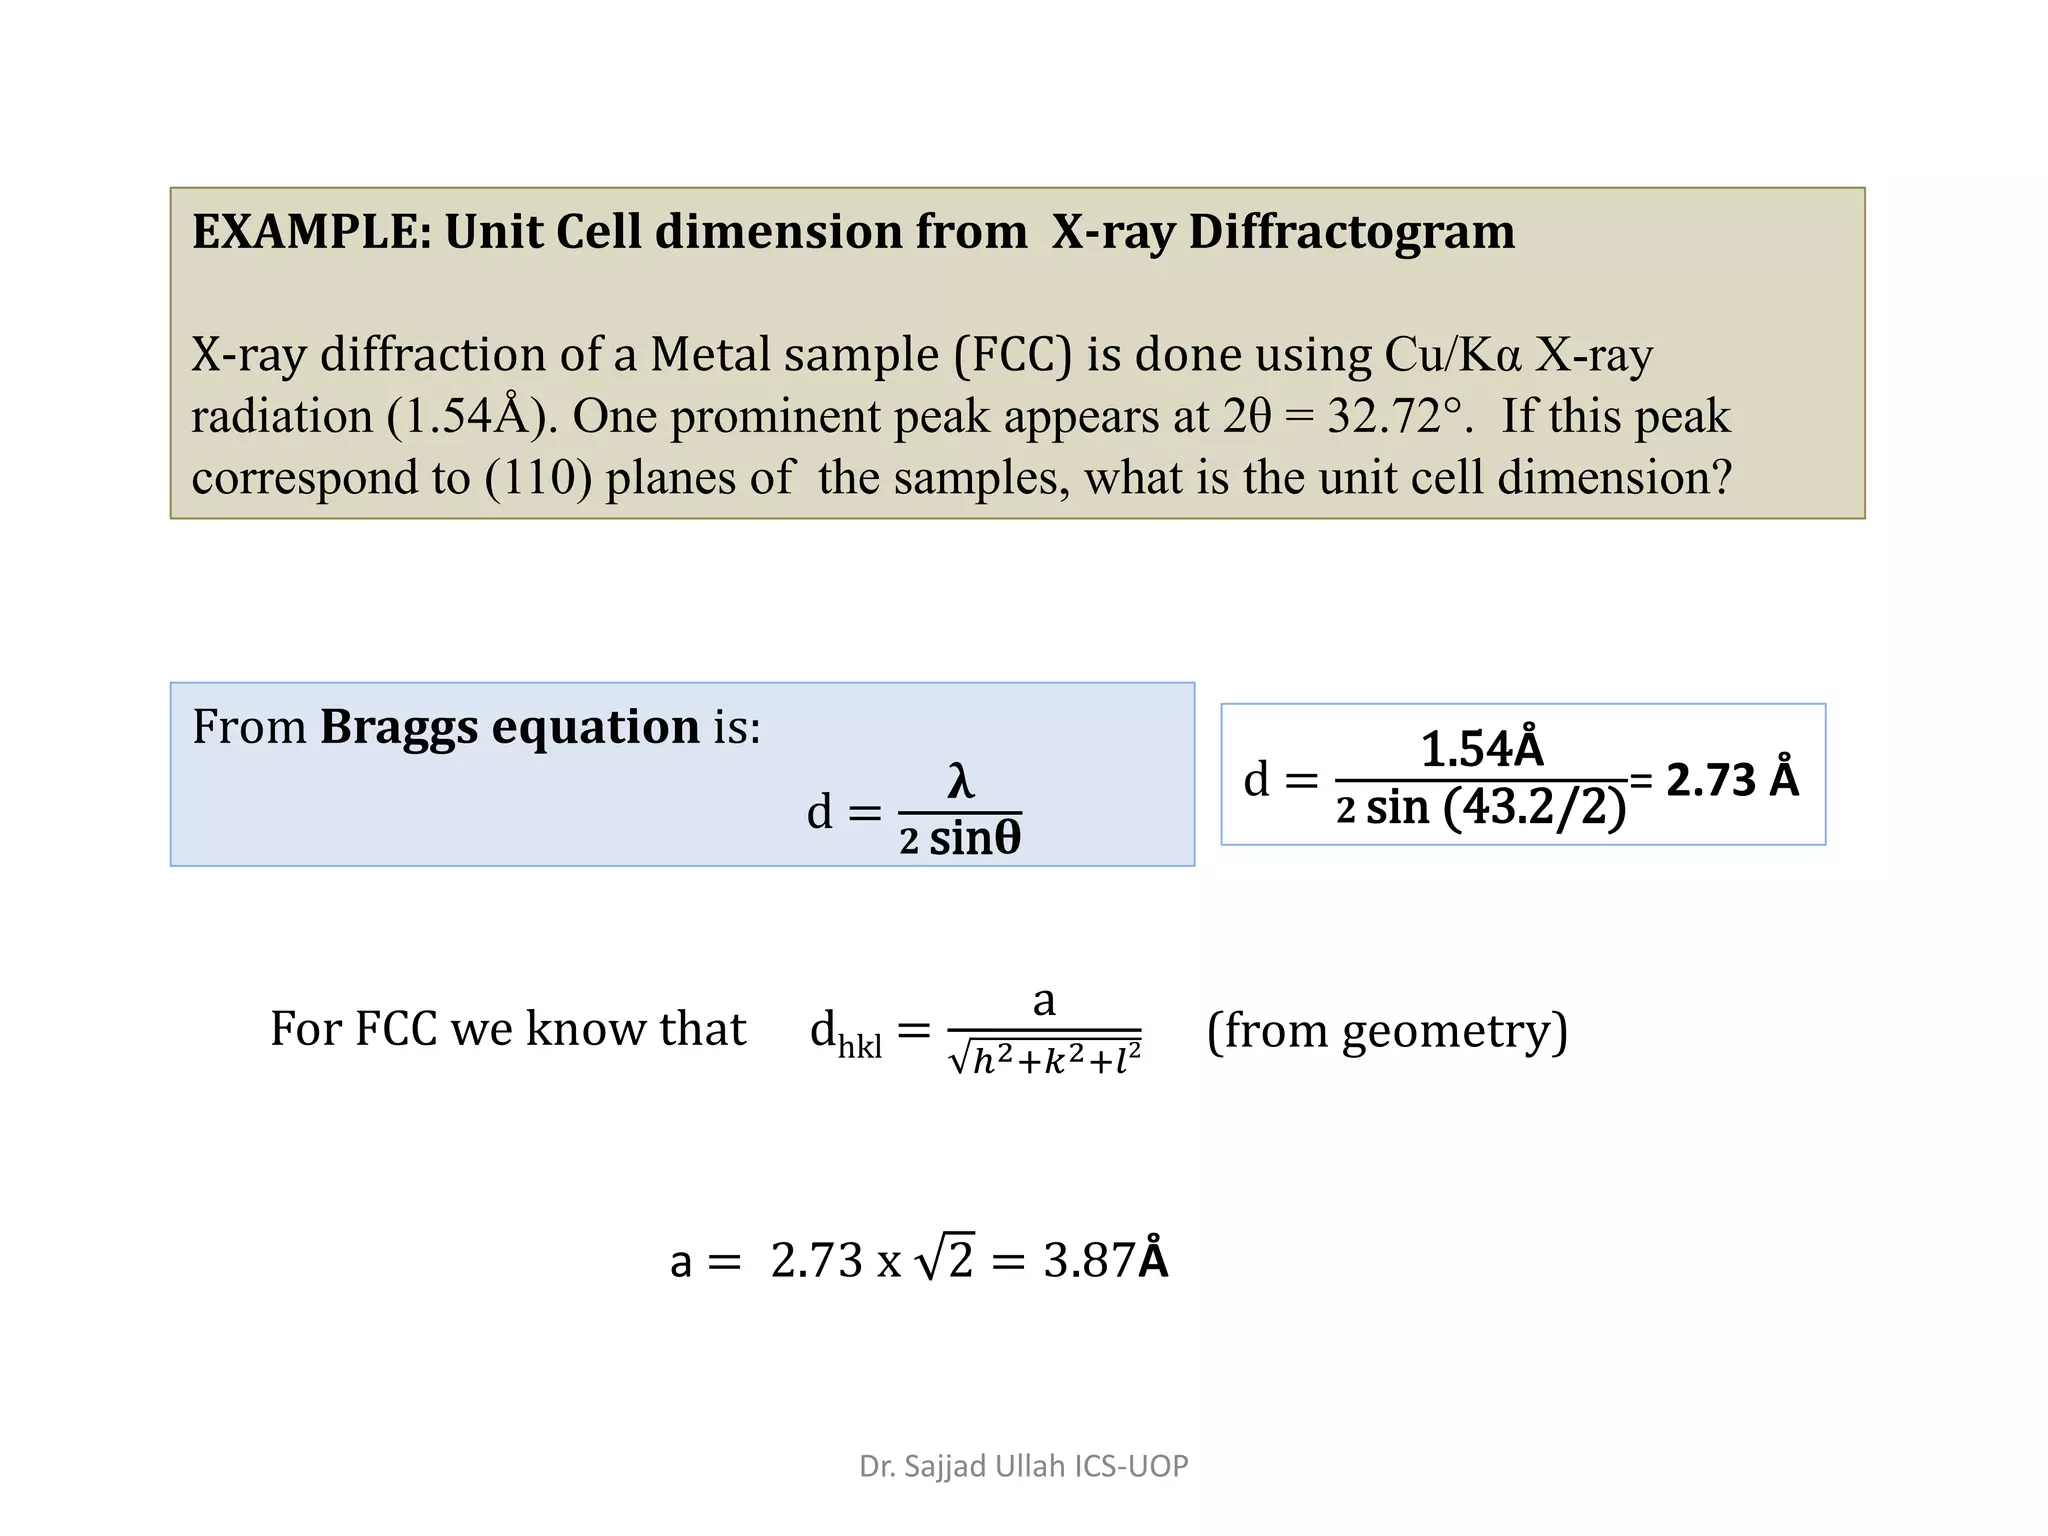
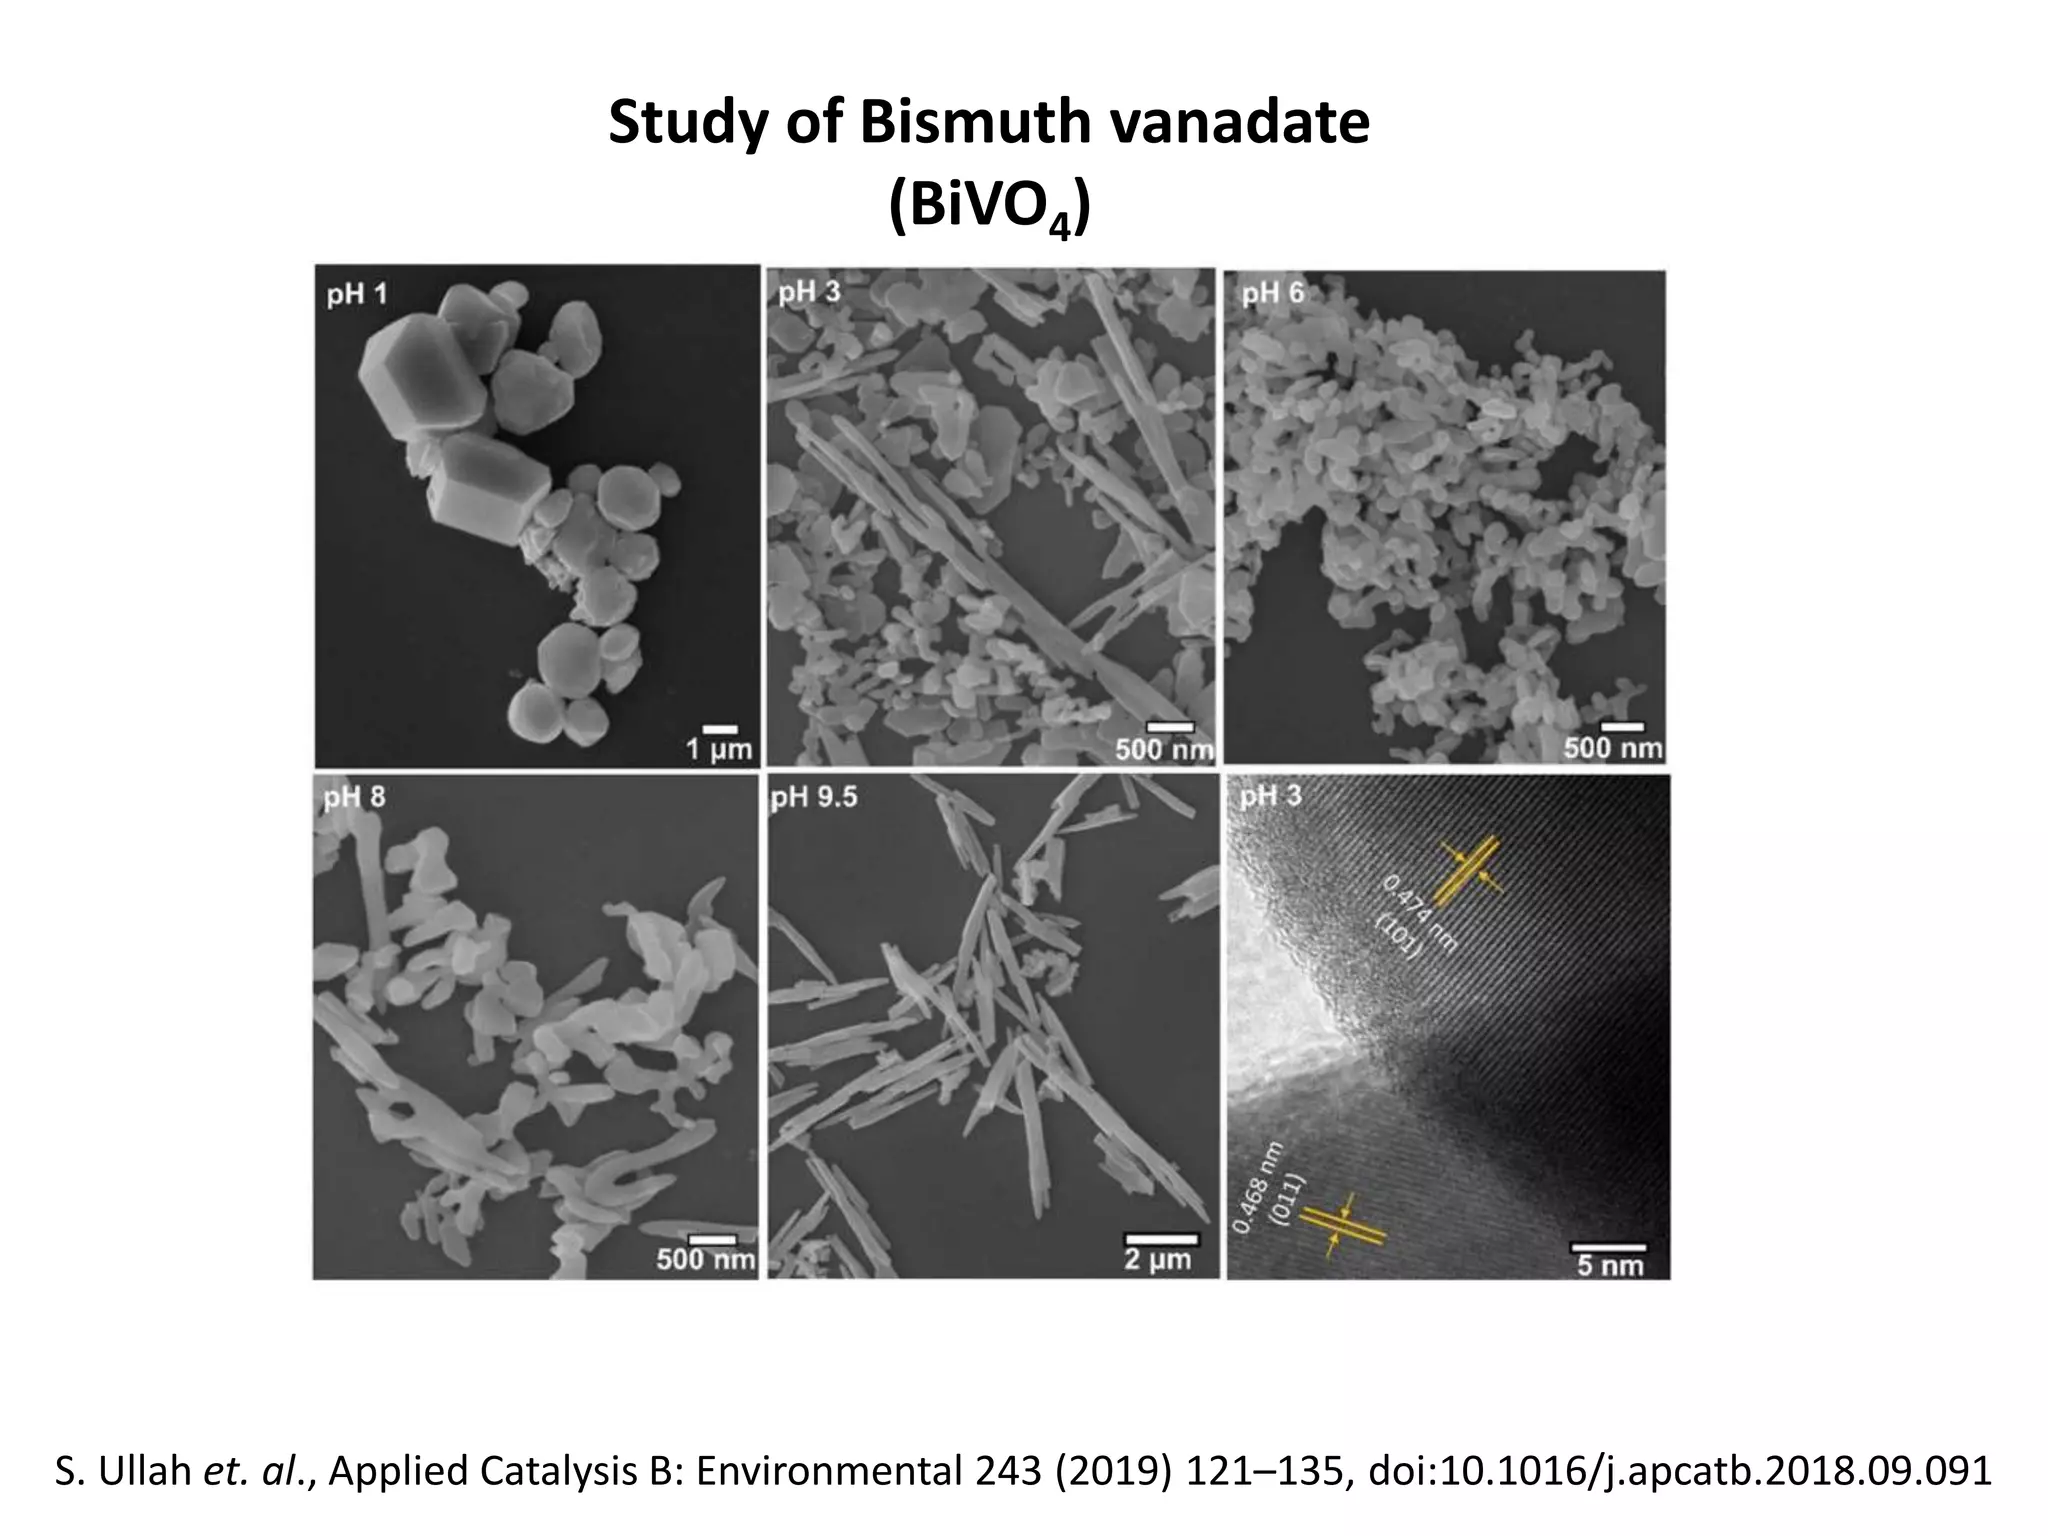
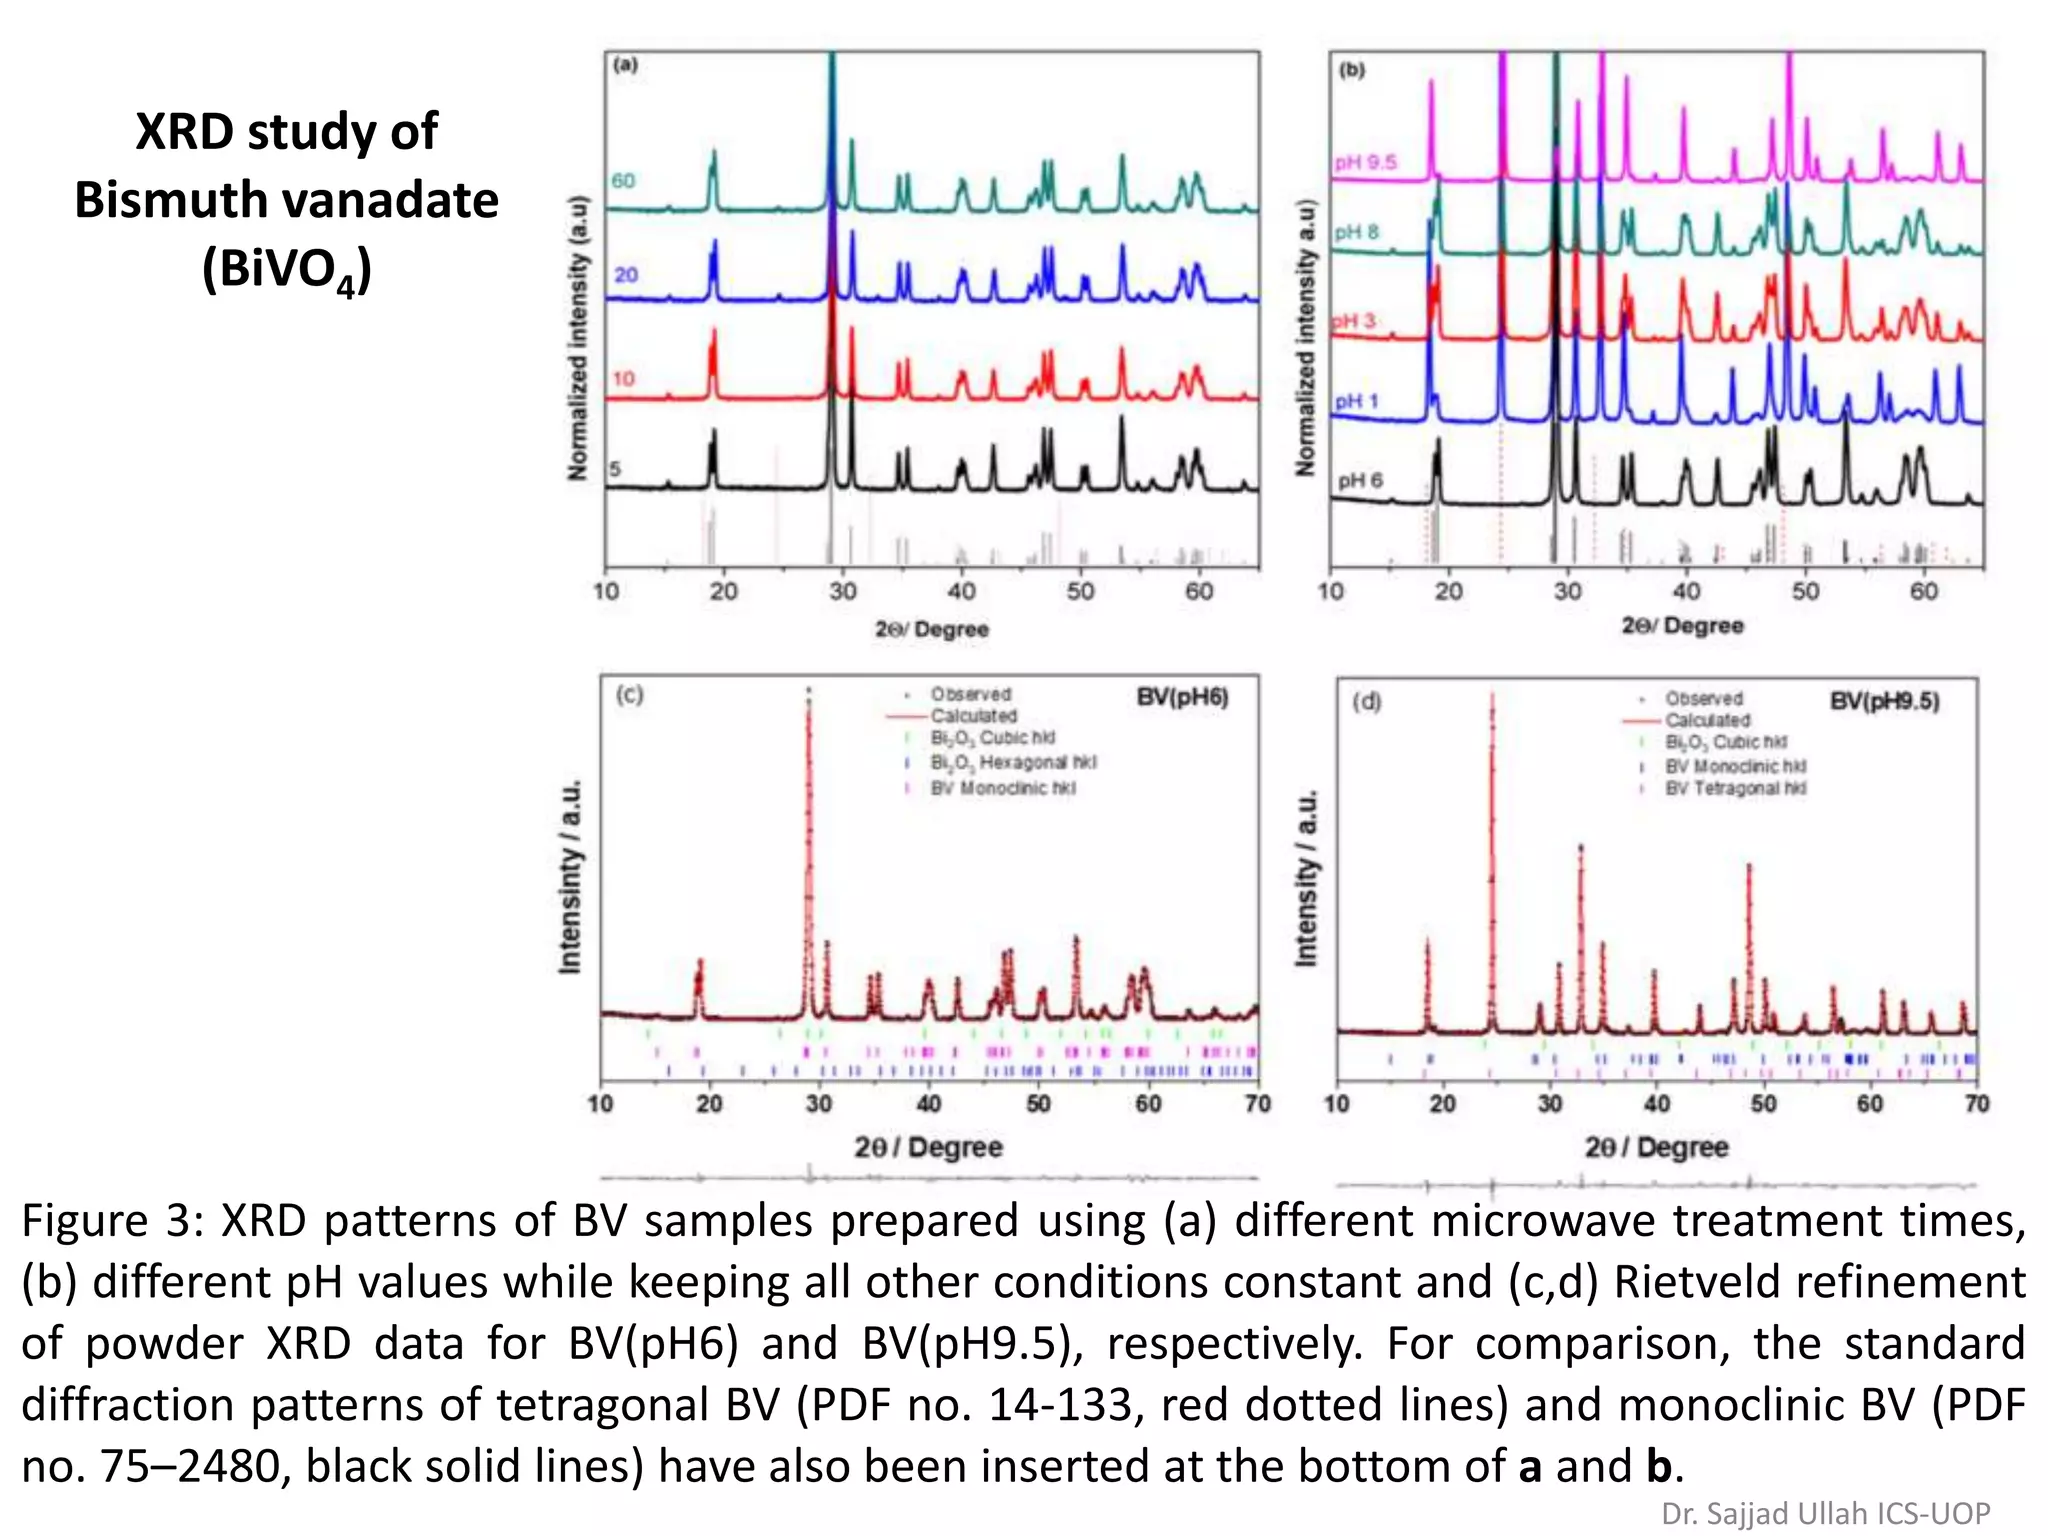
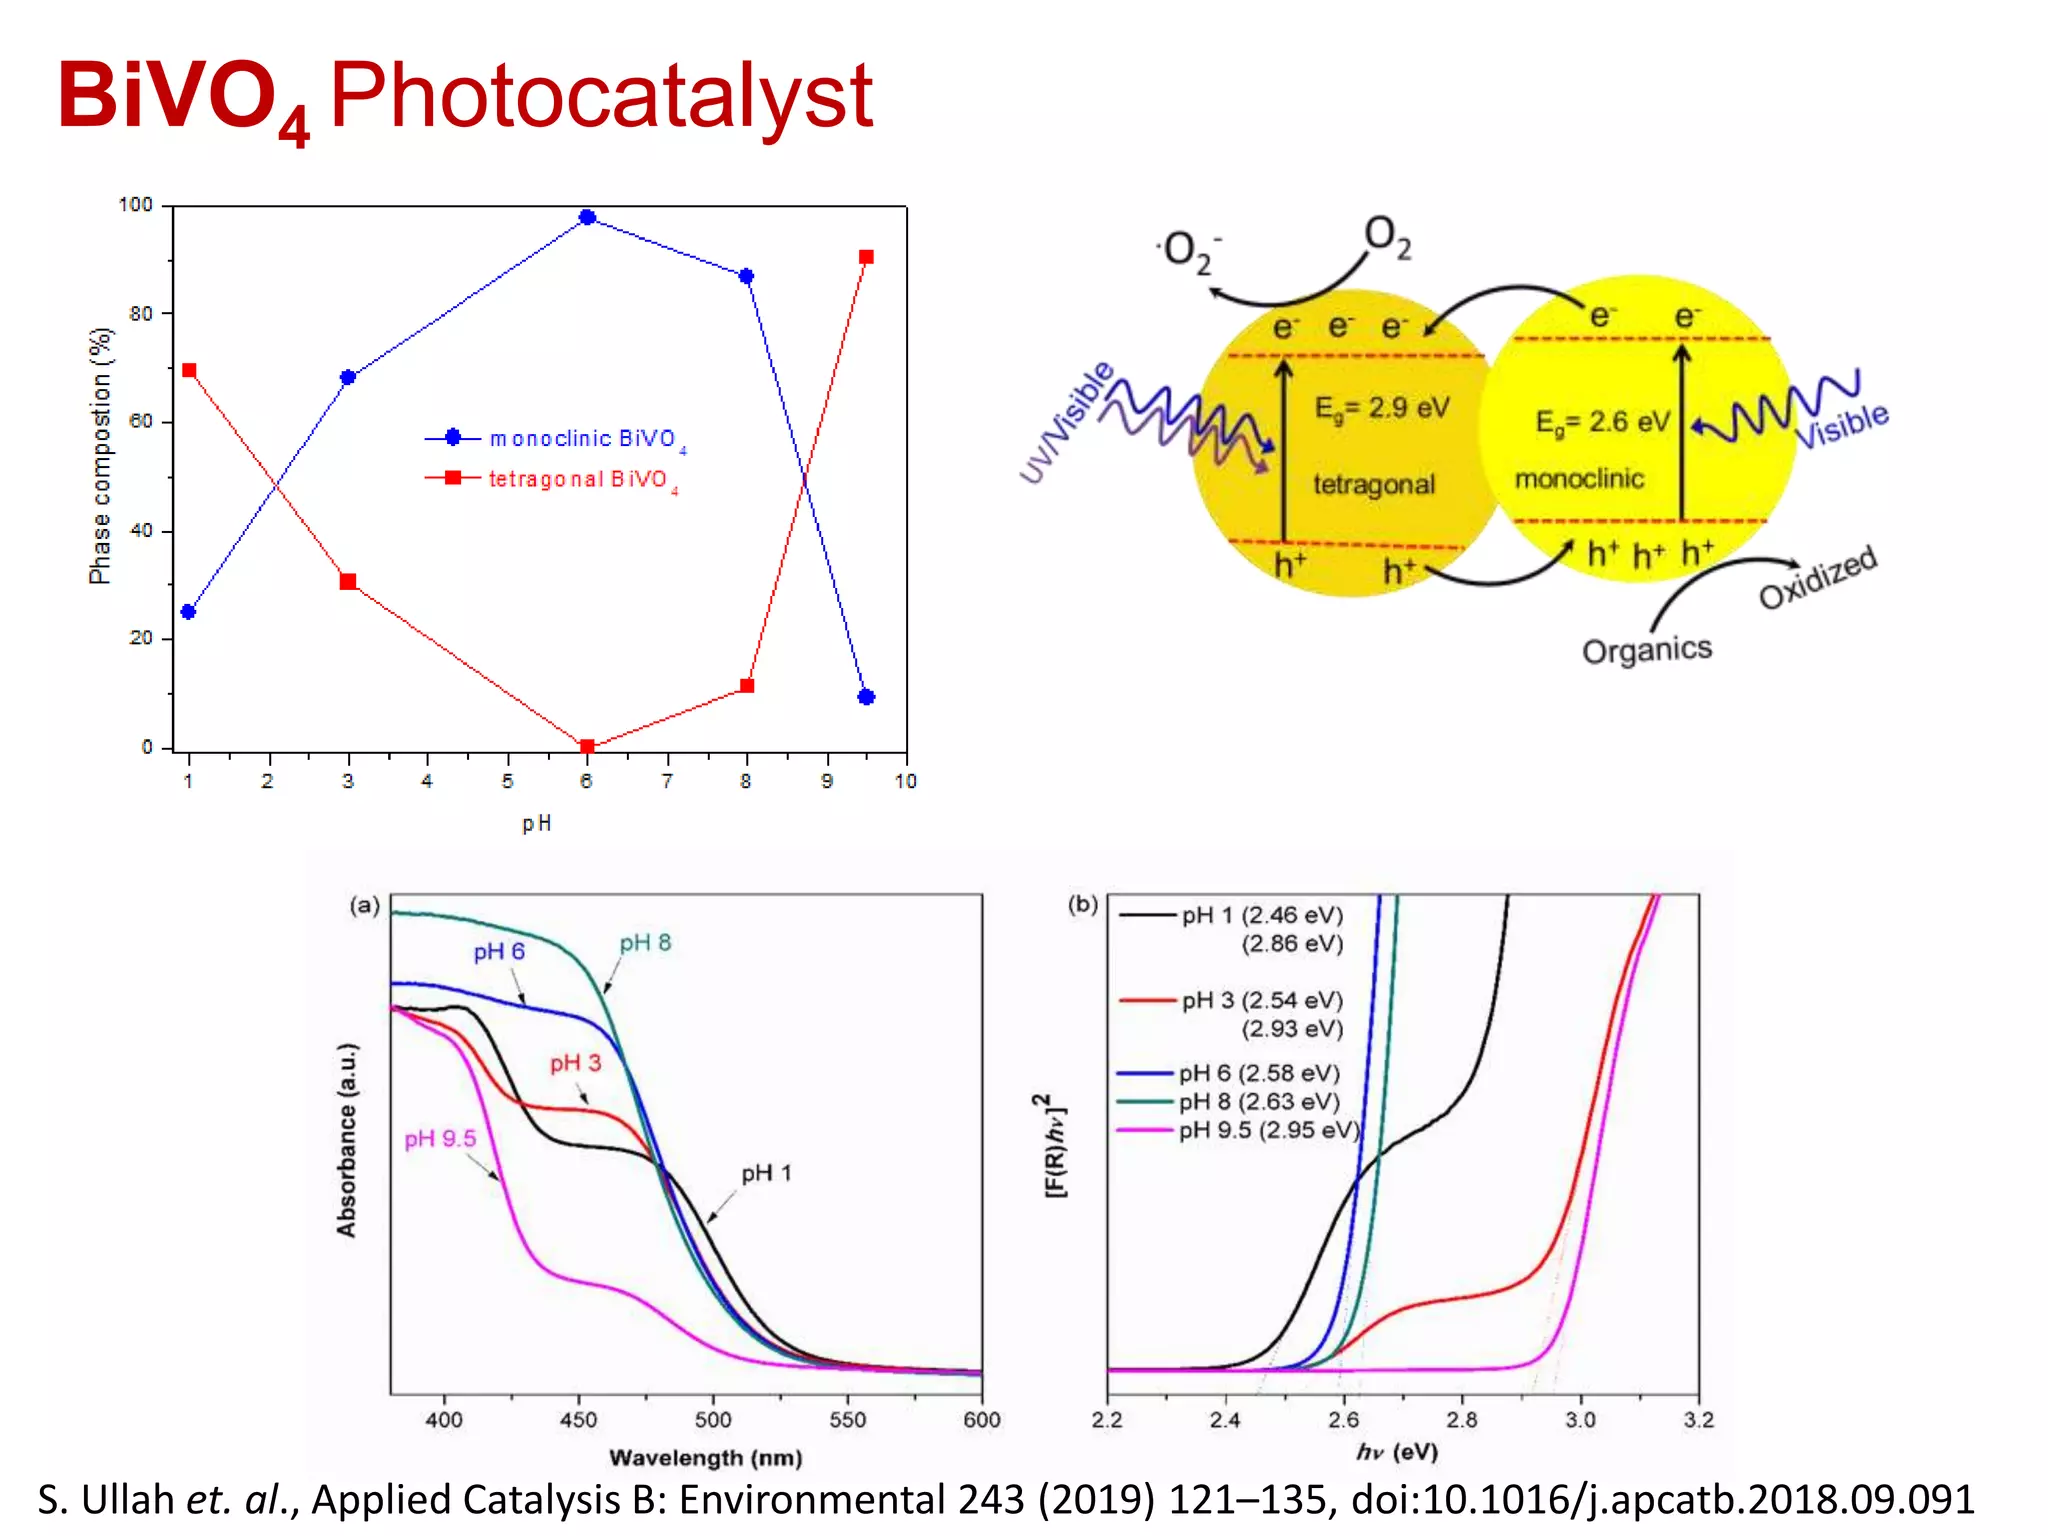
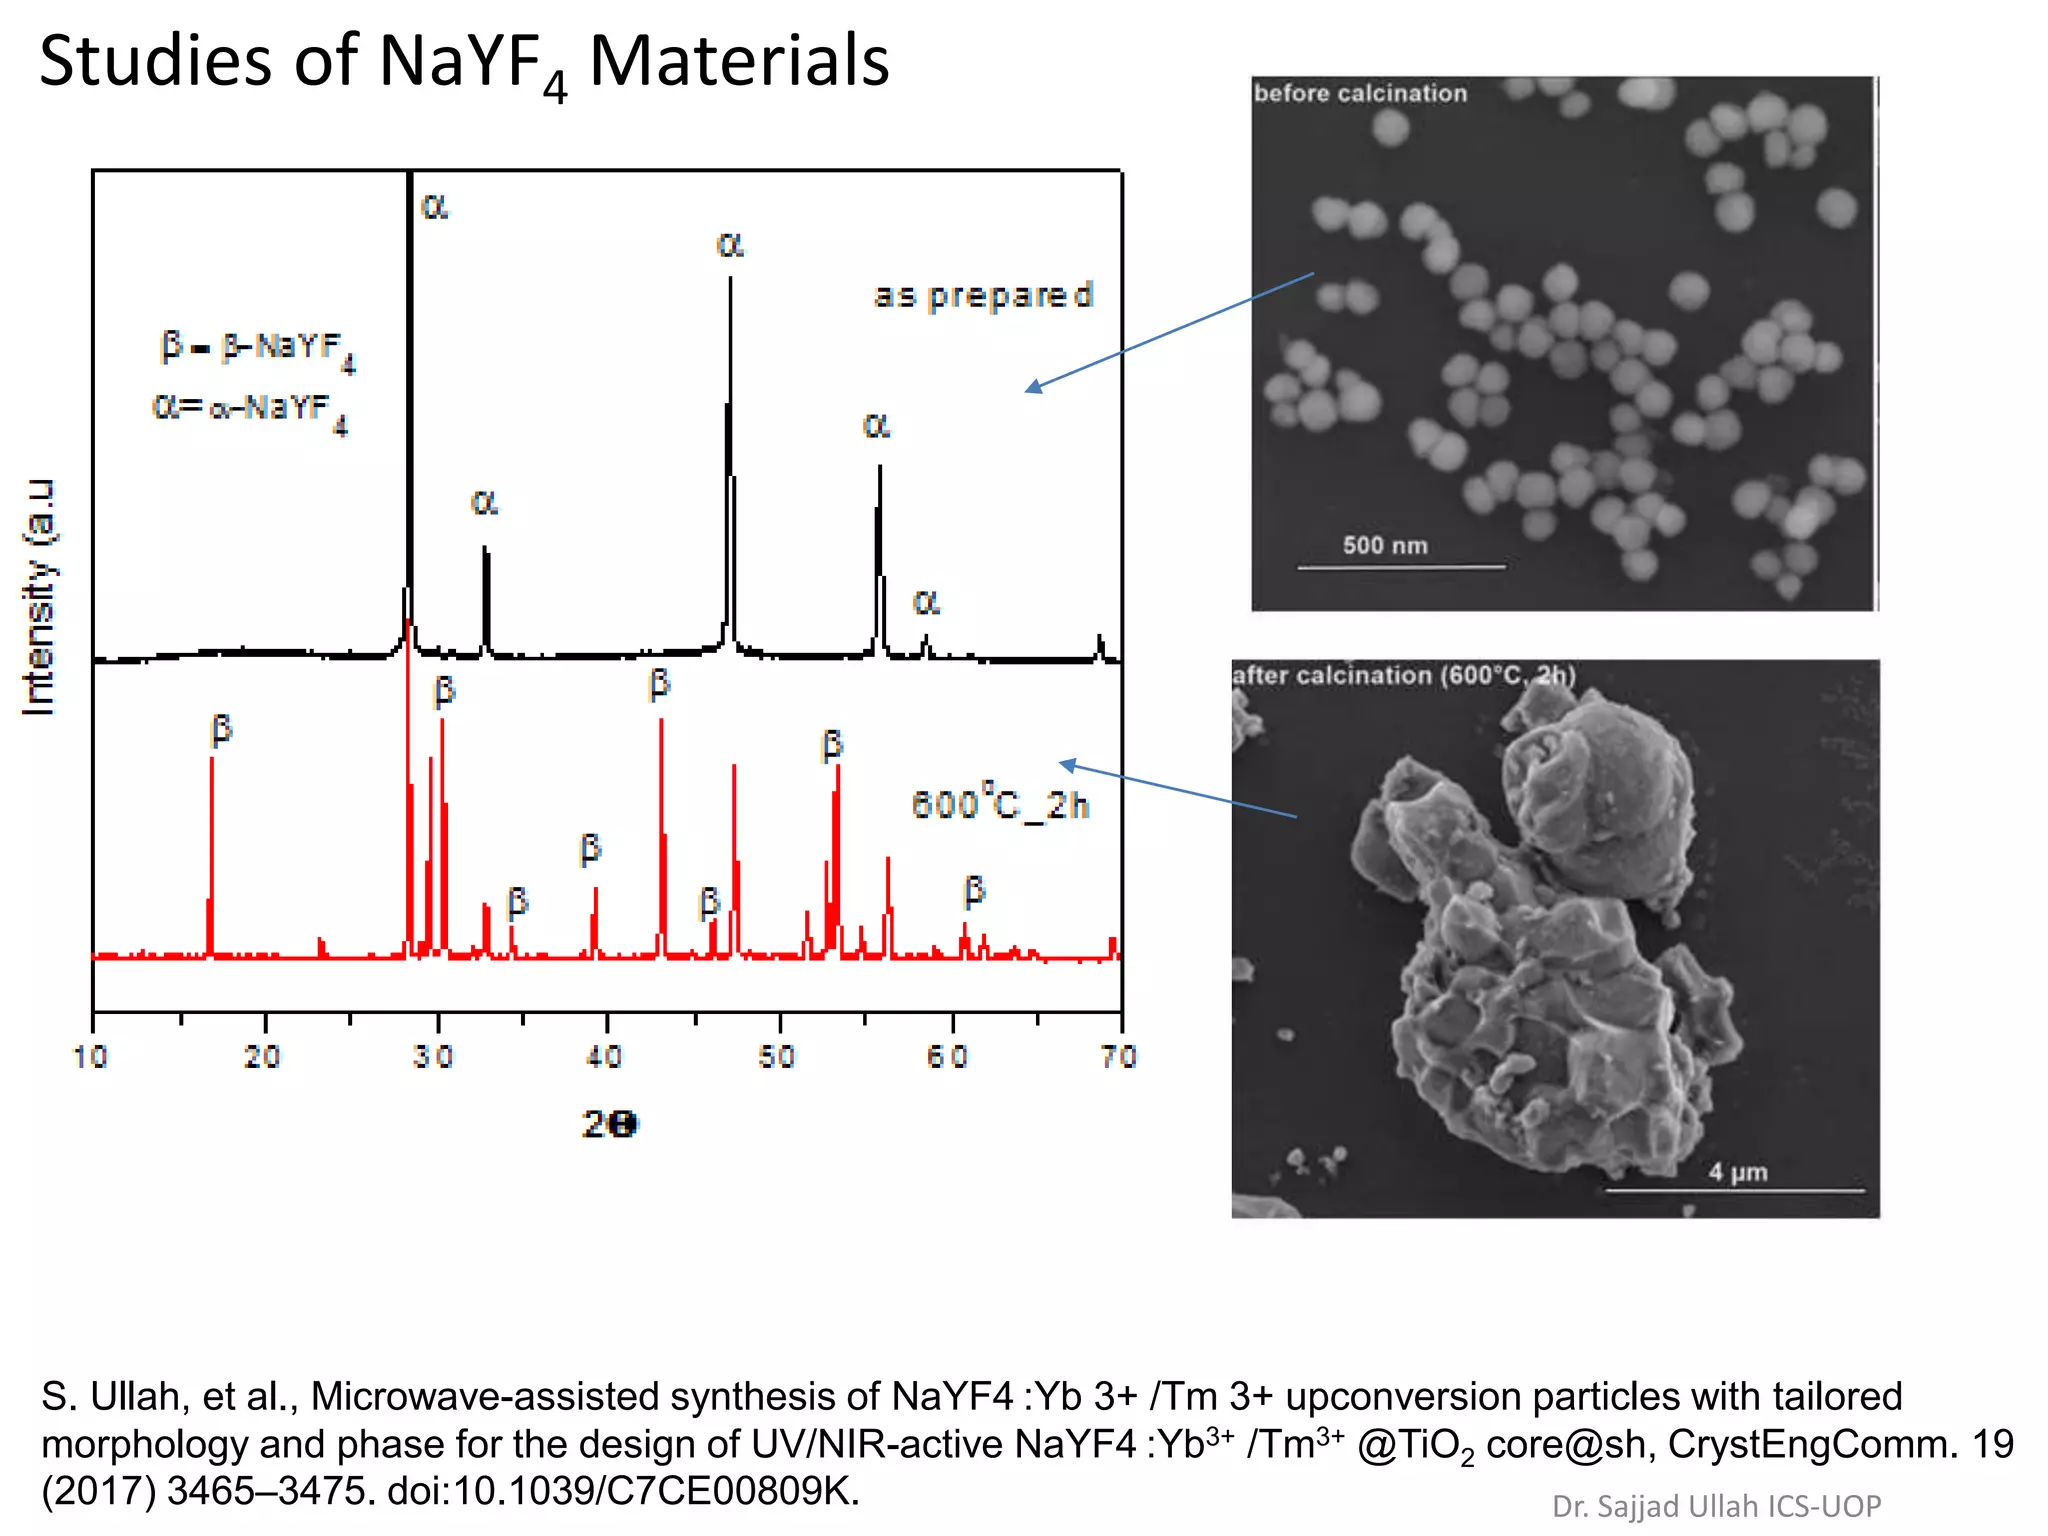
Measuring unit cell sizes from XRD data using Bragg's equation and examples of various materials studied.Case studies on materials like Bismuth vanadate and Laponite, demonstrating practical uses of XRD in material science.


