Download as PDF, PPTX


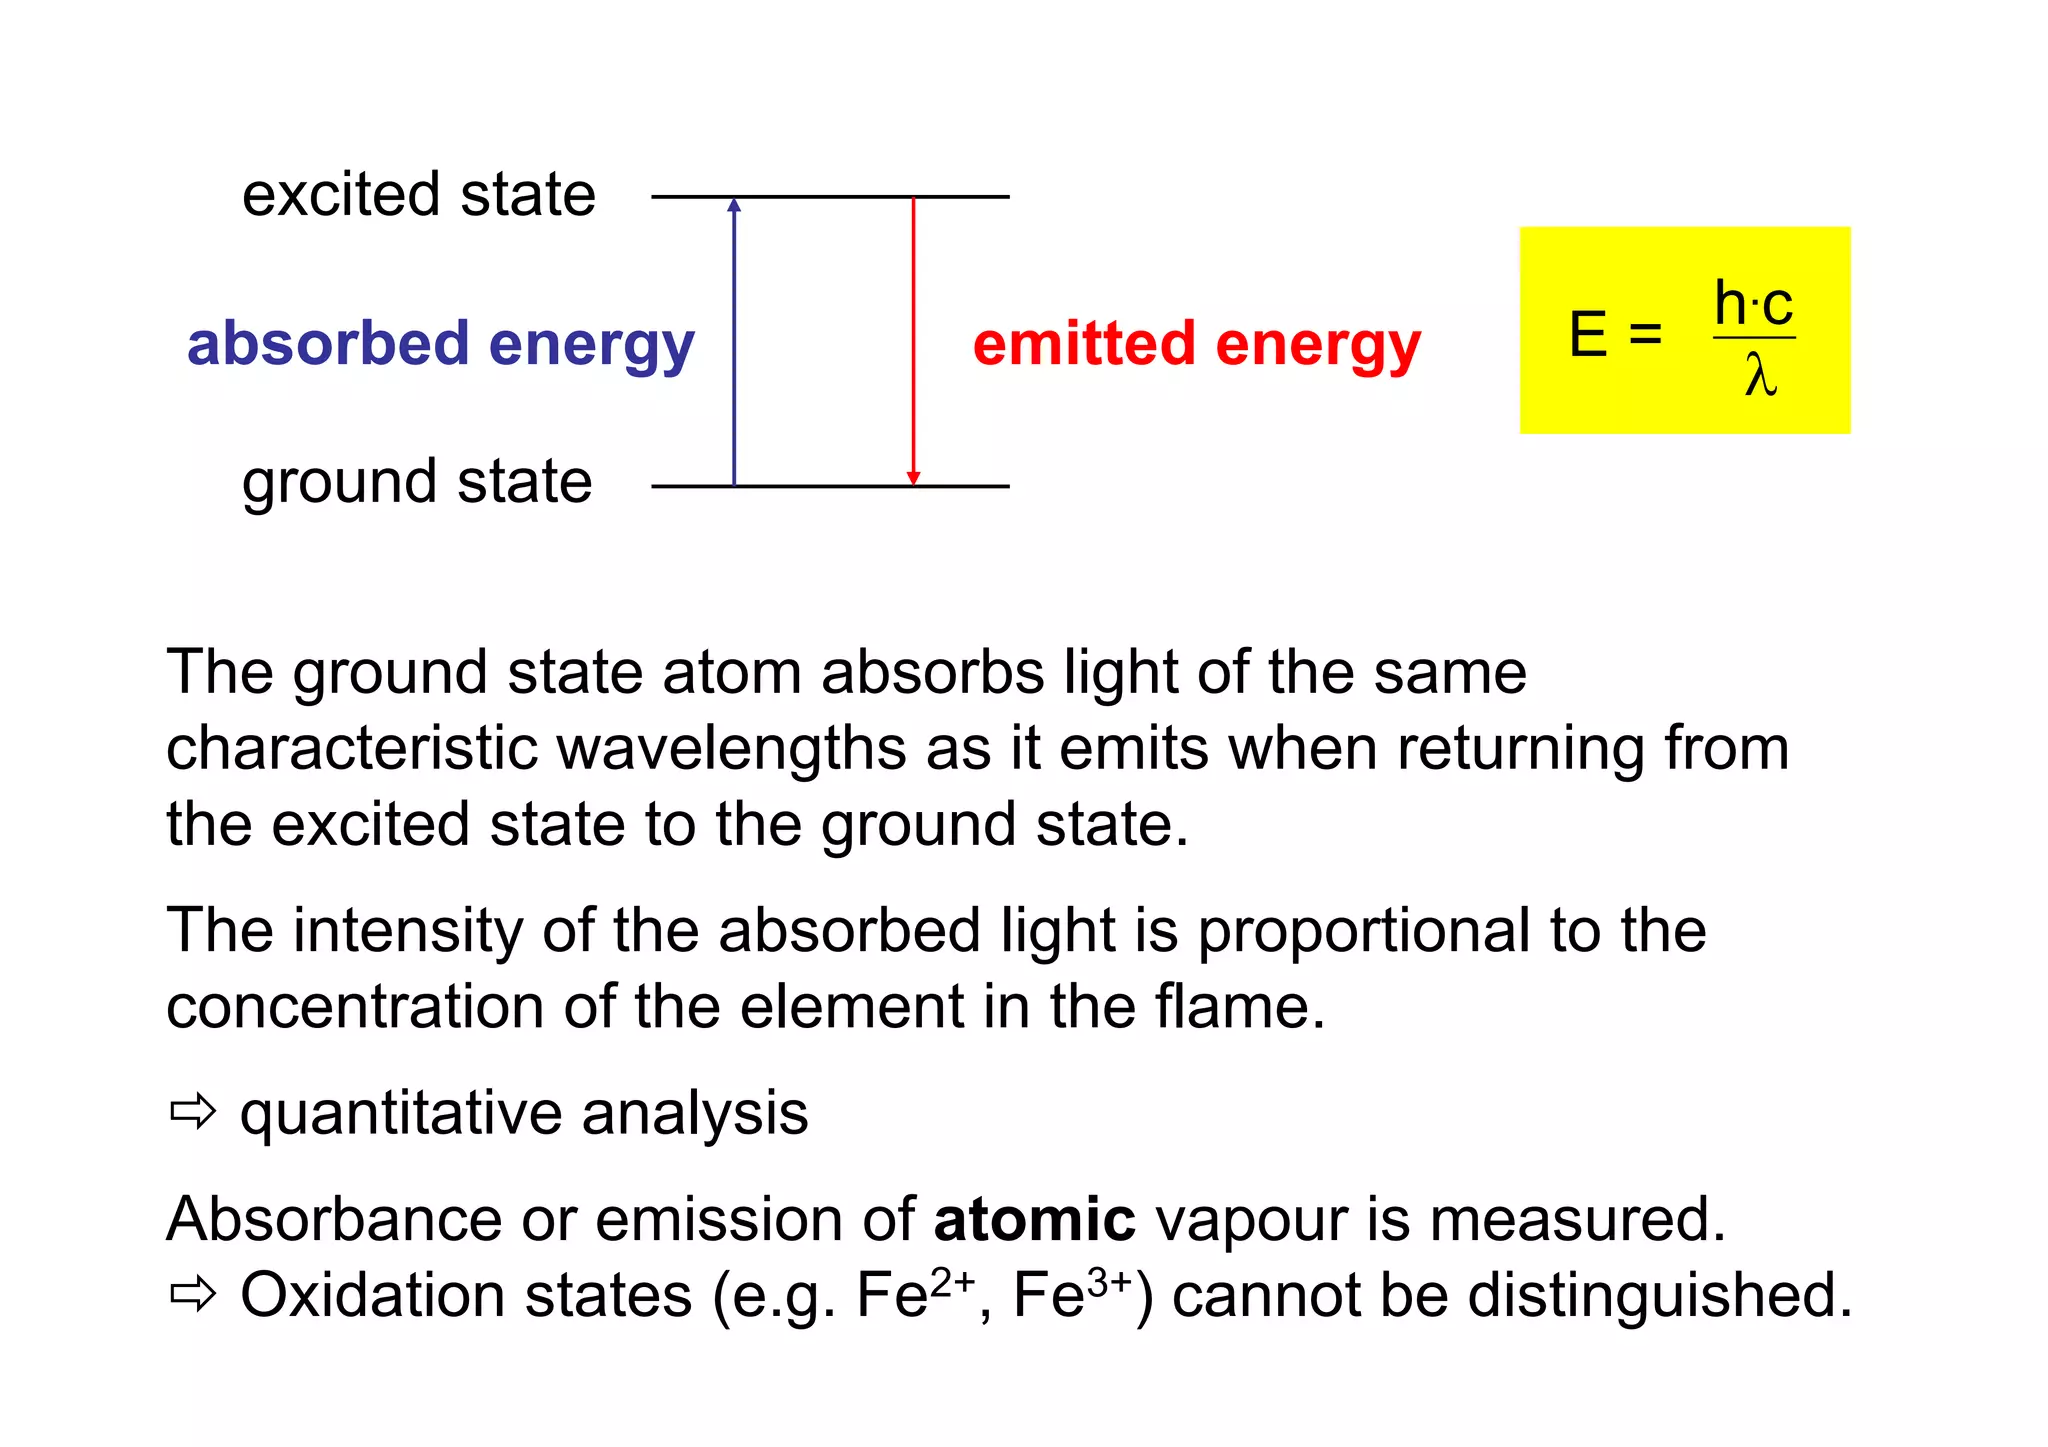


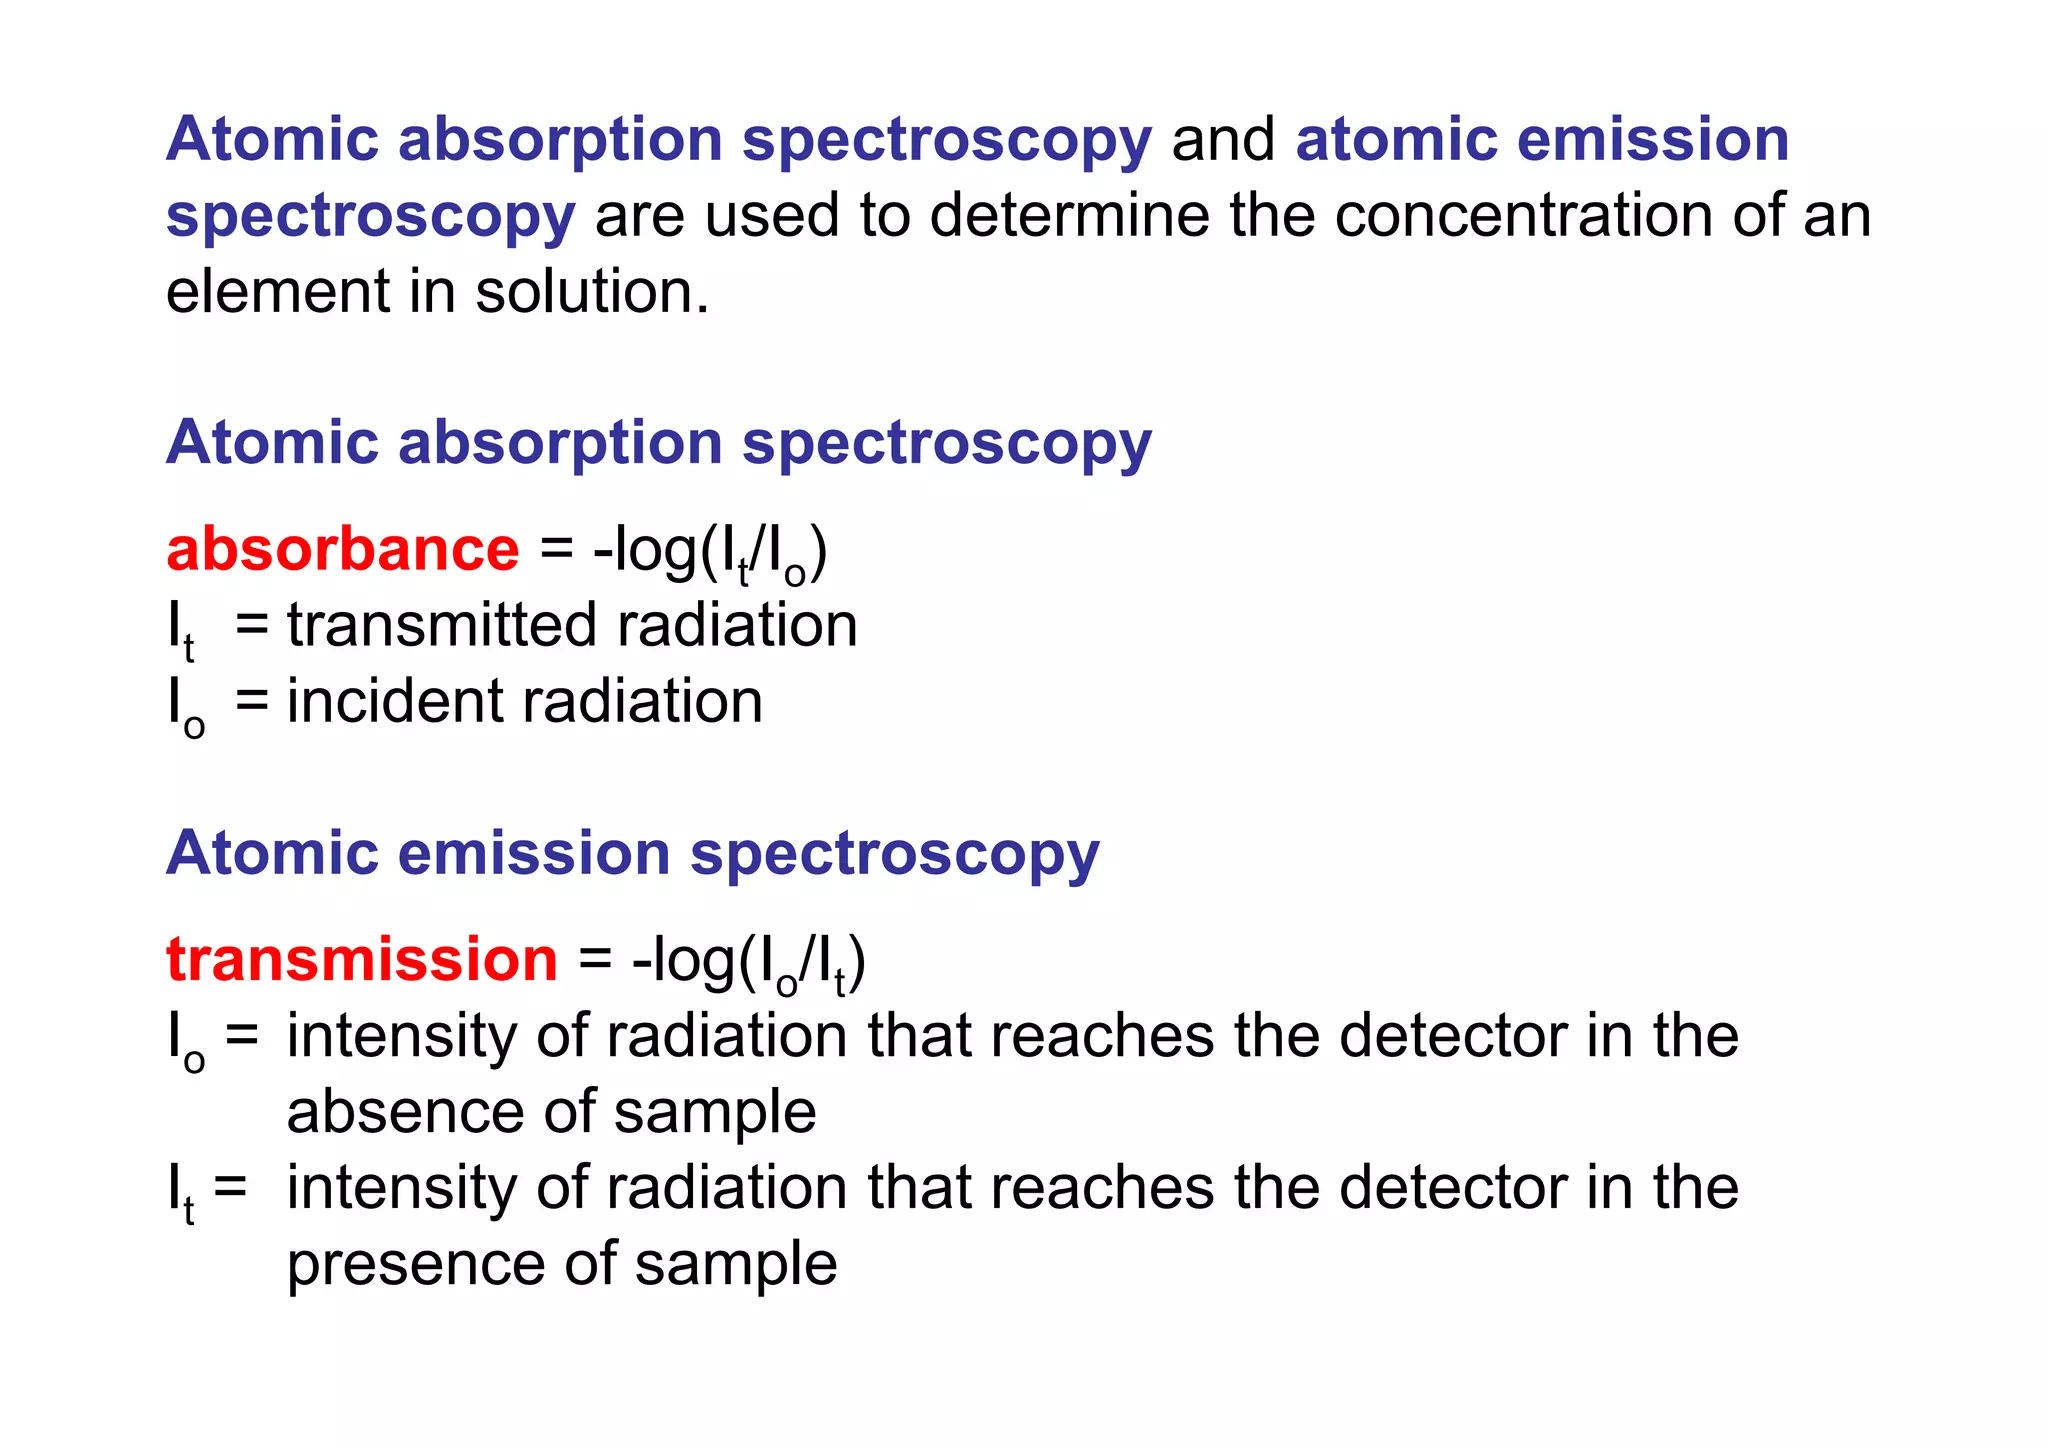


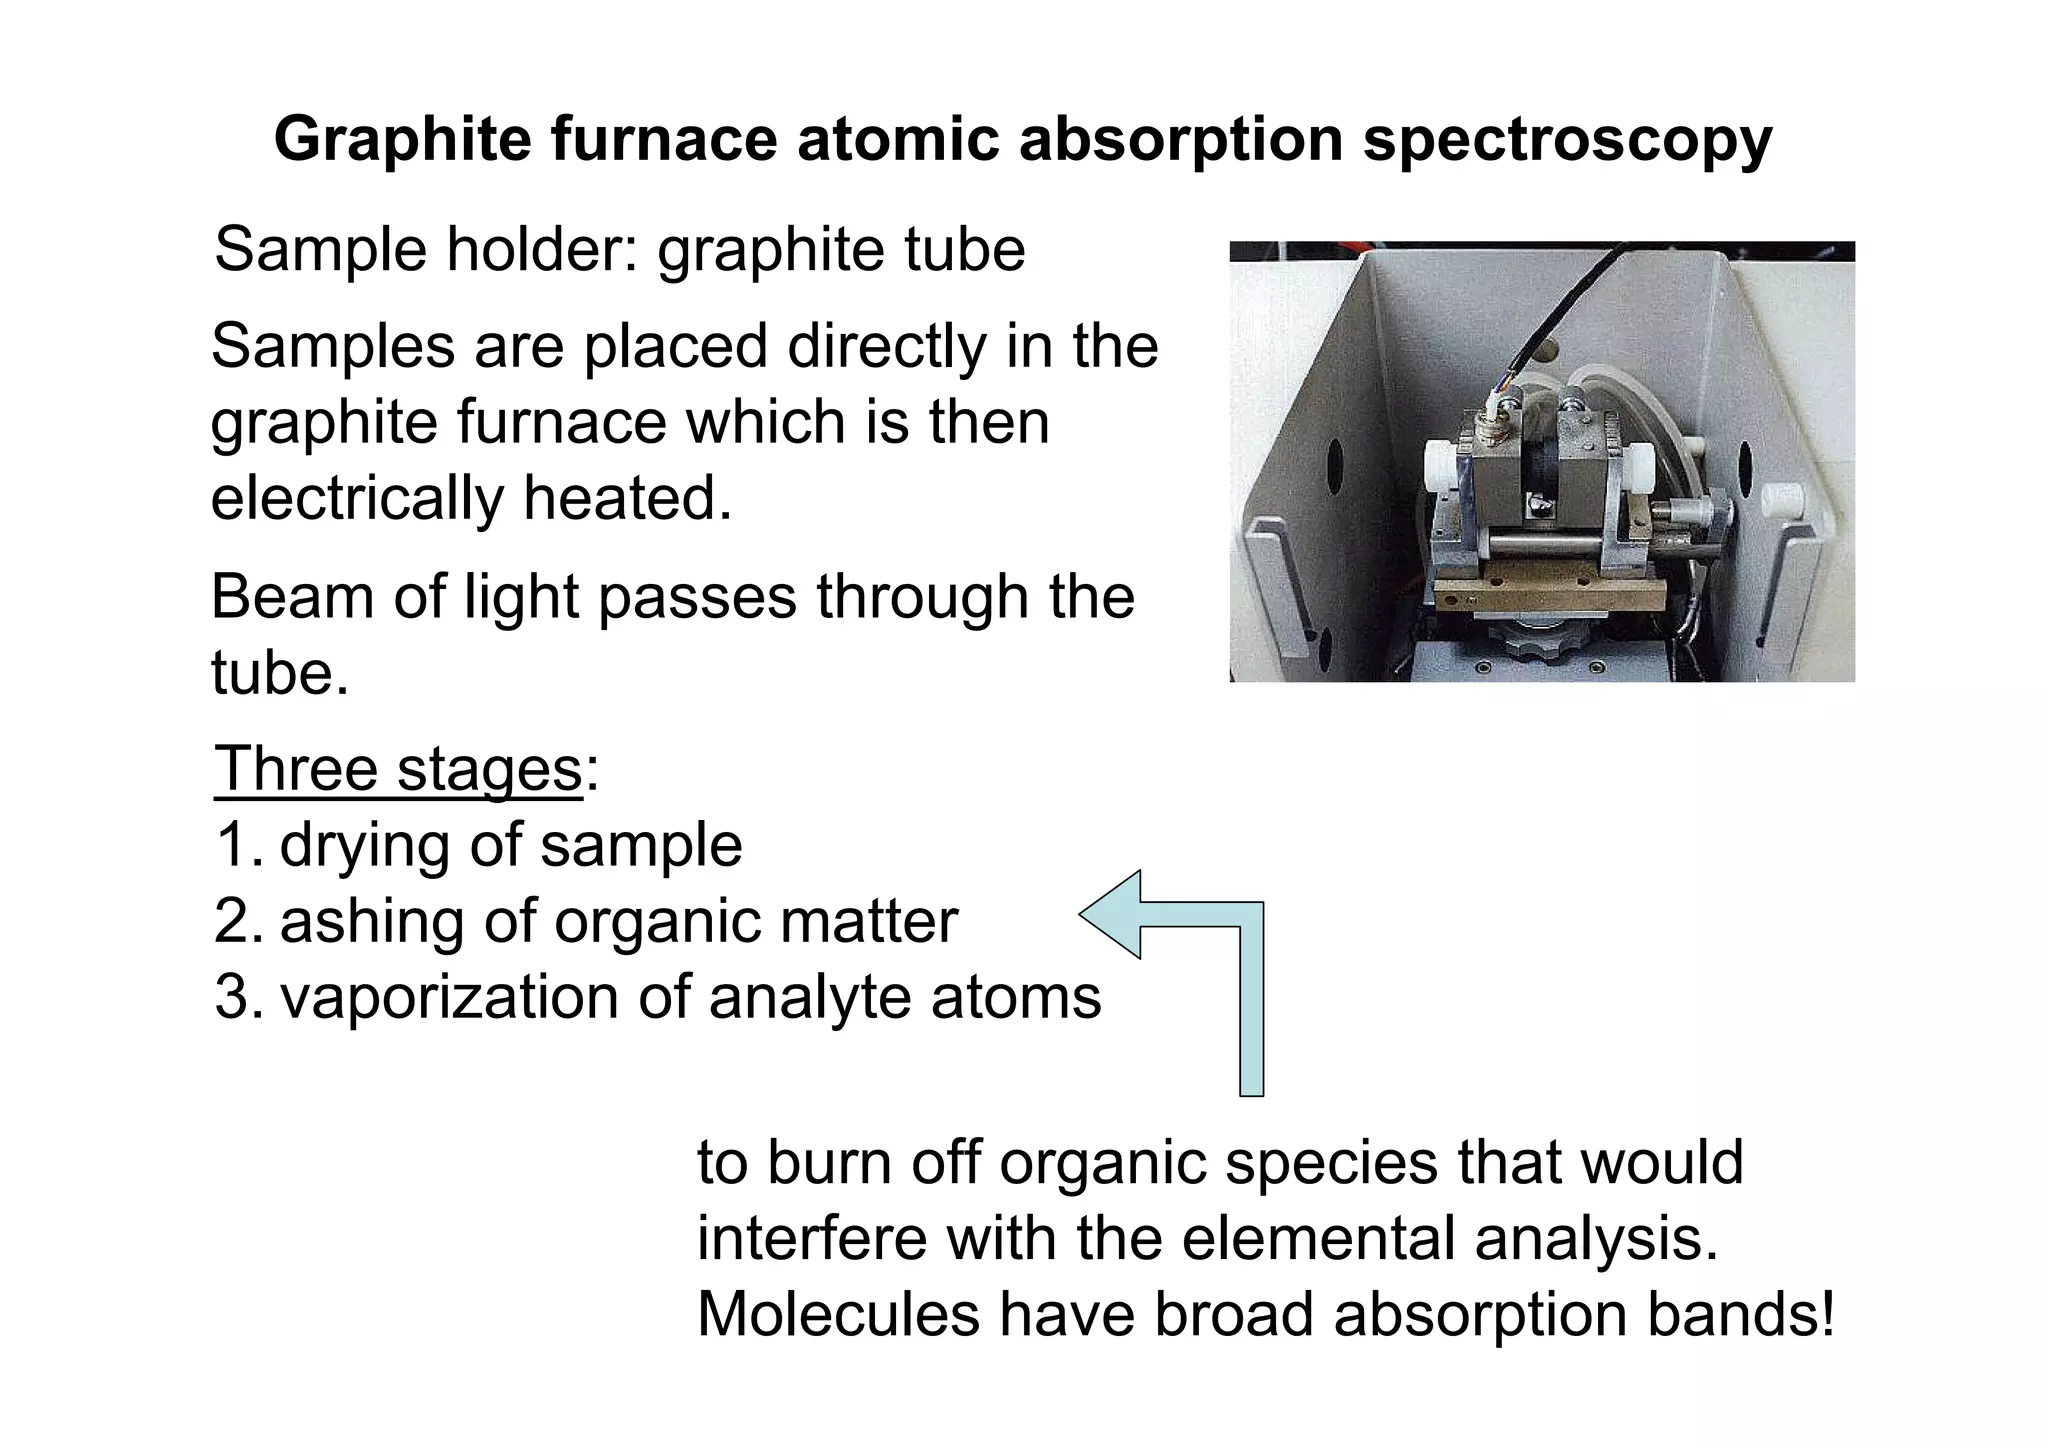

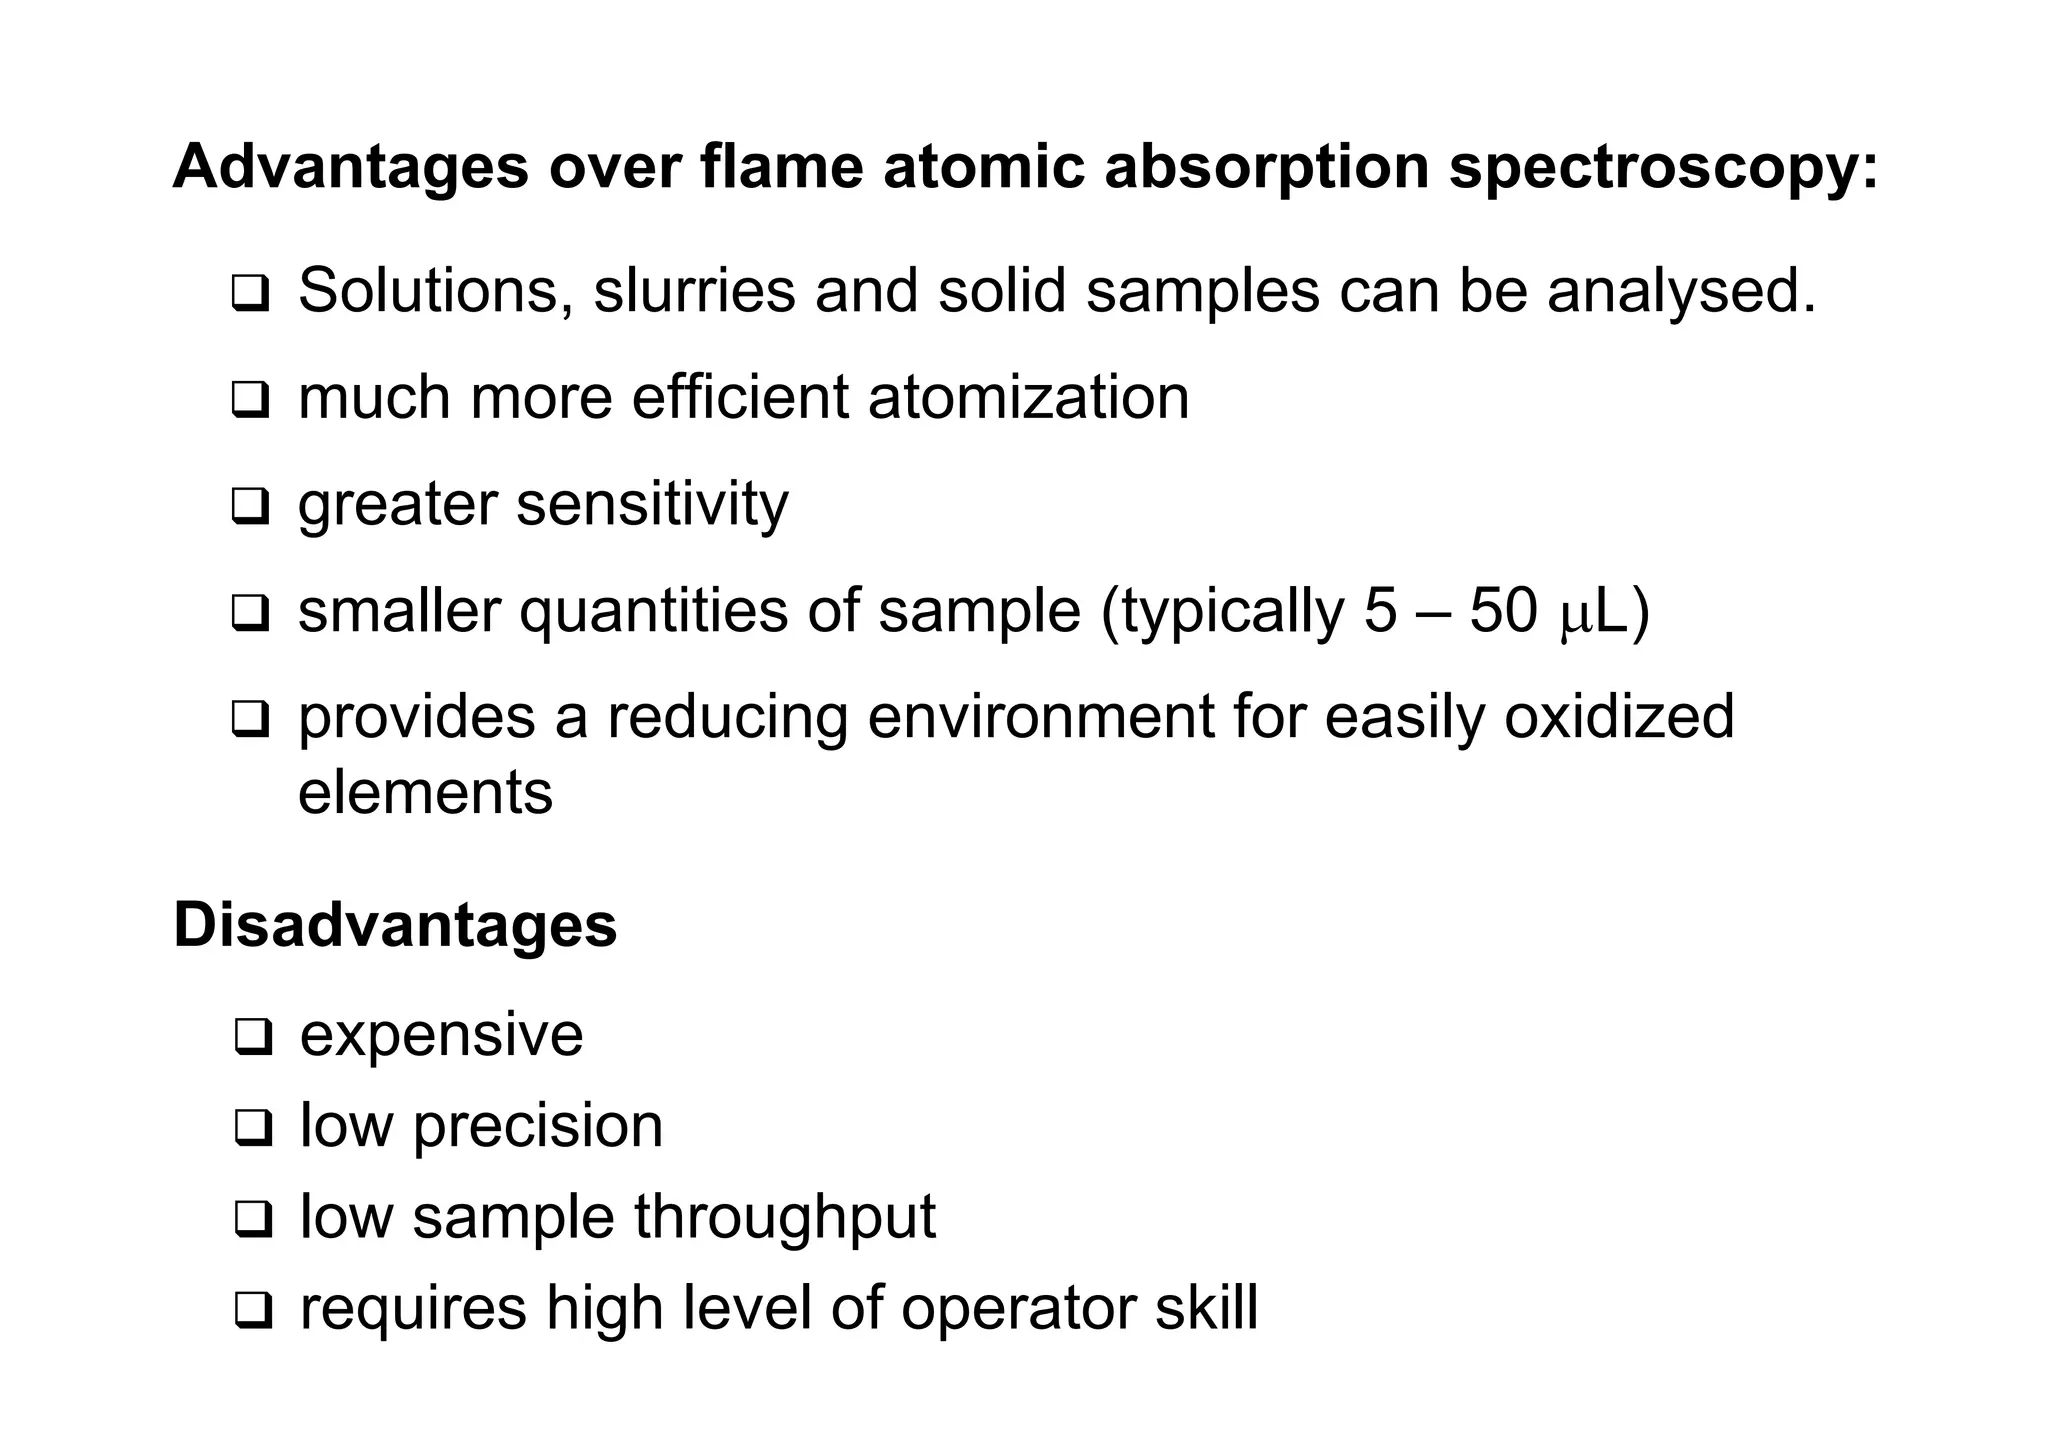


Atomic absorption spectroscopy analyzes elements by heating samples to atomize elements and measuring light absorption. It can analyze water, foods, oils, soils, and blood. Elements are heated until atoms form, which absorb light from hollow cathode lamps at element-specific wavelengths. Flames or graphite furnaces are used to heat samples. Graphite furnace atomic absorption allows smaller sample sizes and higher sensitivity than flame atomic absorption. Interferences can occur but can be corrected. Atomic absorption spectroscopy can detect elements at the parts-per-million and parts-per-billion levels.


![FOURIER -TRANSFORM INFRARED SPECTROMETER [FTIR]](https://cdn.slidesharecdn.com/ss_thumbnails/ftir-160604063055-thumbnail.jpg?width=640&height=640&fit=bounds)


