Tech Startup Growth Hacking 101 - Basics on Growth Marketing
Asian Paints Delivers Strong 16% Revenue Growth
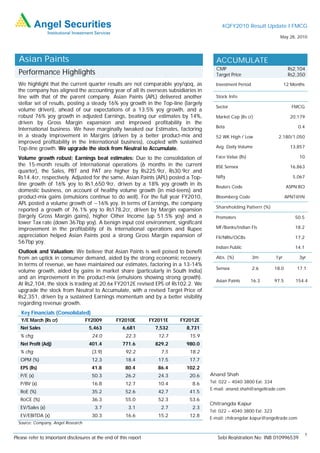
1. 4QFY2010 Result Update I FMCG
May 28, 2010
Asian Paints ACCUMULATE
CMP Rs2,104
Performance Highlights Target Price Rs2,350
We highlight that the current quarter results are not comparable yoy/qoq, as Investment Period 12 Months
the company has aligned the accounting year of all its overseas subsidiaries in
line with that of the parent company. Asian Paints (APL) delivered another Stock Info
stellar set of results, posting a steady 16% yoy growth in the Top-line (largely
Sector FMCG
volume driven), ahead of our expectations of a 13.5% yoy growth, and a
robust 76% yoy growth in adjusted Earnings, beating our estimates by 14%, Market Cap (Rs cr) 20,179
driven by Gross Margin expansion and improved profitability in the
Beta 0.4
International business. We have marginally tweaked our Estimates, factoring
in a steady improvement in Margins (driven by a better product-mix and 52 WK High / Low 2,180/1,050
improved profitability in the International business), coupled with sustained
Top-line growth. We upgrade the stock from Neutral to Accumulate. Avg. Daily Volume 13,857
Volume growth robust; Earnings beat estimates: Due to the consolidation of Face Value (Rs) 10
the 15-month results of International operations (6 months in the current BSE Sensex 16,863
quarter), the Sales, PBT and PAT are higher by Rs225.9cr, Rs30.9cr and
Rs14.4cr, respectively. Adjusted for the same, Asian Paints (APL) posted a Top- Nifty 5,067
line growth of 16% yoy to Rs1,650.9cr, driven by a 18% yoy growth in its
Reuters Code ASPN.BO
domestic business, on account of healthy volume growth (in mid-teens) and
product-mix gains (emulsions continue to do well). For the full year FY2010, Bloomberg Code APNT@IN
APL posted a volume growth of ~16% yoy. In terms of Earnings, the company
Shareholding Pattern (%)
reported a growth of 76.1% yoy to Rs178.2cr, driven by Margin expansion
(largely Gross Margin gains), higher Other Income (up 51.5% yoy) and a Promoters 50.5
lower Tax rate (down 367bp yoy). A benign input cost environment, significant
improvement in the profitability of its International operations and Rupee MF/Banks/Indian FIs 18.2
appreciation helped Asian Paints post a strong Gross Margin expansion of FII/NRIs/OCBs 17.2
567bp yoy.
Indian Public 14.1
Outlook and Valuation: We believe that Asian Paints is well poised to benefit
from an uptick in consumer demand, aided by the strong economic recovery. Abs. (%) 3m 1yr 3yr
In terms of revenue, we have maintained our estimates, factoring in a 13-14%
Sensex 2.6 18.0 17.1
volume growth, aided by gains in market share (particularly in South India)
and an improvement in the product-mix (emulsions showing strong growth).
Asian Paints 16.3 97.5 154.4
At Rs2,104, the stock is trading at 20.6x FY2012E revised EPS of Rs102.2. We
upgrade the stock from Neutral to Accumulate, with a revised Target Price of
Rs2,351, driven by a sustained Earnings momentum and by a better visibility
regarding revenue growth.
Key Financials (Consolidated)
Y/E March (Rs cr) FY2009 FY2010E FY2011E FY2012E
Net Sales 5,463 6,681 7,532 8,731
% chg 24.0 22.3 12.7 15.9
Net Profit (Adj) 401.4 771.6 829.2 980.0
% chg (3.9) 92.2 7.5 18.2
OPM (%) 12.3 18.4 17.5 17.7
EPS (Rs) 41.8 80.4 86.4 102.2
P/E (x) 50.3 26.2 24.3 20.6 Anand Shah
P/BV (x) 16.8 12.7 10.4 8.6 Tel: 022 – 4040 3800 Ext: 334
E-mail: anand.shah@angeltrade.com
RoE (%) 35.2 52.6 42.7 41.5
RoCE (%) 36.3 55.0 52.3 53.6
Chitrangda Kapur
EV/Sales (x) 3.7 3.1 2.7 2.3
Tel: 022 – 4040 3800 Ext: 323
EV/EBITDA (x) 30.3 16.6 15.2 12.8
E-mail: chitrangdar.kapur@angeltrade.com
Source: Company, Angel Research
1
Please refer to important disclosures at the end of this report Sebi Registration No: INB 010996539
2. Asian Paints I 4QFY2010 Result Update
Exhibit 1: Financial Performance Update (Consolidated)
Y/E March (Rs cr) 4QFY10 4QFY09 % chg FY2010 FY2009 % chg
Net Sales 1,876.8 1,422.6 31.9 6,680.9 5,463.9 22.3
Consumption of RM 1,046.4 873.9 19.7 3,758.0 3,370.6 11.5
(% of Sales) 55.8 61.4 56.2 61.7
Staff Cost 136.5 100.0 36.4 436.3 371.5 17.4
(% of Sales) 7.3 7.0 6.5 6.8
Other Expenses 383.1 272.0 40.8 1,259.1 1,051.7 19.7
(% of Sales) 20.4 19.1 18.8 19.2
Total Expenditure 1,565.9 1,245.9 25.7 5,453.3 4,793.8 13.8
Operating Profit 310.9 176.7 75.9 1,227.6 670.1 83.2
OPM (%) 16.6 12.4 18.4 12.3
Interest 6.9 7.5 (7.1) 28.5 26.3 8.2
Depreciation 24.1 20.1 20.0 83.6 74.4 12.3
Other Income 20.8 13.7 51.5 140.5 51.0 175.4
Associated Profit/Loss - - - -
PBT (excl Ext) 300.6 162.9 84.6 1,256.1 620.4 102.5
(% of Sales) 16.0 11.4 18.8 11.4
Prov. for Taxation 86.8 53.0 63.8 373.1 197.4 89.0
(% of PBT) 28.9 32.5 29.7 31.8
Minority Interest 22.1 7.3 48.3 21.6
Recurring PAT (After MI) 191.7 102.6 86.8 834.7 401.4 108.0
Ext Income/(Expense) (0.9) 1.2 (1.2) 1.2
Prior Period Items 0.1 0.2 (0.2) (2.3)
Reported PAT 192.6 101.1 90.4 835.7 397.9 110.0
PATM (%) 10.3 7.1 12.5 7.3
Equity Shares (cr) 9.6 9.6 9.6 9.6
Adjusted EPS (Rs) 20.1 10.5 90.4 87.1 41.5 110.0
Source: Company, Angel Research
We highlight that the current quarter results are not comparable yoy/qoq, as the
company has aligned the accounting year of all its overseas subsidiaries in line with
that of the parent company, which includes the 15-month results (Jan 09 – Mar 10)
for the full year FY2010, and 6 Months (Oct 09 – Mar 10) for the current quarter
4QFY2010. Hence, Sales, PBT and PAT are higher by Rs225.9cr, Rs30.9cr and
Rs14.4cr, respectively.
Robust volume growth in mid-teens drives the Top-line
Asian Paints (APL) reported a growth of 31.9% yoy in its consolidated Top-line to
Rs1,876.8cr (Rs1,422.6cr). However, adjusted for the additional 3 months
consolidation of the international business, the Top-line growth stood at 16% yoy to
Rs1,650.9cr, marginally ahead of our expectations of a 13.5% yoy growth to
Rs1,617cr, driven by a 18% yoy growth in the domestic business on account of
healthy volume growth (in mid-teens) and product-mix gains (interior and external
emulsions continue to do well). We estimate the Top-line growth to be largely
volume driven (in the range of 13-15%), as the company undertook price cuts in
2HFY2009 and 1HFY2010 to boost volumes. For the full year FY2010, APL posted a
volume growth of ~16% yoy.
May 28, 2010 2
3. Asian Paints I 4QFY2010 Result Update
Higher Gross Margin and profitability in International business boosts Earnings
In terms of Earnings, the company reported a growth of 86.8% yoy to Rs191.7cr
(Rs102.6cr), on a recurring basis, driven by Margin expansion (largely Gross Margin
gains), higher Other Income (up 51.5% yoy) and a lower Tax rate (down 367bp
yoy). However, adjusted for the additional 3 months consolidation of the
international business, the Earnings growth stood at 76.1% yoy to Rs178.2cr
(101.1cr), on a reported basis, ahead of our expectations of a 55% yoy growth to
Rs156cr.
A benign input cost environment, a significant improvement in the profitability of the
International operations and Rupee appreciation helped Asian Paints post a strong
Gross Margin expansion of 567bp. Moreover, Gross Margin expanded by 58bp
qoq, despite a jump in the cost index, owing to a superior product-mix (higher
contribution from emulsions), which comes as a positive surprise. However, Other
expenses increased by 129bp yoy, due to higher marketing spends on brand
building activities.
Key Takeaways from Analyst Meet
Strong volume growth: Domestic Paints volume registered a growth of 16.4%
yoy.
Input costs benign, but have started hardening: The Material price Index for full
year FY2009-10 stood at 92.44, with FY2009 as the base, indicating benign
input costs for the year. For 4QFY2010, it stood at 94.37 (92.37 in 3QFY2010),
indicating that input costs are witnessing an uptrend, particularly in Monomers,
Rutile and some oils.
Price hikes of 4.1% from May 2010: APL has already initiated a price hike of
4.15% in its decorative products portfolio from May 2010 in order to safeguard
its margins from excise rollback and inflation in input costs.
FY2010 Margins not sustainable: The Management has clearly re-iterated that
FY2010 Margins are at an all-time high and are not sustainable.
Focus on Retailing initiatives continues: Asian Paints has installed more than
15,000 Colourworlds till date.
APPG posts a better-than-expected performance: Sales of the Automotive JV
(APPG) grew at a strong pace in FY2010, driven by the impressive growth in the
domestic sales of passenger vehicles.
International Operations witness a significant improvement in profitability:
Volume growth in the international business for Jan-Dec 2009 period stood at
6%. Among geographies, Nepal, Bangladesh and Egypt performed well. Profit
Margins for the International business improved significantly, aided by lower
material costs (lower crude prices).
South-East Asia business restructured: During FY2010, APL has divested its
stakes in Malaysia, Thailand and Hong Kong. Moreover, it also divested its
China subsidiary in April 2010, leaving a presence only in Singapore.
Capacity expansion: For FY2010, APL incurred a capex of Rs350cr. The Rohtak
Plant has been commissioned in April 2010, with an initial capacity of
150,000KL and with an outlay of Rs274cr. The Capacity of Sriperumbudur Plant
has been raised to 140,000KL. For FY2011E, the company plans to incur a
capex of Rs250cr. It has acquired land at Kesurdi, Maharashtra for setting up its
next paint plant with an outlay of Rs100cr (to be commissioned by the end of
FY2013E).
May 28, 2010 3
4. Asian Paints I 4QFY2010 Result Update
Outlook and Valuation
After another quarter of strong results, we have marginally tweaked our Earnings
Estimates for FY2011E and FY2012E, factoring in a steady improvement in Margins
(driven by a better product-mix and improved profitability in the International
business), coupled with sustained Top-line growth. In terms of revenue, we maintain
our estimates, factoring in a 13-14% volume growth, driven by an uptick in
consumer sentiment, coupled with gains in market share (particularly in South India)
and an improvement in the product-mix (emulsions showing strong growth).
Exhibit 2: Revision in Estimates
Old Estimate New Estimate % chg
(Rs cr) FY11E FY12E FY11E FY12E FY11E FY12E
Revenue 7,499 8,692 7,532 8,731 0.4 0.4
OPM (%) 17.1 16.7 17.5 17.7 44bp 99bp
EPS 84.3 95.9 86.4 102.2 2.5 6.5
Source: Angel Research
At Rs2,104, the stock is trading at 20.6x FY2012E revised EPS of Rs102.2. We
upgrade the stock from Neutral to Accumulate, with a revised Target Price of
Rs2,351, driven by a sustained Earnings momentum and by a better visibility
regarding revenue growth.
Downside risks to our estimates include: 1) Hardening of input costs, driven by a rise
in crude oil prices, and 2) a sharp fall in the Rupee.
Exhibit 3: 1-year forward P/E Band
2,500 14x 17x 20x 23x
2,000
1,500
Share Price (Rs)
1,000
500
-
Apr-05
Oct-05
Dec-05
Apr-06
Oct-06
Dec-06
Apr-07
Oct-07
Dec-07
Apr-08
Oct-08
Dec-08
Apr-09
Oct-09
Dec-09
Apr-10
Jun-05
Aug-05
Feb-06
Jun-06
Aug-06
Feb-07
Jun-07
Aug-07
Feb-08
Jun-08
Aug-08
Feb-09
Jun-09
Aug-09
Feb-10
Source: Bloomberg, Angel Research
May 28, 2010 4
9. Asian Paints I 4QFY2010 Result Update
Research Team Tel: 4040 3800 E-mail: research@angeltrade.com Website: www.angeltrade.com
DISCLAIMER
This document is solely for the personal information of the recipient, and must not be singularly used as the basis of any investment decision. Nothing in this
document should be construed as investment or financial advice. Each recipient of this document should make such investigations as they deem necessary to
arrive at an independent evaluation of an investment in the securities of the companies referred to in this document (including the merits and risks involved),
and should consult their own advisors to determine the merits and risks of such an investment.
Angel Securities Limited, its affiliates, directors, its proprietary trading and investment businesses may, from time to time, make investment decisions that are
inconsistent with or contradictory to the recommendations expressed herein. The views contained in this document are those of the analyst, and the company
may or may not subscribe to all the views expressed within.
Reports based on technical and derivative analysis center on studying charts of a stock's price movement, outstanding positions and trading volume, as
opposed to focusing on a company's fundamentals and, as such, may not match with a report on a company's fundamentals.
The information in this document has been printed on the basis of publicly available information, internal data and other reliable source believed to be true,
and is for general guidance only. Angel Securities Limited has not independently verified all the information contained within this document. Accordingly, we
cannot testify, nor make any representation or warranty, express or implied, to the accuracy, contents or data contained within this document. While Angel
Securities Limited endeavours to update on a reasonable basis the information discussed in this material, there may be regulatory, compliance, or other
reasons that prevent us from doing so.
This document is being supplied to you solely for your information, and its contents, information or data may not be reproduced, redistributed or passed on,
directly or indirectly.
Angel Securities Limited and its affiliates may seek to provide or have engaged in providing corporate finance, investment banking or other advisory services
in a merger or specific transaction to the companies referred to in this report, as on the date of this report or in the past.
Neither Angel Securities Limited, nor its directors, employees or affiliates shall be liable for any loss or damage that may arise from or in connection with the
use of this information.
Note: Please refer to the important `Stock Holding Disclosure' report on the Angel website (Research Section).
Disclosure of Interest Statement Asian Paints
1. Analyst ownership of the stock No
2. Angel and its Group companies ownership of the stock No
3. Angel and its Group companies’ Directors ownership of the stock No
4. Broking relationship with company covered No
Note: We have not considered any Exposure below Rs 1 lakh for Angel and its Group companies.
Address: Acme Plaza, ‘A’ Wing, 3rd Floor, M.V. Road, Opp. Sangam Cinema, Andheri (E), Mumbai - 400 059.
Tel : (022) 3952 4568 / 4040 3800
Angel Broking Ltd: BSE Sebi Regn No : INB 010996539 / CDSL Regn No: IN - DP - CDSL - 234 - 2004 / PMS Regn Code: PM/INP000001546 Angel Securities Ltd:BSE: INB010994639/INF010994639 NSE:
INB230994635/INF230994635 Membership numbers: BSE 028/NSE:09946
Angel Capital & Debt Market Ltd: INB 231279838 / NSE FNO: INF 231279838 / NSE Member code -12798 Angel Commodities Broking (P) Ltd: MCX Member ID: 12685 / FMC Regn No: MCX / TCM /
CORP / 0037 NCDEX : Member ID 00220 / FMC Regn No: NCDEX / TCM / CORP / 0302
May 28, 2010 9