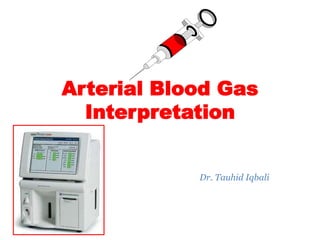


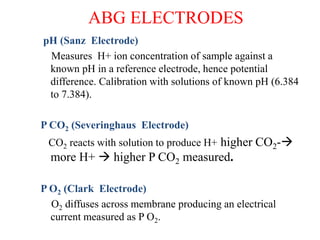

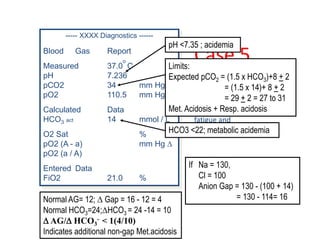
![----- XXXX Diagnostics ------
Blood Gas Report
Measured37.0
o
C
pH 7.463
pCO2 44.4 mm Hg
pO2 113.2 mm Hg
Corrected38.6
o
C
Calculated Data
HCO3 act 31.1 mmol / L
HCO3 std 30.5 mmol / L
BE 6.6 mmol / L
O2 CT 14.7 mL / dl
O2 Sat 98.3 %
t CO2 32.4 mmol / L
pO2 (A - a) 32.2 mm Hg
pO2 (a / A) 0.79
Entered Data
Temp 38.6 oC
ct Hb 10.5 g/dl
FiO2 30.0 %
Bicarbonate is calculated on the basis of the
Henderson equation:
[H
+
] = 24 pCO2 / [HCO3
-
]
Bicarbonate:](https://image.slidesharecdn.com/abgseminar-161019103518/85/Arterial-Blood-Gas-Interpretation-17-320.jpg)


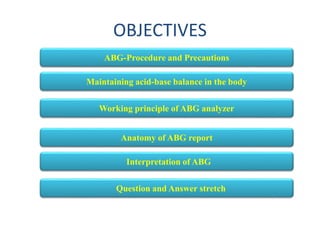
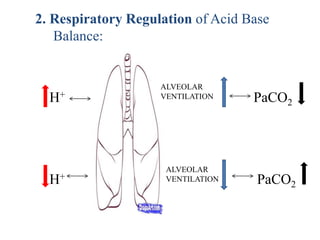
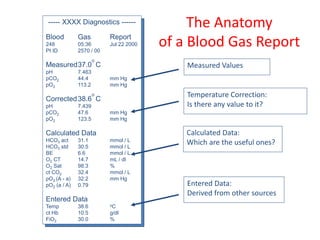
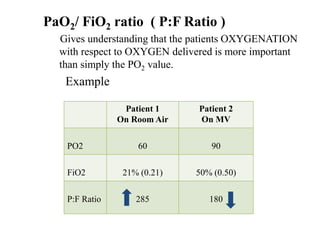
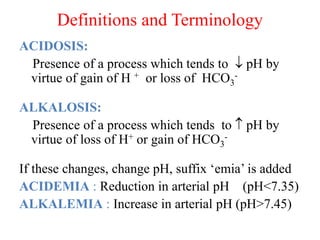
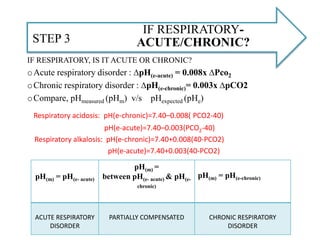
![PaO2 (Partial pressure of arterial oxygen)
PaO2 is dependant upon Age, FiO2, Patm
As Age the expected PaO2
• PaO2 = 109 - [0.4 (Age)]
• Normal PaO2: 75-100 mmHg
As FiO2 the expected PaO2
• Alveolar Gas Equation:
• PAO2= (PB-P h2o) x FiO2- pCO2/R
O
X
Y
G
E
N
A
T
I
O
N
PAO2 = partial pressure of oxygen in alveolar gas, PB = barometric pressure
(760mmHg), Ph2o = water vapor pressure (47 mm Hg), FiO2 = fraction of
inspired oxygen, PCO2 = partial pressure of CO2 in the ABG, R = respiratory
quotient (0.8)](https://image.slidesharecdn.com/abgseminar-161019103518/85/Arterial-Blood-Gas-Interpretation-22-320.jpg)

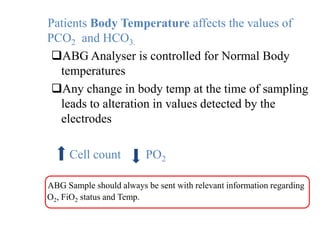
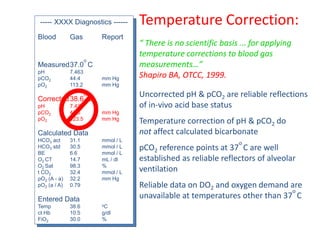
![----- XXXX Diagnostics ------
Blood Gas Report
Measured37.0
o
C
pH 7.463
pCO2 44.4 mm Hg
pO2 113.2 mm Hg
Corrected38.6
o
C
Calculated Data
HCO3 act 31.1 mmol / L
HCO3 std 30.5 mmol / L
BE 6.6 mmol / L
O2 CT 14.7 mL / dl
O2 Sat 98.3 %
t CO2 32.4 mmol / L
pO2 (A - a) 32.2 mm Hg
pO2 (a / A) 0.79
Entered Data
Temp 38.6 oC
ct Hb 10.5 g/dl
FiO2 30.0 %
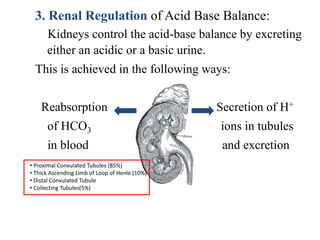
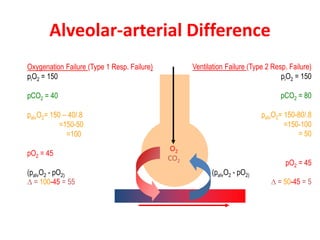
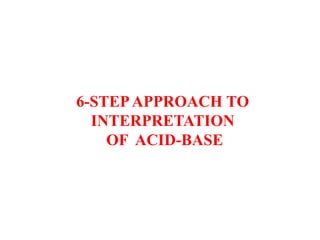
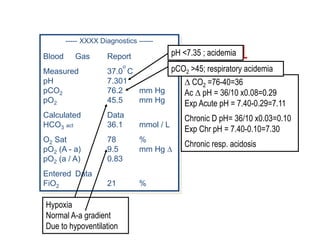
Oxygenation:
O2 Content of blood:
Hb x O2 Sat x 1.34 + Dissolved O2 (given by
Pao2x0.003)
Useful in oxygen transport calculations
Derived from calculated saturation
Oxygen Saturation:
Ideally measured by co-oximetry
Calculated values may be error-prone
Alveolar / arterial gradient:
Hypoxemia causes differentiated by A-a Gradien
Estimate of normal A–a gradient <[age in years/4] + 4
An abnormally increased A–a gradient suggests :
• Defect in diffusion
• V/Q (ventilation/perfusion ratio) mismatch
• right-to-left shunt
Normal A-a Gradient:
• Hypoventilation
Neuromuscular disorders
Central nervous system disorder
• Low inspired FIO2 (e.g. high altitude)
Arterial / alveolar ratio:
Remains stable with change in FIO2
Low a/A (<0.6) = Shunt , V/Q mismatch, diffusion defect](https://image.slidesharecdn.com/abgseminar-161019103518/85/Arterial-Blood-Gas-Interpretation-25-320.jpg)
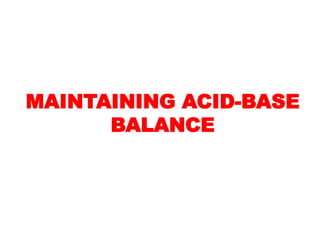
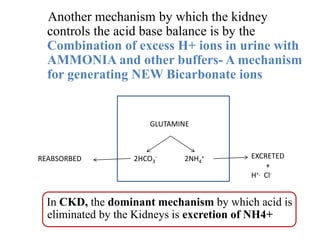
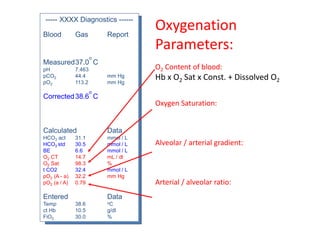
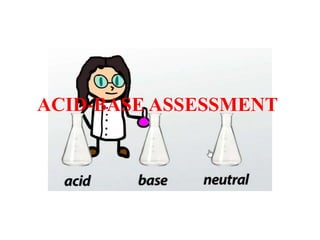
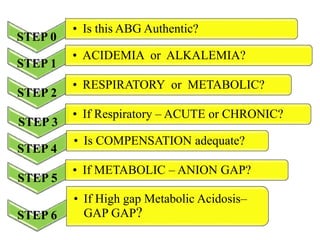
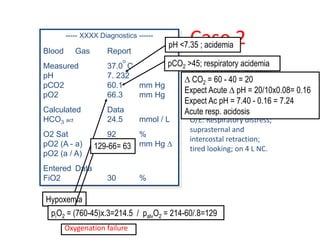
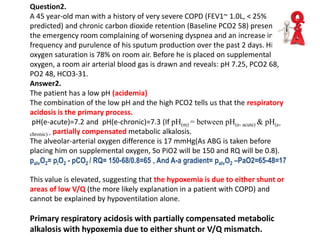
![Alveolar-arterial Difference
Inspired O2 = 21%= piO2 = (760-45) x .21=150 mmHg ( So at room air PiO2=150 mmHg)
O2
CO2
palvO2 = piO2 - pCO2 / RQ
= 150 - 40/0.8
= 150 – 50 = 100 mm Hg( Calculated)
partO2 = 90 mmHg (Measured)
(palvO2- partO2 )D = 10 mmHg (Normal= =<[age in years/4] + 4)](https://image.slidesharecdn.com/abgseminar-161019103518/85/Arterial-Blood-Gas-Interpretation-26-320.jpg)

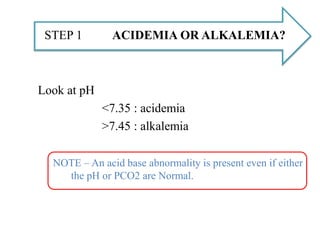
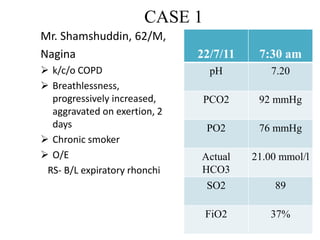
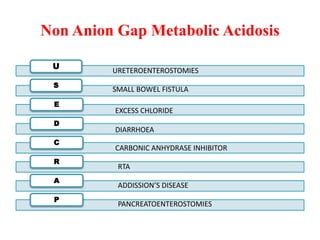
![If the pH and the [H+] are inconsistent, the ABG is probably not valid.
[H+] = 24(PaCO2)
[HCO3-]
H+ ion (mmol/L) pH
100 7.00
79 7.10
63 7.20
50 7.30
45 7.35
40 7.40
35 7.45
32 7.50
25 7.60
STEP0: Is this ABG Authentic?](https://image.slidesharecdn.com/abgseminar-161019103518/85/Arterial-Blood-Gas-Interpretation-33-320.jpg)

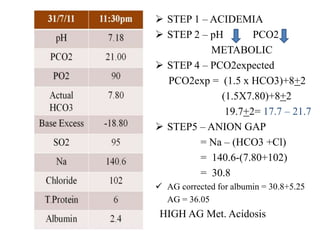
![ADEQUATE COMPENSATION?STEP 4
IS THE COMPENSATORY RESPONSE ADEQUATE OR NOT?
METABOLIC DISORDER PCO2 expected
Metabolic acidosis: PaCO2(e)= (1.5 x [HCO3-]) +8± 2
Metabolic alkalosis:PaCO2(e)= (0.7 x [HCO3-])+ 21 + 2
PCO2measured ≠ PCO2expected MIXED DISORDER
RESPIRATORY DISORDER pHexpected (acute-chronic)
pHm ≠ pHe range MIXED DISORDER](https://image.slidesharecdn.com/abgseminar-161019103518/85/Arterial-Blood-Gas-Interpretation-39-320.jpg)


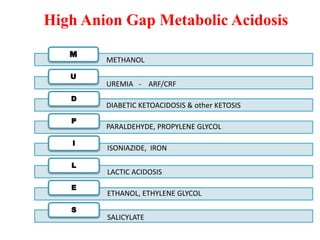
![CO EXISTANT METABOLIC
DISORDER – “Gap Gap”?
STEP 6
If an increased anion gap is present:
Assess the ratio of the change in the anion gap (∆AG ) to the
change in [HCO3-] (∆[HCO3-]): ∆AG/∆[HCO3-]
∆ Anion Gap = Measured AG – Normal AG
Measured AG – 12
∆ HCO3 = Normal HCO3 – Measured HCO3
24 – Measured HCO3
Ideally, ∆Anion Gap = ∆HCO3
For each 1 meq/L increase in AG, HCO3 will fall by 1 meq/L
∆AG/D HCO3
- = 1 Pure High AG Met Acidosis
D AG/D HCO3
- > 1 Assoc Metabolic Alkalosis
D AG/D HCO3
- < 1 Assoc Non AG Met Acidosis](https://image.slidesharecdn.com/abgseminar-161019103518/85/Arterial-Blood-Gas-Interpretation-48-320.jpg)

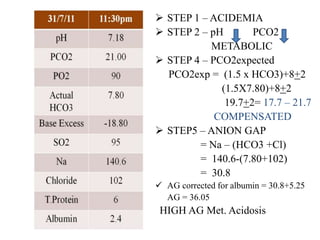
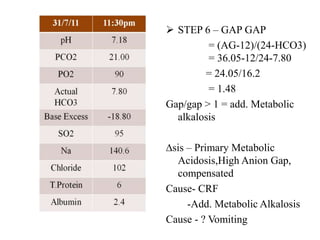

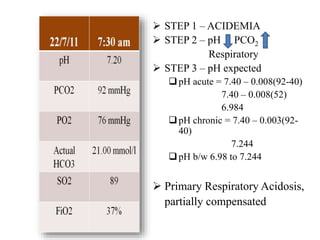
![Question1.
A 45 year-old woman with a history of inhalant abuse presents to the
emergency room complaining of dyspnea. She has an SpO2 of 99% on room air
and is obviously tachypneic on exam with what appears to be Kussmaul’s
respirations. A room air arterial blood gas is performed and reveals: pH 6.95,
PCO2 9, PO2 128, HC3- 2. A chemistry panel revealed sodium of 130, chloride 98,
HCO3- 2.
Answer1.
The patient has a very low pH (acidemia)
The low pH in conjunction with the low bicarbonate tells us that the metabolic
acidosis is the primary process
The anion gap is elevated at 30[130-(98+2)]. This tells us that the patient has a
primary elevated anion gap metabolic acidosis.
Compensated as PaCO2 (e)=9-13(1.5x2+8+-2)
delta AG is 30-12 = 18
Delta AG/D HCO3
- < 1( 18/22) ,So there is an additional non-gap metabolic
acidosis as well.
Combined elevated anion gap and non-gap metabolic acidoses with
compensatory respiratory alkalosis.](https://image.slidesharecdn.com/abgseminar-161019103518/85/Arterial-Blood-Gas-Interpretation-54-320.jpg)


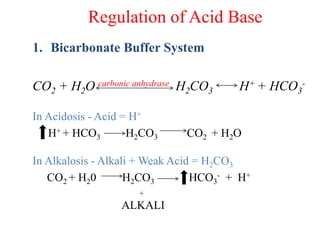
This document provides information about arterial blood gas (ABG) interpretation. It discusses the procedure and precautions for ABG sampling, how the body maintains acid-base balance through bicarbonate buffering and respiratory and renal regulation. It explains the anatomy of an ABG report, including measured, calculated and entered values. Key areas of interpretation are oxygenation parameters like PaO2, A-a gradient and oxygen saturation, as well as acid-base status through pH, PCO2 and bicarbonate levels. The document provides examples of interpreting ABG results to assess for respiratory and metabolic acid-base disorders.


