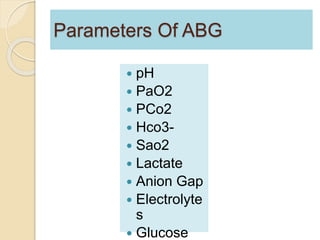
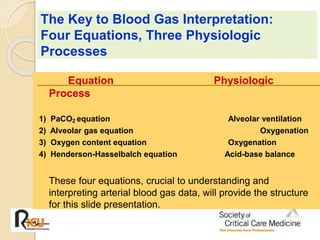
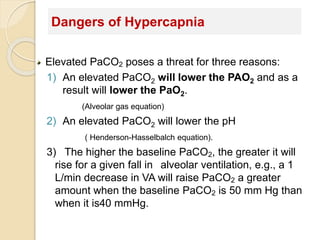
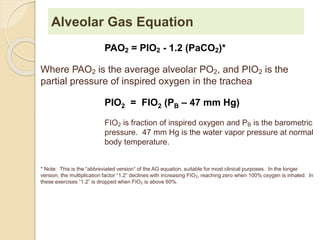
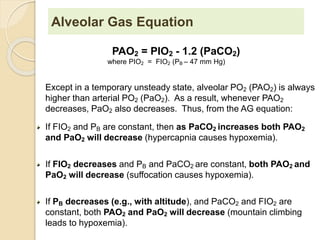
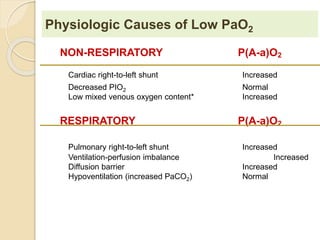
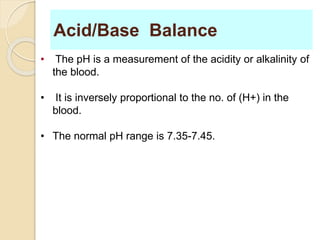
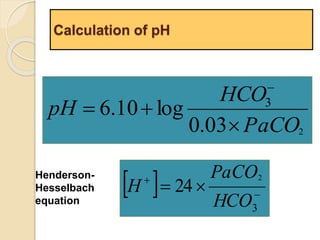
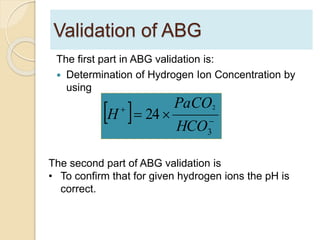
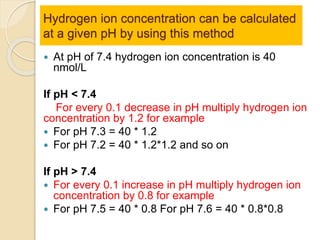
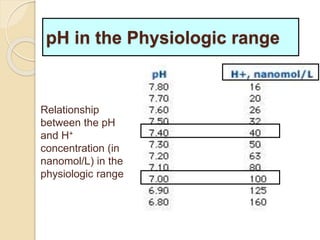
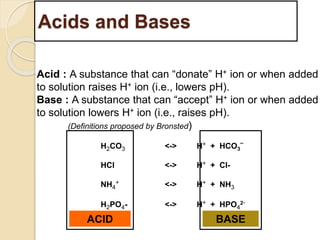
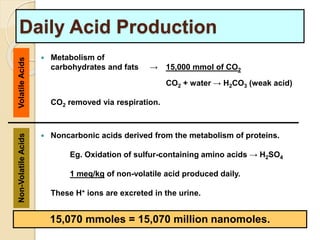
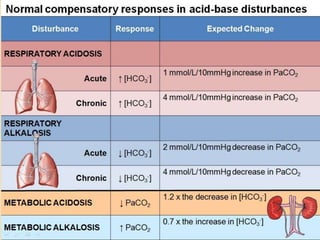
The document summarizes a seminar on arterial blood gases (ABG). Dr. Sravan presented on techniques for blood extraction and parameters analyzed in ABG tests. Key equations relate the partial pressures of oxygen and carbon dioxide to alveolar ventilation and oxygenation processes. Interpreting ABG results involves considering acid-base balance, hypoxemia causes, and the body's normal buffering systems to maintain pH levels. Precise blood drawing and handling is important for accurate ABG analysis.

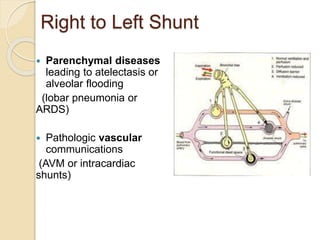

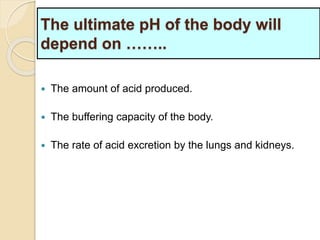
![Terminology
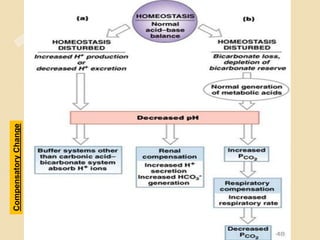
Acidemia is present when blood pH <7.35.
Alkalemia is present when blood pH >7.45.
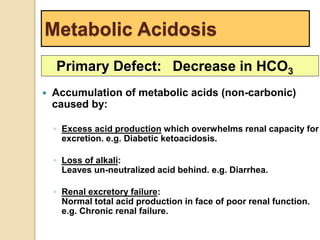
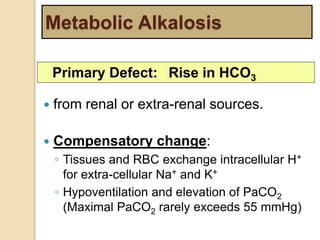
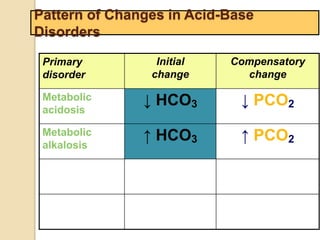
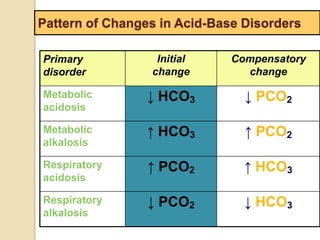
Metabolic
refers to disorders that result from a primary
alteration in [H+] or [HCO-].
3
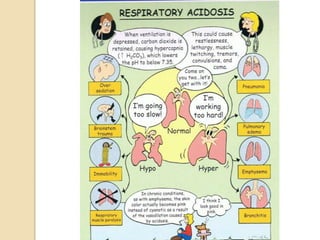
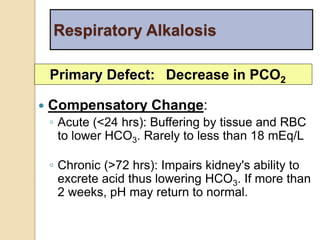
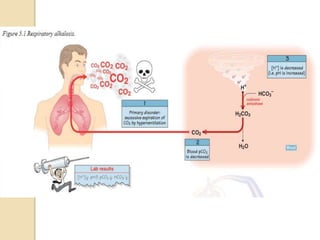
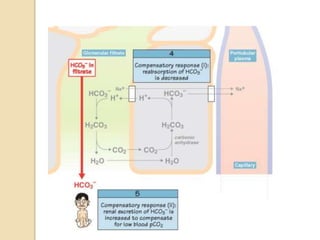
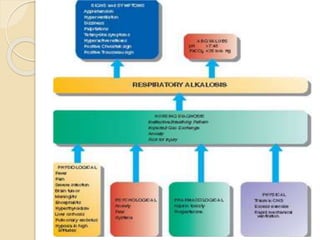
Respiratory
refers to disorders that result from a primary
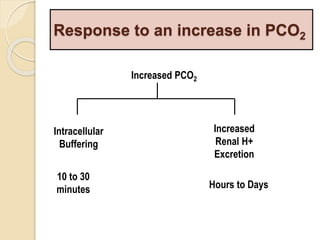
alteration in PCO2 due to altered CO2 elimination.](https://image.slidesharecdn.com/sravanabgpptmodified-141024034056-conversion-gate02/85/Sravan-abg-ppt-modified-29-320.jpg)
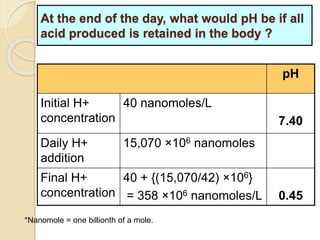
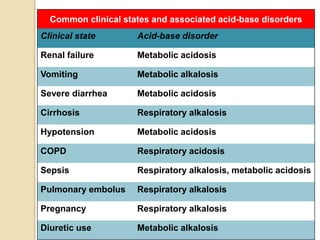
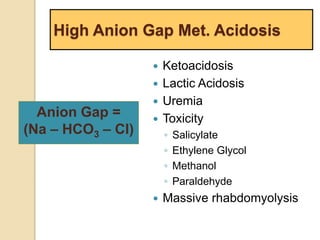
![Causes of Metabolic Acidosis
Acid Gain
1. L-lactic acid (= tissue hypoxia)
2. Ketoacids (= DKA, starvation)
3. D-lactic acid (= Low GI motility or altered GI
flora, eg. blind loop syndromes)
4. Intoxicants which are acids or become acids
Methanol to formic acid
Ethylene glycol to glyoxalic acid
Paraldehyde to acetic acid
Acetylsalicylic acid
Toluene to hippuric acid
5. Renal Failure
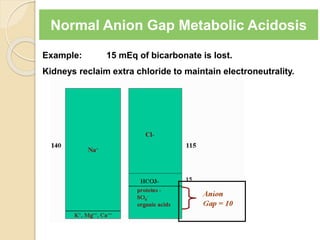
Anion Gap =
Na – [Cl + HCO3]](https://image.slidesharecdn.com/sravanabgpptmodified-141024034056-conversion-gate02/85/Sravan-abg-ppt-modified-46-320.jpg)
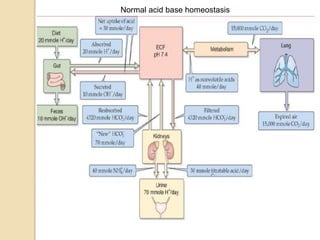
![Causes of Metabolic Acidosis
Loss of NaHCO3
1. Loss via GI tract (diarrhea, ileus, fistula)
2. Loss in Urine (proximal RTA, acetazolamide)
3. Failure of kidneys to make new bicarbonate
(distal RTA)
4. Acid production and the excretion of its anion in
the urine without [H+] or [NH4
+] (Eg. Defective
renal reabsorption of betahydroxybutarate)](https://image.slidesharecdn.com/sravanabgpptmodified-141024034056-conversion-gate02/85/Sravan-abg-ppt-modified-48-320.jpg)
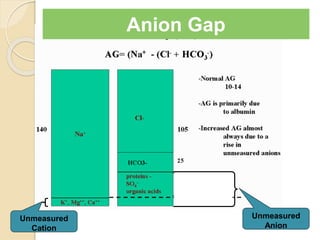
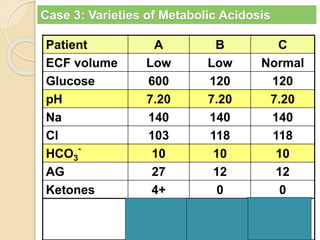
![Anion Gap
AG = [Na – (Cl + HCO3)]
Increased unmeasured cation:
◦ Normally present cations
K+, Ca2+ , Mg2+
◦ Abnormal cations:
Lithium, IgG
Decreased unmeasured anion:
◦ Hypoalbuminemia
Lab Error:
◦ Hyponatremia due to viscous
serum
◦ Hyperchloremia in Bromide toxicity
◦ Random lab errors
Decreased unmeasured cation:
◦ Decreased K, Ca, Mg
Increased unmeasured anion:
◦ Organic:lactate, ketones
◦ Inorganic: PO42-, sulfates
◦ Hyperalbuminemia
◦ Exogenous anions: salicylates,
formate, penicillin, nitrate, etc.
◦ Incompletely idenitified: uremia,
paraldehyde, ehtylene glycol, HHS,
etc
Lab Error:
◦ Falsely increased Na
◦ Falsely decreased Cl or HCO3](https://image.slidesharecdn.com/sravanabgpptmodified-141024034056-conversion-gate02/85/Sravan-abg-ppt-modified-55-320.jpg)
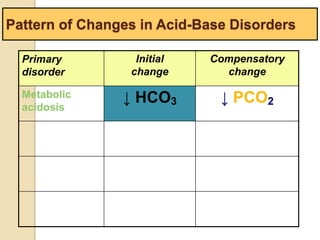

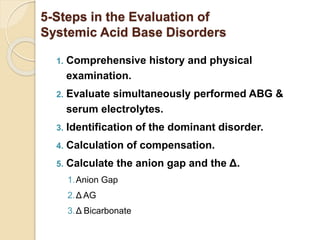
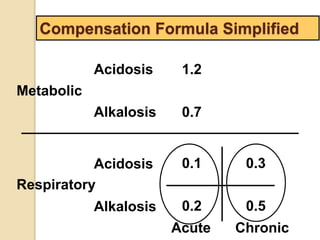
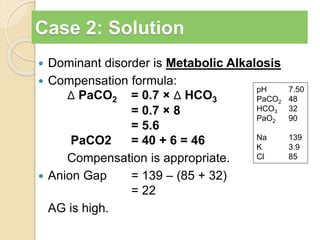
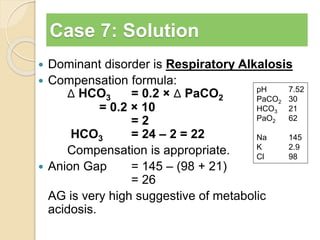
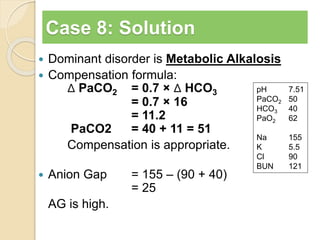
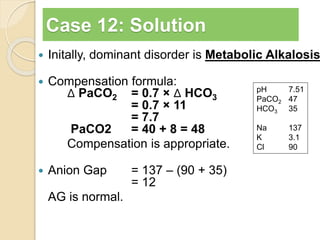
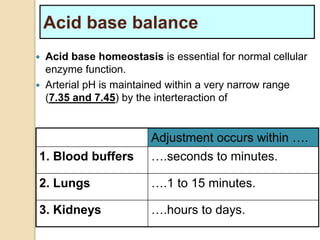
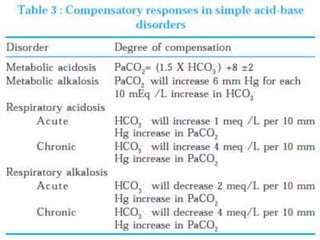
![Step 4:
Calculation of compensation
Disorder pH Primary
change
Compensatory
Response
Equation
Metabolic
Acidosis
-] PCO2 ΔPCO2 1.2 ΔHCO3
[HCO3
Metabolic
Alkalosis
-] PCO2 ΔPCO2 0.7 ΔHCO3
[HCO3
Respiratory
Acidosis
-] Acute:
PCO2 [HCO3
- 0.1 ΔPCO2
Chronic:
ΔHCO3
- 0.3 ΔPCO2
ΔHCO3
Respiratory
Alkalosis
-] Acute:
PCO2 [HCO3
- 0.2 ΔPCO2
Chronic:
ΔHCO3
- 0.5 ΔPCO2
ΔHCO3
Note: The formula calculates the change in the compensatory parameter.](https://image.slidesharecdn.com/sravanabgpptmodified-141024034056-conversion-gate02/85/Sravan-abg-ppt-modified-94-320.jpg)
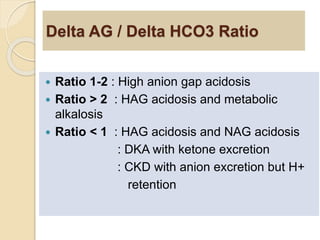
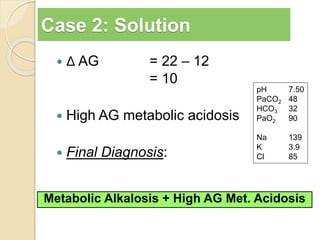
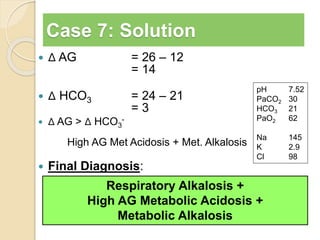
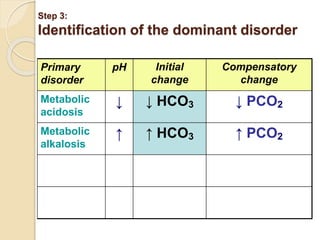
![Step 5: Calculate the “gaps”
Anion gap = Na+ − [Cl− + HCO3
−]
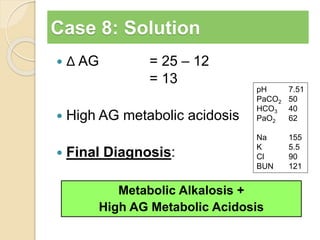
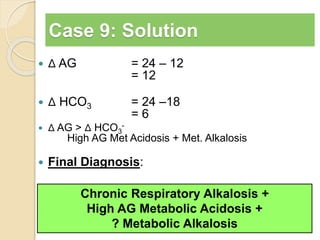
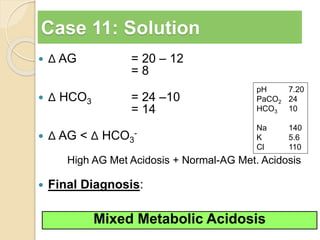
Δ AG = Anion gap − 12
Δ HCO3 = 24 − HCO3
Δ AG = Δ HCO3
−, then Pure high AG Met. Acidosis
Δ AG > Δ HCO3
−, then High AG Met Acidosis + Met. Alkalosis
Δ AG < Δ HCO3
−, then High AG Met Acidosis + HCMA
Note:
Add Δ AG to measured HCO3
− to obtain
bicarbonate level that would have existed IF the
high AG metabolic acidosis were to be absent,
i.e., “Pre-existing Bicarbonate.”
e existing Bicarb
Delta AG
Current Bicarb
Pr _ _
_
_
](https://image.slidesharecdn.com/sravanabgpptmodified-141024034056-conversion-gate02/85/Sravan-abg-ppt-modified-97-320.jpg)