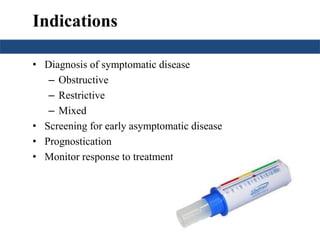
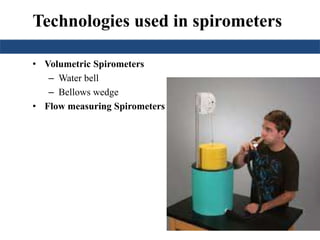
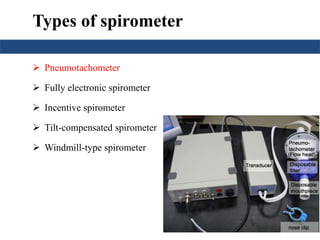
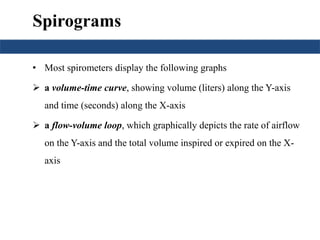
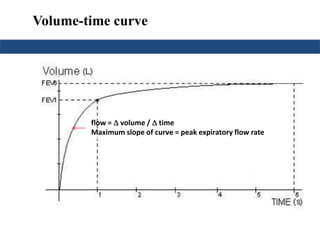
Downloaded 127 times

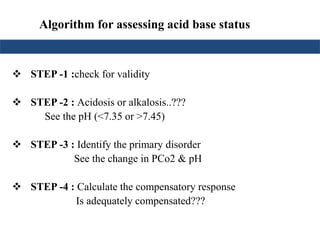
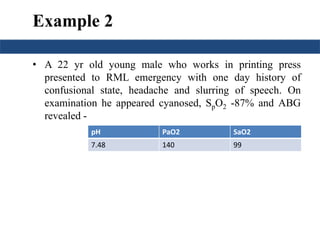
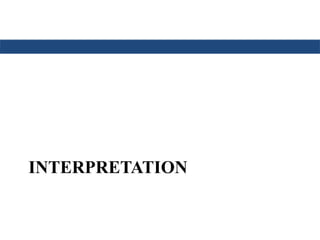
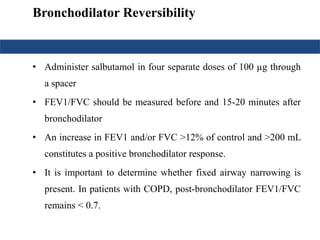
![Step 1:Assessment of validity of test
results
• Assess the internal consistency of the values using the Henderseon-
Hasselbach equation
• If there is a discripancy between the 2 results, the blood should be
reanalyzed.
• HCO3 should be within 1-3 mEq/L of Total CO2 (electrolyte). A
difference of > 4 mEq/L = technical error
[H+] in nmol/L = 24 × PaCO₂/HCO₃](https://image.slidesharecdn.com/abgsandspirometry-170803072706/85/ABG-and-spirometry-6-320.jpg)
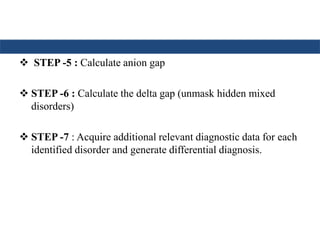
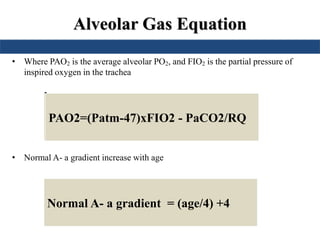
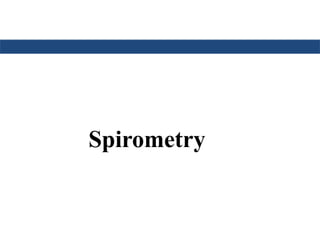
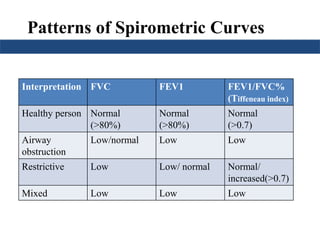
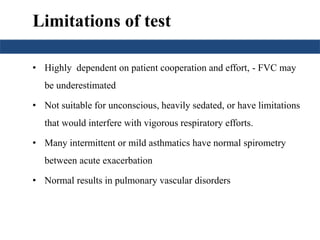
![pH is inversely related to [H+]; a pH change of
1.00 represents a 10-fold change in [H+]
pH [H+] in nanomoles/L
7.00 100
7.10 80
7.30 50
7.40 40
7.52 30
7.70 20
8.00 10
Relation b/w pH & H+ conc.
Step 1: Assessment of validity of test results](https://image.slidesharecdn.com/abgsandspirometry-170803072706/85/ABG-and-spirometry-7-320.jpg)
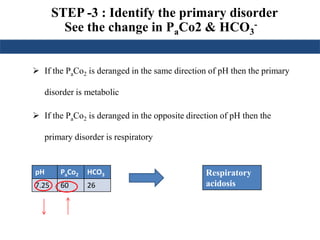
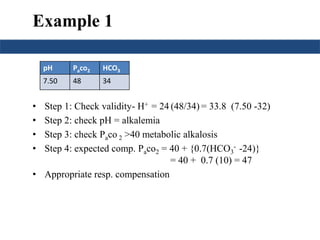
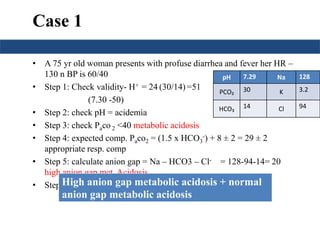
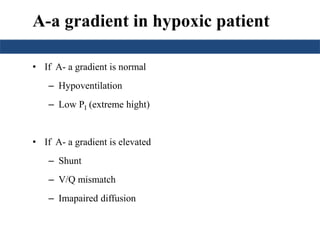
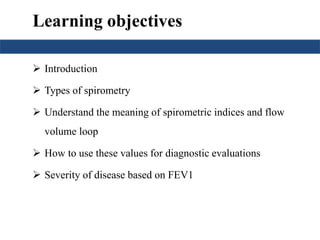
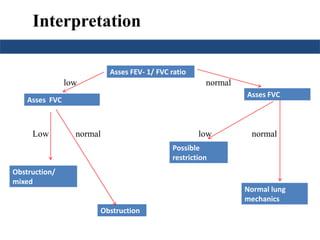
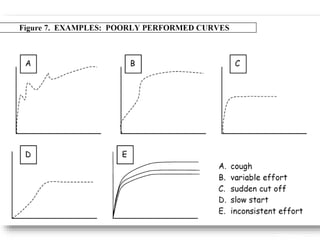
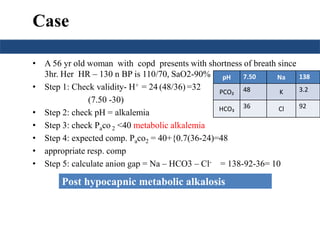
![Prediction of compensation
Metabolic acidosis PaCO2= (1.5 x HCO3
-) + 8 ± 2
Metabolic alkalosis
PaCO2 will↑ 0.75 mmHg per mmol/L ↑ in
[HCO3
-] or
PaCO2= 40 + {0.7(HCO3
- - 24)}
Respiratory
acidosis
Acute
[HCO3
-] will ↑ 1 mmol/L per 10 mmHg
in PaCO2
Chronic
[HCO3
-] will ↑ 4 mmol/L per 10 mmHg
in PaCO2
Respiratory
alkalosis
Acute
[HCO3
-] will ↓ 2 mmol/L per 10 mmHg
↓ in PaCO2
Chronic
[HCO3
-] will ↓ 4 mmol/L per 10 mmHg
↓in PaCO2](https://image.slidesharecdn.com/abgsandspirometry-170803072706/85/ABG-and-spirometry-12-320.jpg)
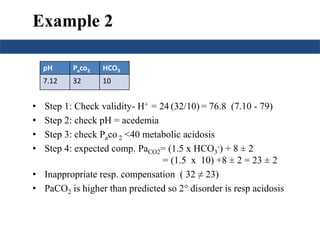
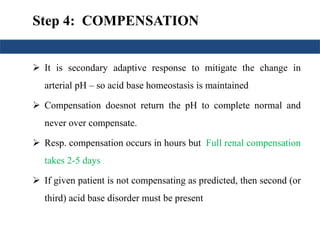
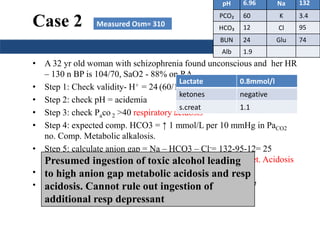
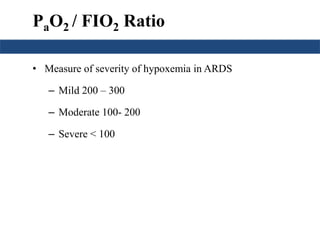
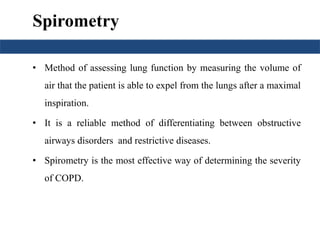
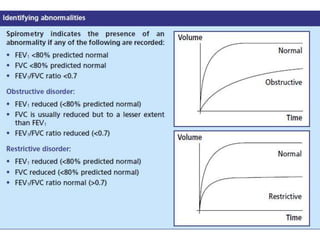
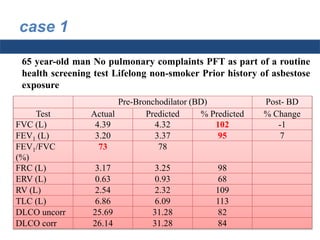
![STEP -5 : Calculate anion gap
Calculation of the anion gap is useful in the initial evaluation of
metabolic acidosis.
An elevated anion gap usually indicates the production of pathologic
acid (unmesured anion).
Total Serum Cations = Total Serum Anions
Unmeasured anions- unmeasured cations= Na+] – {[Cl-]+[HCO3-]}
Anion gap = [Na+] - [Cl-]-[HCO3-]
Up to 12 is normal anion gap](https://image.slidesharecdn.com/abgsandspirometry-170803072706/85/ABG-and-spirometry-15-320.jpg)
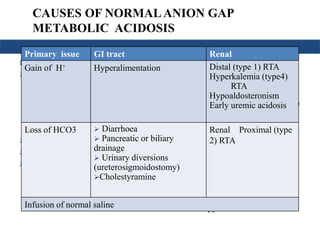
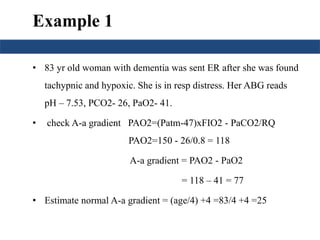
![• Albumin is the major unmeasured anion
• The anion gap should be corrected if there are gross changes in
serum albumin levels.
AG (CORRECTED) = AG + { (4 – [ALBUMIN]) × 2.5}](https://image.slidesharecdn.com/abgsandspirometry-170803072706/85/ABG-and-spirometry-16-320.jpg)
![Causes of High AG Met Acidosis
• A useful mnemonic for the most common causes is GOLD
MARRK
G - Ethylene Glycol
O - 5-oxoproline [pyroglutamic acid]
L -Lactic Acidosis – metformin ?
D – d lactate – bacterial overgrowth syndrome
M – Methanol
A- Aspirin
R- Renal Failure
R- Rhabdomyolsis
K - Ketoacidosis:
Cowen – Woods classification of lactic acidosis
Type A - hypoxic Type B — nonhypoxic
(septic shock, mesenteric
ischemia, hypoxemia,
hypovolemic shock, carbon
monoxide
poisoning, cyanide)
B1 – 2nd to
Hepatic failure
Renal failure
malignancy
B2:
Thiamine def, seizure
Toxins - salicylate, ethylene
glycol, propylene glycol,
methanol, paraldehyde
Drugs - metformin, propofol,
niacin, isoniazid, iron or NNRTI
B3 – inherited syndromes](https://image.slidesharecdn.com/abgsandspirometry-170803072706/85/ABG-and-spirometry-17-320.jpg)
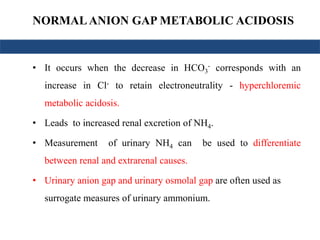
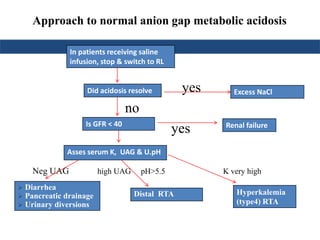
![NORMALANION GAP METABOLIC ACIDOSIS
• UAG
= [Na+ + K+]u – [Cl–]u
• Hence a -ve UAG seen in GI causes while +ve value seen in renal causes
• The urinary osmolal gap
= (2 × [Na+] + 2 × [K+]) + (urine urea nitrogen ÷ 2.8) + (urine glucose ÷ 18)
• Osmolal gap below 40 mmol/L indicates renal cause
• Urine pH
– If urine pH > 5.5 : Type 1 RTA
– If urine pH < 5.5 : Type 2 or Type 4 RTA](https://image.slidesharecdn.com/abgsandspirometry-170803072706/85/ABG-and-spirometry-20-320.jpg)
![PLASMA OSMOLAR GAP
Calculated Plasma Osmolarity = 2[Na+] + [Gluc]/18 + [BUN]/2.8
Normal Measured Plasma Osmolarity > Calculated Plasma Osmolarity
(upto 10 mOsm/L)
Measured Plasma Osmolarity - Calculated Plasma Osmolarity > 10
mOsm/kg indicates presence of abnormal osmotically active substance
Ethanol
Methanol
Ethylene glycol](https://image.slidesharecdn.com/abgsandspirometry-170803072706/85/ABG-and-spirometry-26-320.jpg)
![Saturation gap
• Saturation gap = [ SpO2 - Sa O2]
• > 5% is significant.
• Causes: methemoglobinemia
carboxyhemoglobinemia](https://image.slidesharecdn.com/abgsandspirometry-170803072706/85/ABG-and-spirometry-41-320.jpg)
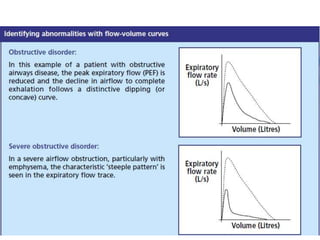
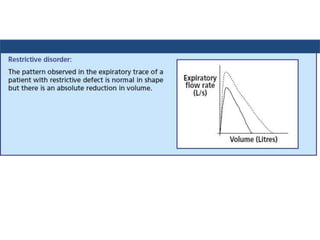
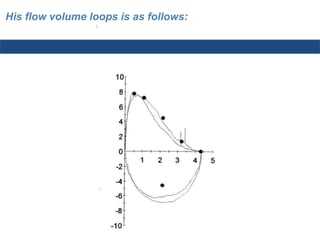
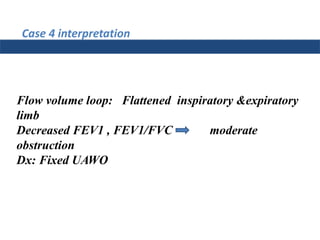


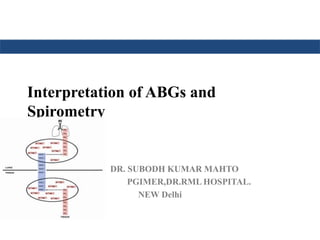
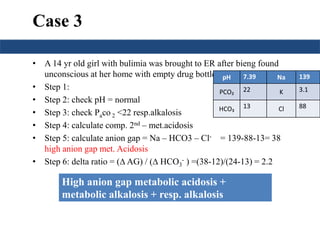
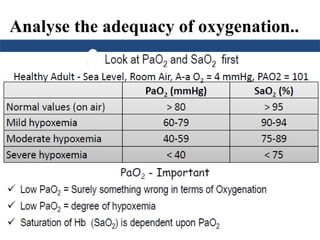
This document discusses acid-base disorders and interpretation of arterial blood gases (ABGs) and spirometry. It provides: 1. An overview of acid-base homeostasis and the three major methods to quantify acid-base disorders - the physiological approach, base-excess approach, and physicochemical approach. 2. The normal ranges for parameters in an ABG report like pH, PaCO2, PaO2, HCO3, and SaO2. 3. A step-wise approach to solving acid-base disorders, including assessing validity, determining if there is acidemia or alkalemia, identifying the primary disorder, assessing compensation, calculating anion gap, and calculating delta gap to


