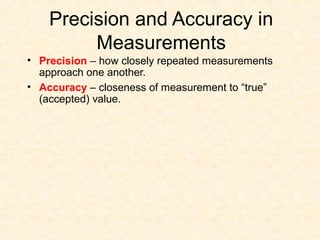
- Precision refers to how closely repeated measurements are clustered together, while accuracy describes how close measurements are to the true value. There are various ways to express accuracy and precision numerically.
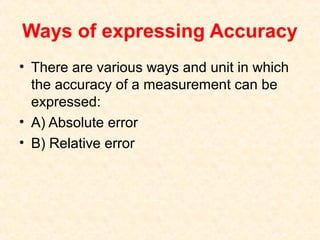
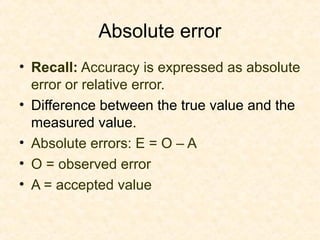
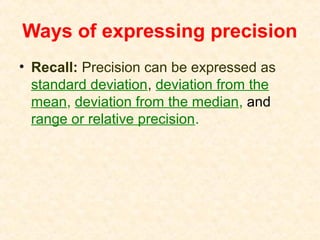
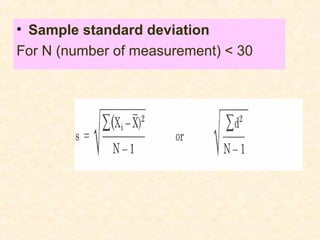
- Accuracy can be expressed as absolute error or relative error compared to the true value. Precision can be expressed using values like standard deviation, deviation from the mean/median, and range.
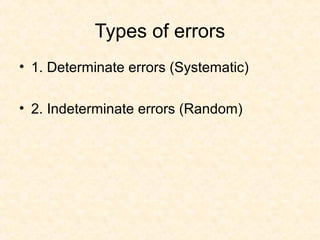
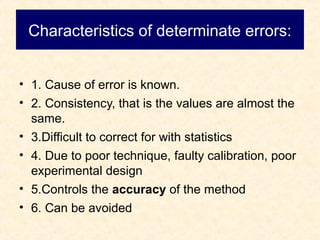
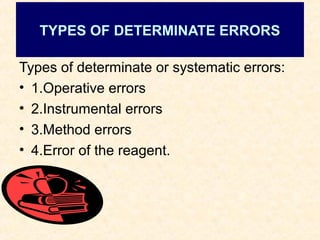
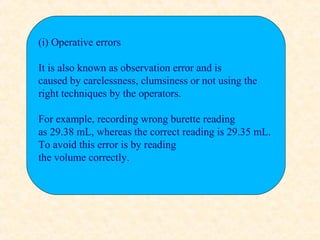
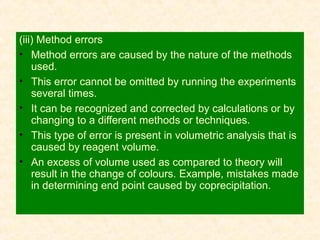
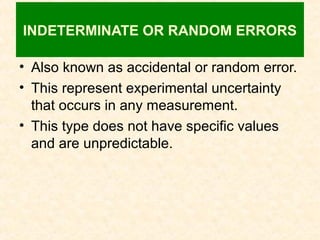
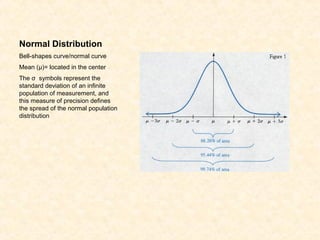
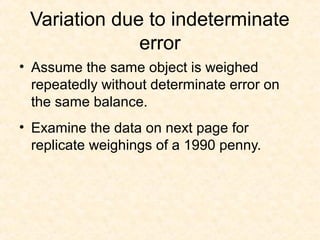
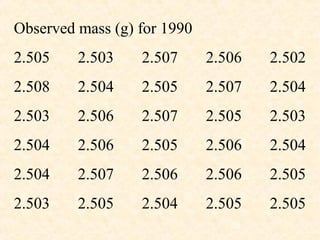
- Errors can be determinate (systematic) or indeterminate (random). Determinate errors are consistent and can be avoided, while indeterminate errors follow a normal distribution and cannot be eliminated. Statistical analysis is needed to understand random error.