Download to read offline

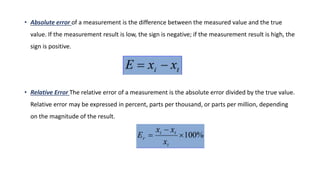
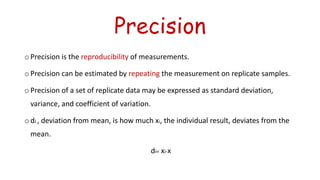
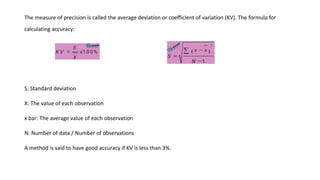
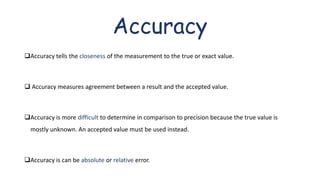
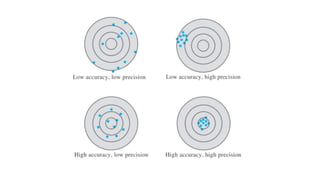
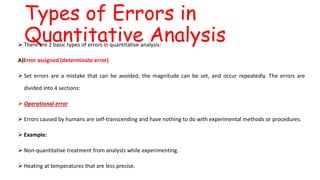


Errors refer to the differences between measured and true values in measurements and experiments. It is impossible to perform analyses that are completely free of errors. Errors are caused by faulty instruments, imprecise measurements, and random variations. Methods to reduce errors include frequent calibration of instruments, analysis of known samples, and repeating measurements. Precision refers to the reproducibility of measurements and can be estimated through repeated measurements of replicate samples. Accuracy is the closeness of a measurement to the true value and is more difficult to determine than precision. There are two main types of errors: determinate errors caused by mistakes that can be avoided, and accidental errors that are difficult to control. Methods to minimize errors include calibration, using blanks, comparative analysis techniques, and repeated