Downloaded 489 times
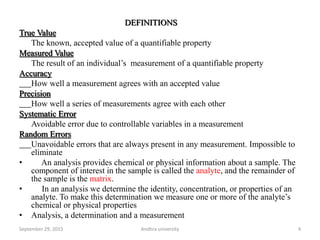
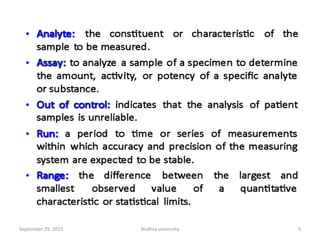
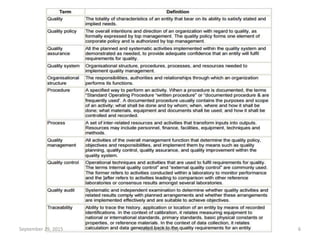
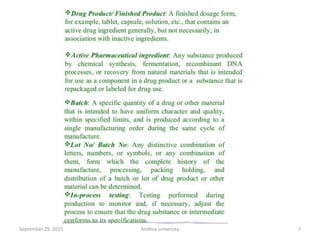
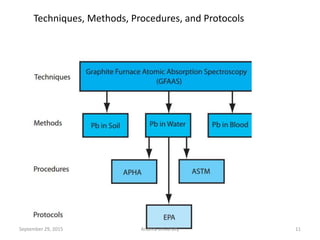

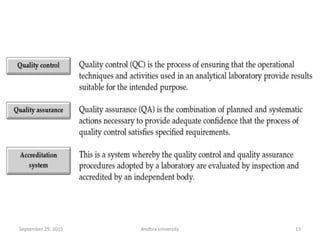
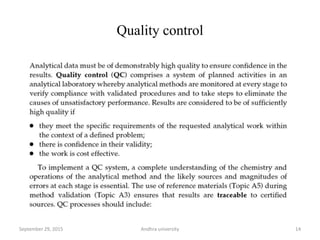
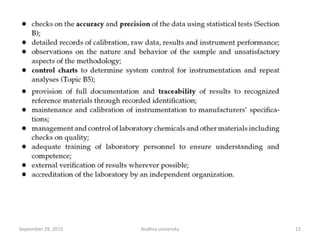
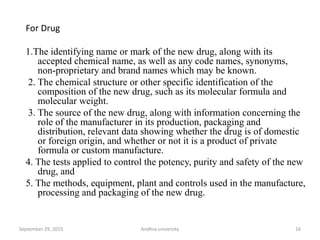

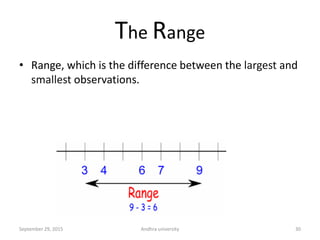
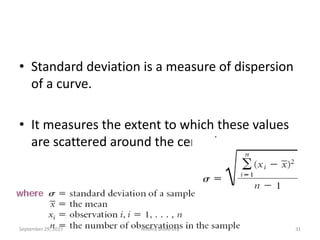
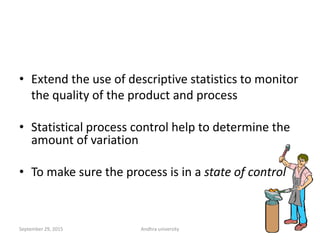
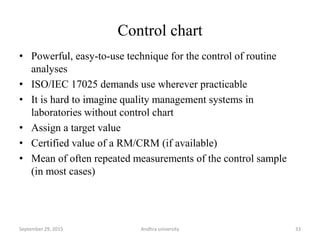
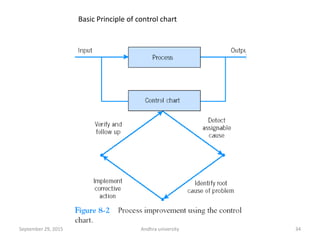
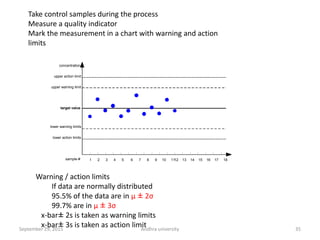
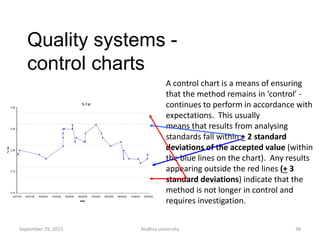
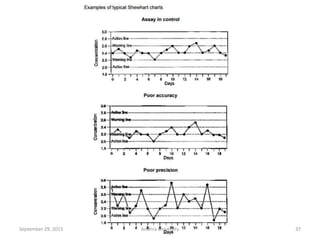


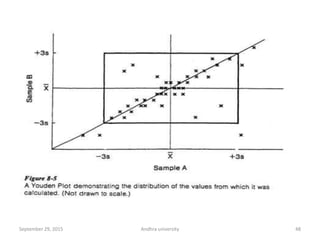


The document discusses quality control in analytical chemistry. It defines key terms like quality, accuracy, precision, bias and provides definitions from ISO standards. It states that quality control is essential for the pharmaceutical industry to ensure drugs are safe and effective. It also discusses techniques, methods and procedures used in quality control like control charts which are used to monitor quality and determine if a process is in a state of control. Statistical process control using measures like mean, range and standard deviation are used to monitor quality of products and processes.


![谷歌留痕技术 [ 𝙩𝙤𝙥 𝟮𝟯𝟯. 𝙘 𝙤𝙢 ]](https://cdn.slidesharecdn.com/ss_thumbnails/top233-260130174328-3833018c-thumbnail.jpg?width=640&height=640&fit=bounds)